. 2021 Jan;29(1):100-112.
doi: 10.1016/j.joca.2020.08.014. Epub 2020 Nov 6.

Lysosomal dysfunction in osteoarthritis and aged cartilage triggers apoptosis in chondrocytes through BAX mediated release of Cytochrome c

Affiliations

Lysosomal dysfunction in osteoarthritis and aged cartilage triggers apoptosis in chondrocytes through BAX mediated release of Cytochrome c

M Y Ansari et al. Osteoarthritis Cartilage. 2021 Jan.

Abstract

Objective: Lysosomes are the major catabolic organelle of the cell and regulate the macromolecular and organelle turnover and programmed cell death. Here, we investigated the lysosome dysfunction in cartilage and its role in chondrocytes apoptosis and the associated mechanism.

Design: Lysosomal acidification in Osteoarthritis (OA) and aged cartilage was determined by LysoSensor staining. Lysosomal function in chondrocytes was blocked by siRNA mediated depletion of Lysosomal Associated Membrane Protein 2 (LAMP2) or with lysosome inhibitors. Chondrocyte apoptosis was determined by LDH release, Caspase-3/7 activation, TUNEL and PI uptake assays. Loss of mitochondrial membrane potential (MMP/ΔΨM) and mitochondrial superoxide level was determined by JC-1 and MitoSOX staining, respectively. Colocalization of mitochondria with BCL2 associated X (BAX) and Cytochrome c was determined by immunostaining. Destabilization of medial meniscus (DMM) was performed to induce OA in mice.

Results: Lysosomal acidification was found to be significantly decreased in aged mouse and human and mouse OA cartilage which also showed increased chondrocyte apoptosis. Inhibition of lysosomal function resulted in increased oxidative stress, accumulation of dysfunctional mitochondria and apoptosis in chondrocytes in monolayer and in cartilage explant cultures. Depletion of LAMP2 expression or treatment of chondrocytes with lysosomal function inhibitors increased the expression and mitochondrial translocation of BAX leading to Cytochrome c release. Lysosomal dysfunction-induced apoptosis in chondrocytes was not blocked by antioxidants MitoTempo or Diphenyleneiodonium (DPI) but was abrogated by inhibiting BAX.

Conclusion: Lysosomal dysfunction induce apoptosis in chondrocytes through BAX-mediated mitochondrial damage and release of Cytochrome c. Our data points to lysosomal function restoration and/or BAX inhibition in chondrocytes as a therapeutic approach for OA.

Keywords: Ageing; LAMP1; LAMP2; Lysosomes; Mitochondrial dysfunction; Redox.


Conflict of interest statement

Conflict of Interest: The authors declare that they have no conflict of interest.

Figures

Figure 1:
Figure 1:
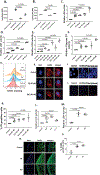
Lysosomal function is impaired in OA and aged cartilage. (A) Quantification of LAMP1, LAMP2 and CD63 in normal and OA cartilage by qPCR. (B) Representative images of IHC staining of LAMP1 in normal (n=5) and OA cartilage (n=7, Mankin score 3 and above). IgG was used as negative control. Scale bar =20 μm. (C) Quantification of LAMP1 IHC. (D) LysoSensor staining and flowcytometry of chondrocytes isolated from low-grade (n=5) and high-grade (n=5) OA cartilage. (E) Bar graph representing the percentage of cells stained with LysoSensor. (F) LAMP1 staining in mouse control and DMM joint (n=7 in each group) and (G) Quantification of LAMP1 staining. (H) qPCR analysis of LAMP1, LAMP2 and CD63 expression in young (8-weeks) and aged (52-weeks) mouse cartilage. (I) LAMP1 immunofluorescence staining in 8-weeks and 52-weeks old mice joints and (J) quantification of LAMP1 immunofluorescence staining. (K) Representative images of femoral head from 8-weeks and 60-weeks old mice (n=6 in each group) stained with LysoSensor Green at every 20 μm interval. (L) Representative 3-dimensional image of the whole femoral head from 8-weeks and 60-weeks old mice. (M) Quantification of the LysoSensor MFI in 8-weeks and 60-weeks old mice femoral heads. (N) Femoral heads from 8-weeks and 60-weeks old mice stained with S/F to visualize cartilage damage due to ageing.
Figure 2:
Figure 2:
Lysosomal function is deregulated in chondrocytes under pathological conditions. (A) Primary human chondrocytes prepared from low-grade (Mankin score ≤2) OA cartilage were treated with IL-1β (5 ng/ml) for indicated time and stained with LysoSensor and analyzed by flow cytometry. (B) Chondrocytes treated with IL-1β for 48 hr and analyzed for LAMP1 expression. COX-2 and IL-6 expression analysis was used as positive control for IL-1β stimulation. (C) LAMP1, LAMP2 and CD63 expression in IL-1β treated human OA chondrocytes was determined by qPCR. (D) Representative images of chondrocytes treated with IL-1β for 48 hr followed by staining with LysoTracker. (E) quantification of lysosomal number per cell, (F) total lysosomal area in chondrocytes and (G) average area per lysosome. (H) Representative images of chondrocytes stained with LysoTracker and treated with IL-1β at 0-, 15- and 30-minutes. The white circle shows the migration of lysosome towards perinuclear space. (I) LDH activity assay in culture supernatants of human OA chondrocytes treated with IL-1β for 48 hr. (J) DAPI staining of IL-1β treated (48 hr) chondrocytes to reveal nuclear deformity and degradation. (K) LysoSensor staining of IL-1β treated (48 hr) primary mouse chondrocytes. (L) Expression levels of Lamp1, Lamp2 and CD63 in primary mouse chondrocytes treated with IL-1β. (M) LDH activity assay in culture supernatants of mouse chondrocytes treated with IL-1β. (N) mRNA expression of LAMP2 in siLAMP2 transfected chondrocytes determined by qPCR. (O) LAMP2 protein expression in siLAMP2 transfected chondrocytes (P) LDH activity assay in the culture supernatant from siLAMP2 transfected chondrocytes. (Q) LysoSensor staining in LAMP2 depleted chondrocytes. (R) LysoSensor staining in LAMP2 overexpressing TC28 cells and (S) LDH activity assay in the culture supernatant. (T) PI uptake in TC28 cells overexpressing LAMP2. (U) The overexpression of LAMP2 was validated by immunoblotting.
Figure 3:
Figure 3:
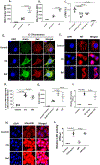
Inhibition of lysosomal function induced chondrocytes death. (A) Primary human chondrocytes (n=3) were treated with CQ or Baf for 24 hr followed by staining with LysoSensor and (B) LysoTracker. The fluorescence was recorded by flow cytometer. (C) Primary human OA chondrocytes (n=6, per treatment group) were treated with CQ (50 and 100 μM) or Baf (50 or 100 nM) for 24 hr. DMSO alone served as control. LDH activity was determined in the culture supernatants. (D) Chondrocytes were treated with CQ or Baf for indicated time and culture supernatant was harvested to determine LDH release. (E) Mouse chondrocytes (n=3) treated with indicated concentrations of CQ or Baf for 24 hr. LDH activity was determined in the culture supernatants. (F) Primary human chondrocytes (n=3) were treated with CQ (50 and 100 μM) or Baf (50 and 100 nM) for 24 hr and harvested to determine Caspase 3/7 activity. (G) TUNEL staining in primary human OA chondrocytes (n=3) treated with CQ (50 μM) or Baf (100 nM) for 24 hr. (H) LAMP1 immunofluorescence staining of chondrocytes treated with CQ or Baf. (I) DAPI staining to reveal nuclear deformation in primary human OA chondrocytes treated with CQ or Baf. Scale bar =5 μm. (J) PI uptake by primary human OA chondrocytes treated with CQ or Baf as determined by confocal microscopy (scale bar =100 μm) and (K) flow cytometry. (L) Human OA cartilage explants (n=5 per treatment group) and (M) C57BL/6 mouse femoral head (n=3 per treatment group) were treated with CQ (50 μM) or Baf (100 nM) for 48 hr and culture supernatants were collected to determine LDH activity. IL-1β stimulation of human cartilage explants was used as positive control. (N) Mouse femoral head explants treated with CQ or Baf were processed for TUNEL staining. Scale bar = 50 μm. (O) Quantification of TUNEL staining.
Figure 4:
Figure 4:
Inhibition of lysosomal function induced mitochondrial dysfunction and accumulation. (A) and (B) Accumulation of dysfunctional mitochondria in primary human OA chondrocytes treated with CQ (50 μM) or Baf (100 nM) was determined by MitoTracker (MT) staining followed by flow cytometry. Control = unstained control; MT control = MitoTracker stained control; CQ = CQ treated and MitoTracker stained chondrocytes. (C) Loss of MMP in primary human OA chondrocytes treated with CQ (50 μM) or Baf (100 nM) was determined by JC-1 staining and flow cytometry and (D) confocal microscopy. CCCP was used as positive control. Scale bar = 10 μm. (E) Fragmentation of mitochondrial network in primary human OA chondrocytes treated with CQ or Baf was determined by MitoTracker staining. Scale bar = 5 μm. (F) Quantification of chondrocytes (CCs) with fragmented mitochondria. (G) Determination of ROS production in primary human OA chondrocytes treated with CQ (50 μM) or Baf (100 nM) by DHR123 staining followed by flow cytometry, and (H) by MitoSOX staining and confocal microscopy. Scale bar = 10 μm. (I) Primary human OA chondrocytes were pretreated with MitoTempo or (J) DPI for 2 hr followed by CQ for 24 hr. The culture supernatant was collected to measure the LDH activity.
Figure 5:
Figure 5:
Inhibition of lysosomal function induced apoptosis in chondrocytes through BAX mediated release of Cyt c. (A) Expression levels of Bcl-2, BID and BAX in LAMP2 depleted primary human OA chondrocytes. (B) Ratio of BAX to Bcl-2 in LAMP2 depleted primary human OA chondrocytes. (C) Expression levels of Bid, Bax and Bcl-2 in 8-weeks and 52-weeks old mouse cartilage and (D) ratio of Bax to Bcl-2. (E) mRNA expression levels of BID, BAX and Bcl-2 in primary human chondrocytes (n=5) treated with CQ and (F) ratio of BAX to Bcl-2. (G) Protein expression levels of Bcl2, BID and BAX in primary human OA chondrocytes treated with CQ. β-Actin was used as loading control. (H) Colocalization of BAX with mitochondria stained with MitoTracker (MT). Scale bar = 10 μm. (I) Colocalization of Cytochrome c (Cyt c) with mitochondria staining with MitoTracker (MT). Scale bar = 10 μm. (J) Protein levels of Cyt c in whole cell lysate (wcl), cytosolic fraction and mitochondrial (mito) fraction of TC28 cells treated with CQ. TOM40 and α-Tubulin was used as mitochondrial and cytosolic markers. (K) LDH activity assay in the culture supernatant of primary human OA chondrocytes pretreated with BAX inhibitor (V5) followed by treatment with CQ or Baf.
Figure 6:
Figure 6:
Schematic representation of role of lysosomal function in chondrocyte apoptosis. Normal, healthy lysosomes clear the dysfunctional mitochondria and regulate mitochondrial quality control and improve cell homeostasis and survival. Loss of lysosomal membrane permeability (LMP) induces the activation of Bax leading to Cyt c release and chondrocytes apoptosis.

References

    1. Settembre C, Fraldi A, Medina DL, Ballabio A. Signals from the lysosome: a control centre for cellular clearance and energy metabolism. Nat Rev Mol Cell Biol 2013; 14: 283–296. - PMC - PubMed
    1. Mony VK, Benjamin S, O’Rourke EJ. A lysosome-centered view of nutrient homeostasis. Autophagy 2016; 12: 619–631. - PMC - PubMed
    1. Colacurcio DJ, Nixon RA. Disorders of lysosomal acidification-The emerging role of v-ATPase in aging and neurodegenerative disease. Ageing Res Rev 2016; 32: 75–88. - PMC - PubMed
    1. Nixon RA. The role of autophagy in neurodegenerative disease. Nat Med 2013; 19: 983–997. - PubMed
    1. Ansari MY, Khan NM, Ahmad I, Haqqi TM. Parkin clearance of dysfunctional mitochondria regulates ROS levels and increases survival of human chondrocytes. Osteoarthritis Cartilage 2018; 26: 1087–1097. - PMC - PubMed

Publication types