

SARS-CoV-2 infection: the environmental endurance of the virus can be influenced by the increase of temperature
- PMID: 33161149
- PMCID: PMC7644238
- DOI: 10.1016/j.cmi.2020.10.034
SARS-CoV-2 infection: the environmental endurance of the virus can be influenced by the increase of temperature
Abstract
Objectives: To evaluate whether the increase of temperature can influence the environmental endurance of severe acute respiratory syndrome coronavirus 2 (SARS-CoV-2).
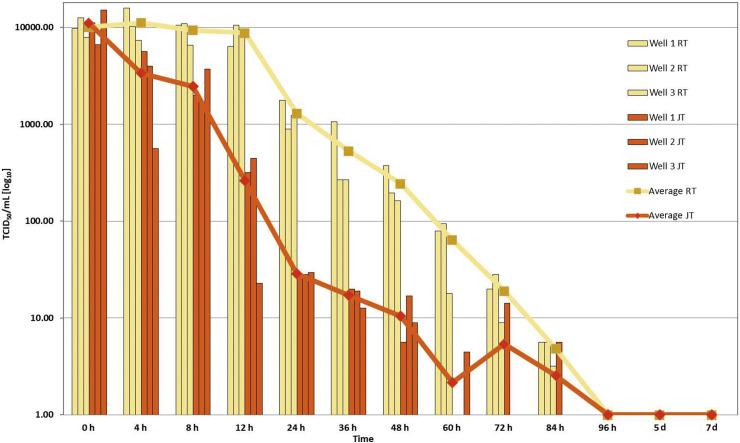
Methods: Virus was inoculated on a plastic surface and harvested at predefined time-points in parallel at 20°C-25°C (room temperature; RT) and at 28°C (June temperature; JT). Samples were tested by TCID50 titres on Vero cells.
Results: Our results confirm that fomite transmission of the emerging SARS-CoV-2 is possible: the virus reserved its ability to infect cells for up to 84 hours at both RT and JT on a plastic surface, with TCID50 viral titres of 0.67 and 0.25 log10, respectively. At RT, an important reduction in the viral titre, from 4 log10 to 3 log10 TCID50, was observed during the first 24-36 hours. At JT, the same decay was observed more rapidly (between 8 and 12 hours), The rate of viral inactivation by D-value was 24.74 hours at RT and 12.21 hours at JT.
Conclusions: This remarkable difference between the two temperatures suggests that virus vitality can be influenced by the environmental temperature and that the hot season could reduce the probability of COVID-19 transmission.
Keywords: Coronavirus disease 2019; Infectious disease; Outbreak; Severe acute respiratory syndrome coronavirus 2; Temperature; Viral spread; Viral stability.
Copyright © 2020 The Authors. Published by Elsevier Ltd.. All rights reserved.
Figures
References
-
- World Health Organization . WHO Scientific brief; Geneva: 2020. Modes of transmission of virus causing COVID-19: implications for IPC precaution recommendations. WHO.
-
- Gundy P.M., Gerba C.P., Pepper I.L. Survival of coronaviruses in water and wastewater. Food Environ Virol. 2009;1:10.
-
- Dong E., Du H., Gardner L. An interactive web-based dashboard to track COVID-19 in real time. Lancet Infect Dis. 2020 https://coronavirus.jhu.edu/map.html - PMC - PubMed
-
- Stefanelli P., Faggioni G., Lo Presti A., Fiore S., Marchi A., Benedetti E. On behalf of ISS COVID-19 study group. Whole genome and phylogenetic analysis of two SARS-CoV-2 strains isolated in Italy in January and February 2020: additional clues on multiple introductions and further circulation in Europe. Euro Surveill. 2020;25:2000305. - PMC - PubMed
MeSH terms
LinkOut - more resources
Full Text Sources
Other Literature Sources
Miscellaneous
