. 2021;11(3):857-880.
doi: 10.1016/j.jcmgh.2020.10.015. Epub 2020 Nov 5.

Inflammation-Associated Senescence Promotes Helicobacter pylori-Induced Atrophic Gastritis

Affiliations

Inflammation-Associated Senescence Promotes Helicobacter pylori-Induced Atrophic Gastritis

Qinbo Cai et al. Cell Mol Gastroenterol Hepatol. 2021.

Erratum in

  • Correction.
    [No authors listed] [No authors listed] Cell Mol Gastroenterol Hepatol. 2024;17(3):515-516. doi: 10.1016/j.jcmgh.2023.11.010. Epub 2024 Jan 13. Cell Mol Gastroenterol Hepatol. 2024. PMID: 38220484 Free PMC article. No abstract available.

Abstract

Background & aims: The association between cellular senescence and Helicobacter pylori-induced atrophic gastritis is not clear. Here, we explore the role of cellular senescence in H pylori-induced atrophic gastritis and the underlying mechanism.

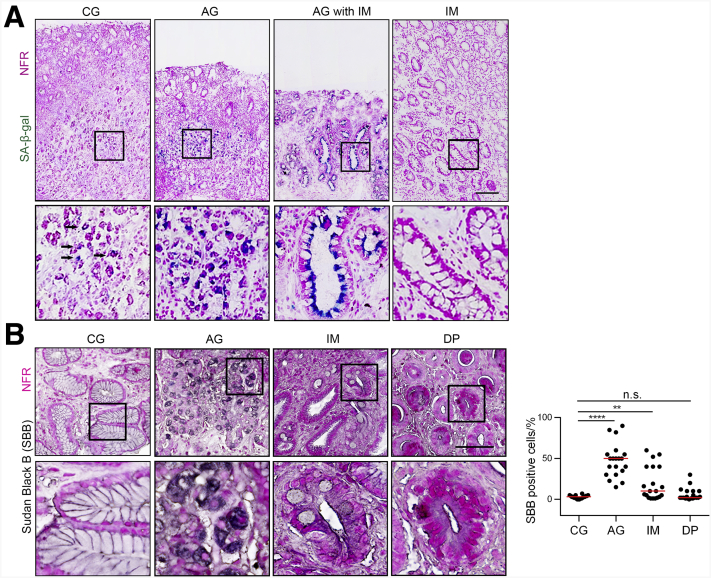
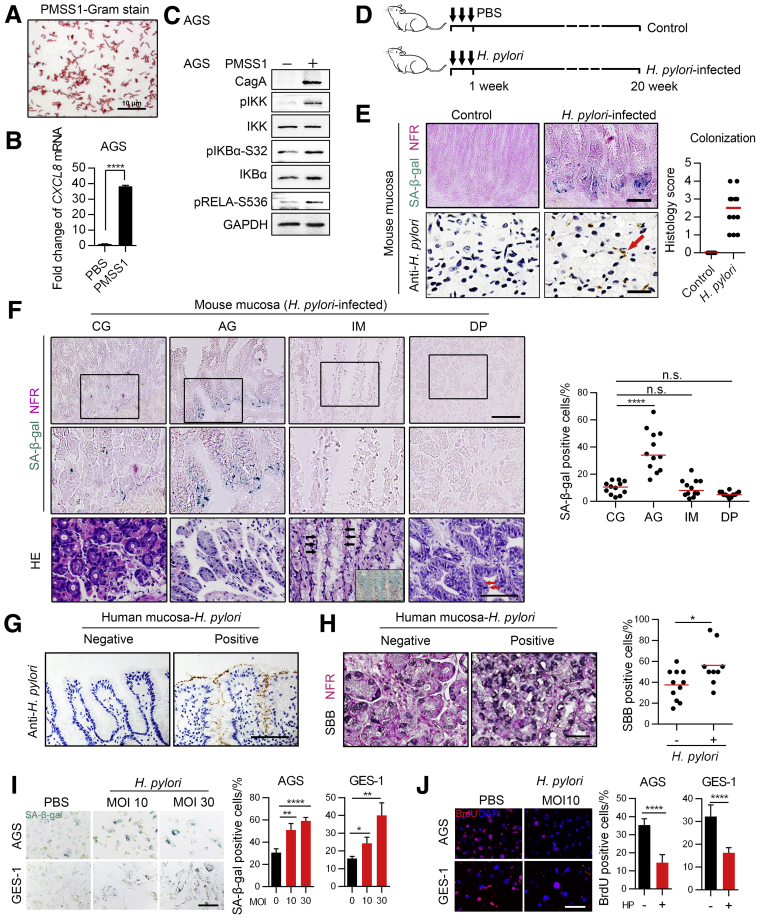
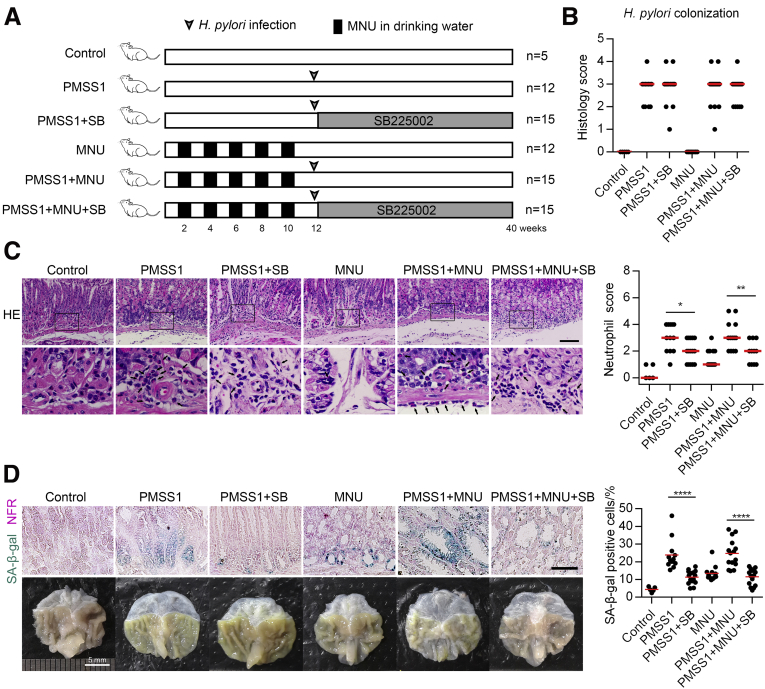
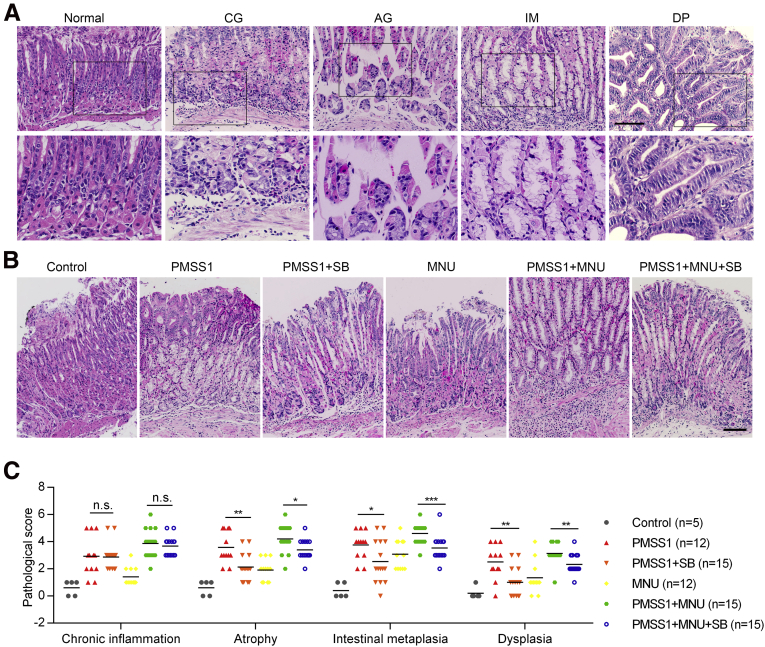
Methods: C57BL/6J mice were infected with H pylori for biological and mechanistic studies in vivo. Gastric precancerous lesions from patients and mouse models were collected and analyzed using senescence-associated beta-galactosidase, Sudan Black B, and immunohistochemical staining to analyze senescent cells, signaling pathways, and H pylori infection. Chromatin immunoprecipitation, luciferase reporter assays, and other techniques were used to explore the underlying mechanism in vitro.

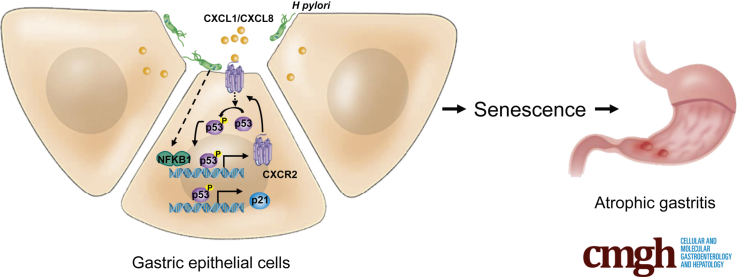
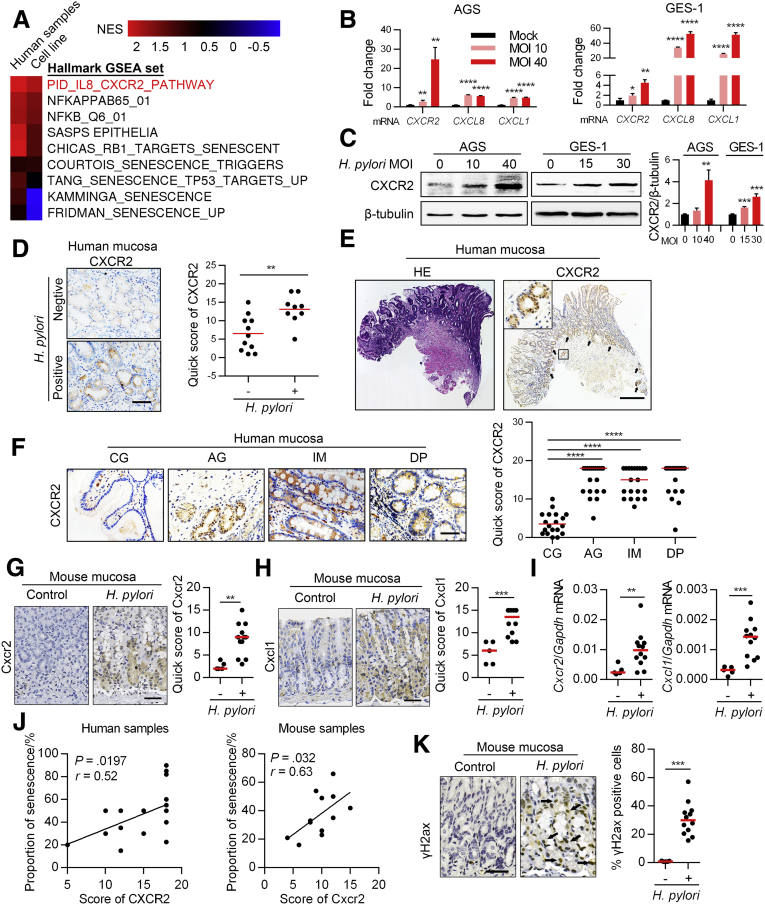
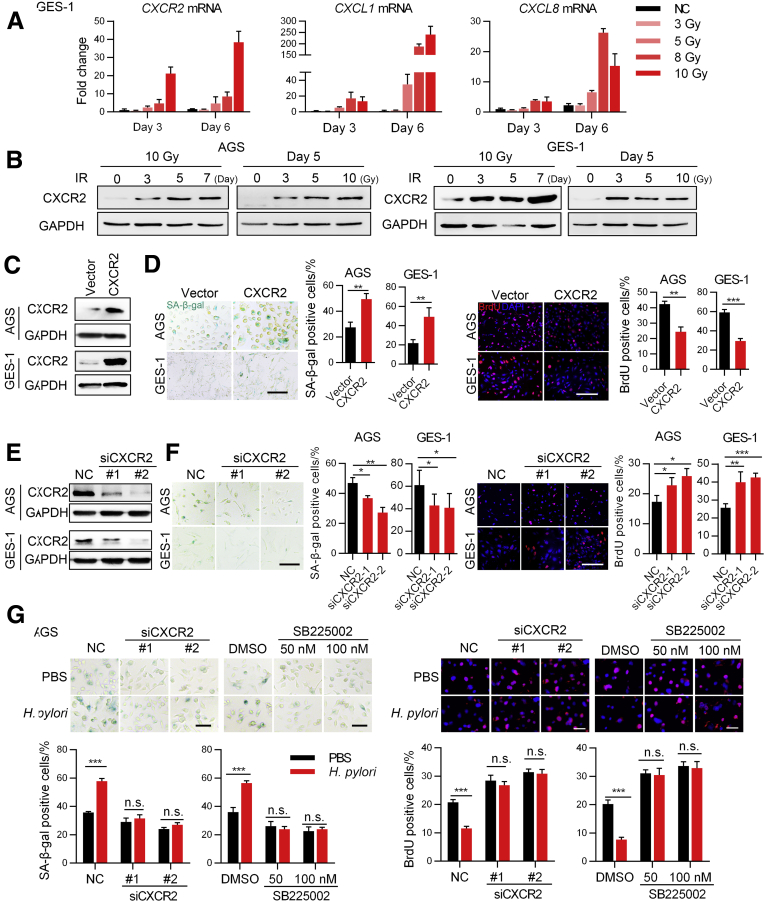
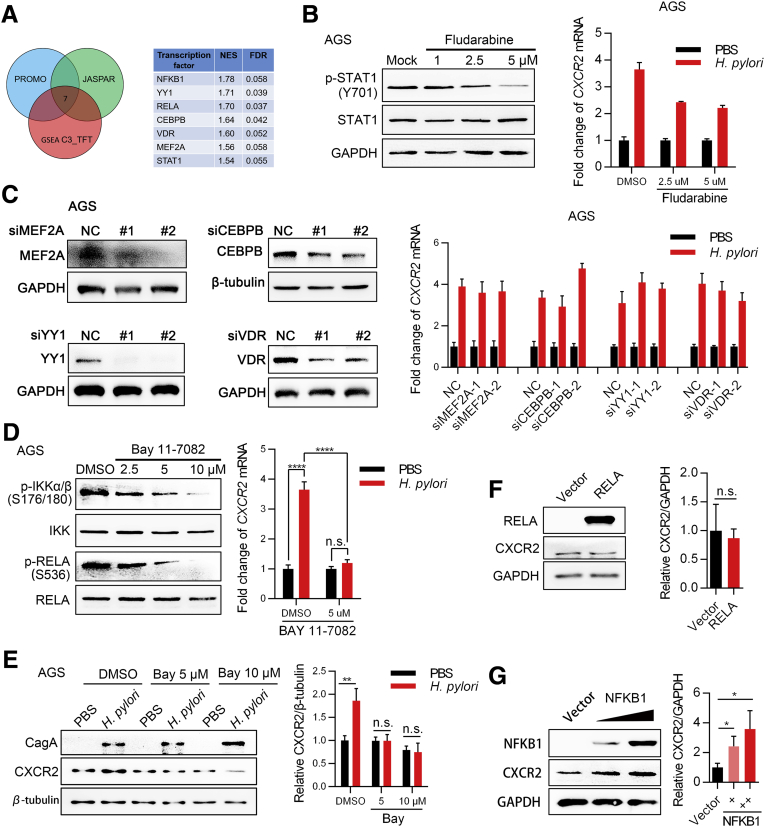
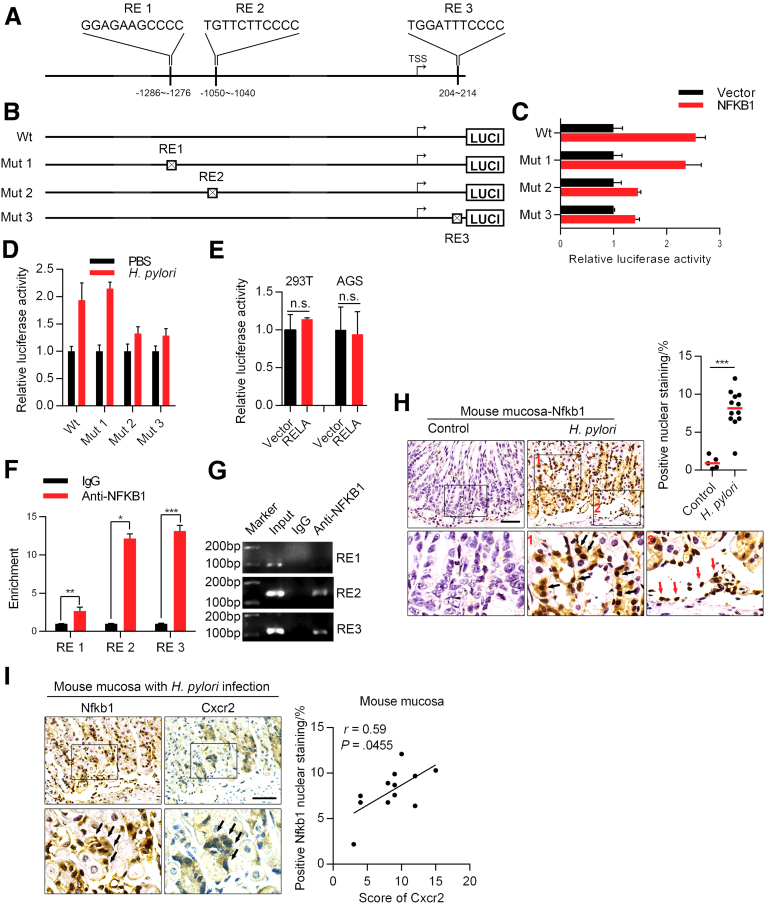
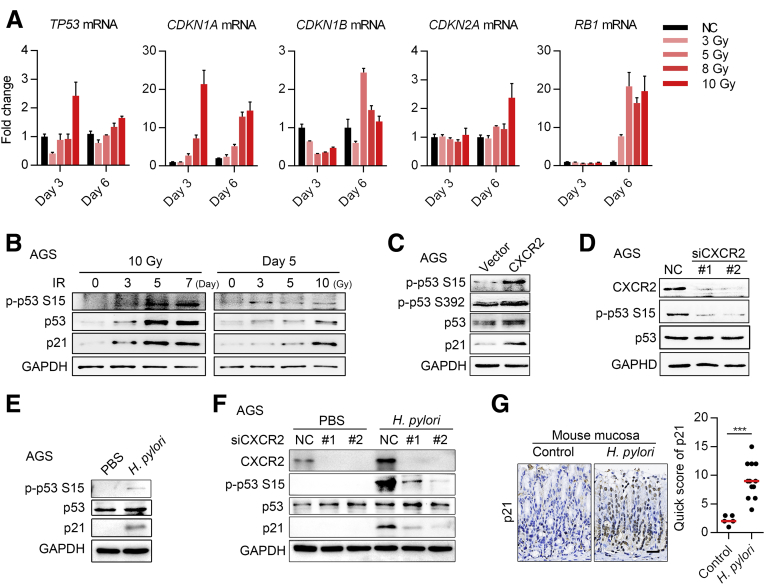
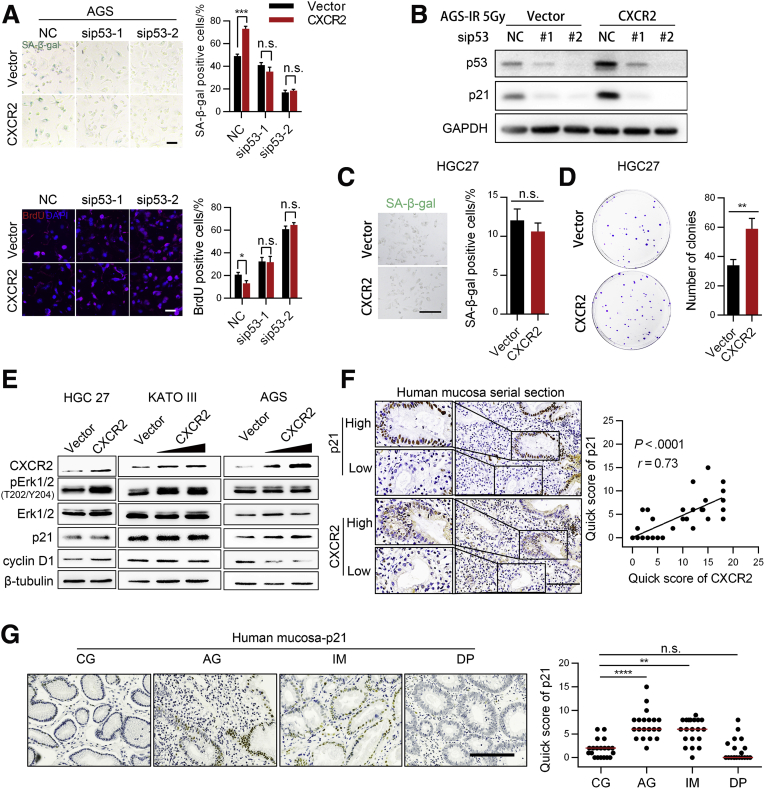
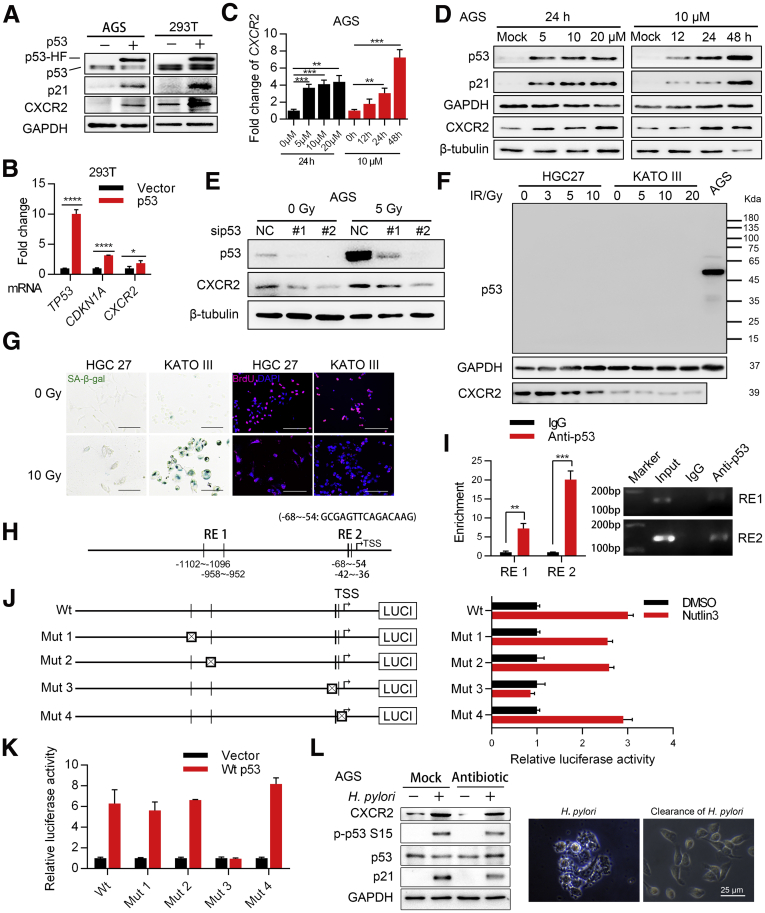
Results: Gastric mucosa atrophy was highly associated with cellular senescence. H pylori promoted gastric epithelial cell senescence in vitro and in vivo in a manner that depended on C-X-C motif chemokine receptor 2 (CXCR2) signaling. Interestingly, H pylori infection not only up-regulated the expression of CXCR2 ligands, C-X-C motif chemokine ligands 1 and 8, but also transcriptionally up-regulated the expression of CXCR2 via the nuclear factor-κB subunit 1 directly. In addition, CXCR2 formed a positive feedback loop with p53 to continually enhance senescence. Pharmaceutical inhibition of CXCR2 in an H pylori-infected mouse model attenuated mucosal senescence and atrophy, and delayed further precancerous lesion progression.

Conclusions: Our study showed a new mechanism of H pylori-induced atrophic gastritis through CXCR2-mediated cellular senescence. Inhibition of CXCR2 signaling is suggested as a potential preventive therapy for targeting H pylori-induced atrophic gastritis. GEO data set accession numbers: GSE47797 and GSE3556.

Keywords: C-X-C Motif Chemokine Receptor 2; H pylori; Mucosa Atrophy; Senescent Cell.


Figures

None
Graphical abstract
Figure 1
Figure 1
Cellular senescence is highly associated with H pylori–induced atrophic gastritis. (A) Mucosa images (from antrum) from a representative patient diagnosed with CG, AG, and IM. Senescent cells are stained with SA-β-gal. Scale bar: 200 μm. Black arrows refer to SA-β-gal–positive cells. (B) Senescent cells were detected by Sudan Black B staining in human mucosa biopsy samples (from antrum, 20 patients diagnosed with CG, AG, IM, and DP at the same time). CG was restricted to mucosa without AG, IM, or DP. AG was restricted to atrophic mucosa without IM or DP. IM was restricted to mucosa without DP. Plot: median. Scale bar: 100 μm. Significant differences were analyzed using the Mann–Whitney test. The boxed areas show where the larger image in the down panel come from. ∗∗P < .01. ∗∗∗∗P < .0001. NFR, nuclear fast red.
Figure 2
Figure 2
H pylori promotes gastric epithelial cell senescence. (A) Gram staining of PMSS1. (B) CXCL8 mRNA was measured using qPCR after AGS cells were infected with PMSS1 for 8 hours. Means ± SD. Representative of 2 independent repeats analyzed by an unpaired t test. (C) NF-κB signaling was assessed using Western blot analysis after AGS cells were infected with PMSS1 for 8 hours. This process was repeated twice. (D) Schematic diagram of the H pylori–infected mouse model. (E) SA-β-gal staining (left upper panel) and IHC staining of H pylori colonization (left lower panel) in the H pylori–infected and control mouse groups (samples are from antrum). Right: The histology score of H pylori colonization is shown. Plot: median. The red arrow refers to typical H pylori staining (S shape). Scale bar: 100 μm (upper panel); 50 μm (lower panel). (F) Senescent cells were detected by SA-β-gal staining in mucosa samples from PMSS1-infected mice (n = 12). Quantification was performed according to pathologic types (the 4 diagnoses were defined according to the same strategy we used in Figure 1B; n = 12 for each category). Plot: median. Lower: Representative H&E images are shown. Black arrow: Typical goblet cells. Representative Alcian blue staining of goblet cells also is shown in the bottom right of the H&E image. Red arrow: Typical nuclear dysplasia. Scale bar: 100 μm. All images were taken from the antrum except that images about IM were from the junction between the antrum and corpus. (G) Representative human mucosa samples (from antrum) negative and positive for H pylori infection as detected using IHC. (H) Senescent cells detected by Sudan Black B in H pylori–negative and H pylori–positive human precancerous lesions (from antrum). Senescent cells were analyzed only in atrophic mucosa without IM or DP. Samples from 20 patients diagnosed with CG, AG, IM, and DP. n (negative) = 11, n (positive) = 9. Plot: median. Mann–Whitney test. (I and J) SA-β-gal staining and BrdU labeling in AGS and GES-1 cells. Cells were first exposed to 5 Gy radiation to induce senescence and then co-cultured with H pylori strain PMSS1 for 5 days (means ± SD, unpaired t test). (G–J) Scale bar: 50 μm. ∗P < .05. ∗∗P < .01. ∗∗∗∗P < .0001. GAPDH, glyceraldehyde-3-phosphate dehydrogenase; NFR, nuclear fast red; SBB, Sudan Black B.
Figure 3
Figure 3
H pylori promotes gastric epithelial cell senescence via CXCR2 signaling. Part A. (A) GSEA of senescence-associated pathways in H pylori infection using GSE47797 (human samples with H pylori–associated gastritis) and GSE3556 (AGS cell line infected with wild-type H pylori G27, which is CagA positive) from the GEO data set. NF-κB pathways were used as a positive control in the analyses. (B) Expression of CXCR2 and its important ligands was assessed using qPCR in gastric epithelial cell lines after infection with H pylori for 12 hours (means ± SD, unpaired t test). (C) CXCR2 expression was assessed using Western blot analysis in gastric epithelial cell lines after infection with H pylori. qPCR and Western blot in (B and C) were repeated 3 times independently. (D) CXCR2 expression was evaluated using IHC in human gastric mucosa samples. Samples were grouped according to H pylori infection status, which was assessed via IHC as described in Figure 2G. Samples were from the 20 patients diagnosed with gastric precancerous lesions. n (H pylori negative) = 11, n (H pylori positive) = 9. Plot: median. IHC scores were analyzed using the Mann–Whitney test. (E) CXCR2 was highly expressed in atrophic glands, especially the base glands. Black arrows: typical atrophic glands. (F) CXCR2 expression was evaluated using IHC in different pathologic types of human tissue samples. Samples were from 20 patients diagnosed with CG, AG, IM, and DP. The 4 diagnoses were defined according to the same strategy we used in Figure 1B. Left: representative images. Plot: median. Mann–Whitney test. (G and H) IHC analysis of CXCR2 and CXCL1 in mouse mucosa (Mann–Whitney test). (I) qPCR analysis of Cxcr2 and Cxcl1 mRNA in mouse mucosa (Mann–Whitney test). (J) Correlation of CXCR2 and cellular senescence in human and mouse mucosa (Spearman test). (K) IHC of γH2ax staining in mouse mucosa (Mann–Whitney test). Black arrows: typical nuclear staining of γH2ax. All histology images were taken from the antrum. ∗P < .05. ∗∗P < .01. ∗∗∗P < .001. ∗∗∗∗P < .0001. NES, normalized enrichment score.
Figure 4
Figure 4
H pylori promotes gastric epithelial cell senescence via CXCR2 signaling. Part B. (A) qPCR and (B) Western blot showing changes in the expression of CXCR2 and its ligands in the DNA damage–induced senescence model (means ± SD, unpaired t test). Two independent replicates were performed. (C) CXCR2 expression was evaluated using Western blot analysis after AGS and GES-1 cells were transfected with lentivirus encoding CXCR2. (D) SA-β-gal and BrdU staining showing senescent cells. Cells were transfected with lentivirus encoding CXCR2 or a control vector and then exposed to 5 Gy X-ray, followed by culture for another 5 days before staining (means ± SD, unpaired t test). Scale bar: 50 μm. (E) Western blot analysis detecting CXCR2 expression in AGS and GES-1 cells transfected with CXCR2 small interfering (si)RNA or negative control sequences. (F) SA-β-gal and BrdU staining showing senescent cells. Cells were exposed to 5 Gy X-ray after transfection and then cultured for another 5 days before staining (means ± SD, unpaired t test). Scalebar: 50 μm. (G) AGS cells were first transfected with CXCR2 siRNA or treated with SB225002 and then exposed to 5 Gy X-ray. After that, the cells were cocultured with PBS or PMSS1. SA-β-gal staining and BrdU labeling were performed 5 days later (means ± SD, unpaired t test). Scale bar: 20 μm. All of the results are representative of 3 independent experiments. ∗P < .05. ∗∗P < .01. ∗∗∗P < .001. DMSO, dimethyl sulfoxide; GAPDH, glyceraldehyde-3-phosphate dehydrogenase; NC, negative control.
Figure 5
Figure 5
H pylori transcriptionally up-regulates CXCR2 expression via NFKB1. (A) Transcription factors that were up-regulated by CagA and predicted to bind directly to the promoter region of CXCR2 according to the databases PROMO and JASPAR. For GSEA, the GEO data set GSE3556 was used. NES ≥ 1.5, NOM P value ≤ .05, FDR ≤ 0.25. (B) Inhibition of the signal transducer and activator of transcription 1 (STAT1) pathway with fludarabine was evaluated in AGS cells using Western blot analysis (left panel). Cells were treated with fludarabine and then incubated with PMSS1 for 12 hours. Samples then were harvested for qPCR analysis of CXCR2 mRNA expression (right panel). Means ± SD. (C) The efficiency of several small interfering (si)RNAs was evaluated using Western blot analysis in AGS cells (left). AGS cells were transfected with siRNA for 48 hours and then incubated with PMSS1 for 12 hours. Samples then were harvested for qPCR analysis of CXCR2 mRNA (right panel). Means ± SD. (D and E) Inhibition of the NF-κB signaling pathway with Bay11-7082 for 14 hours in AGS cells was evaluated using Western blot analysis. For H pylori infection, AGS cells were first treated with BAY 11-7082 for 2 hours, followed by H pylori infection for 12 hours. (D) Right: means ± SD, unpaired t test. (E) Cells under the same conditions also were harvested for Western blot analysis. (F) AGS cells were transfected with RELA or vector plasmid for 48 hours and then collected for Western blot analysis. (G) AGS cells were transfected with the NFKB1 plasmid for 48 hours and then collected for Western blot analysis. All the Western blot and qPCR results were repeated 3 times. ∗P < .05. ∗∗P < .01. ∗∗∗∗P < .0001. CEBPB, CCAAT enhancer binding protein beta; DMSO, dimethyl sulfoxide; GAPDH, glyceraldehyde-3-phosphate dehydrogenase; NC, negative control; VDR, vitamin D receptor.
Figure 6
Figure 6
NFKB1 directly up-regulates CXCR2. (A) Diagram showing the NFKB1 transcription response element (RE) in the CXCR2 promoter region predicted by PROMO and JASPAR. (B) Diagram of wild-type (Wt) and mutant (Mut) reporters. Each predicted RE was deleted in 1 mutant reporter. (C) Relative luciferase activity of different promoters in 293T cells transfected with the NFKB1 plasmid or empty vector (means ± SD). (D) Relative luciferase activity of the wild-type and mutant promoters in AGS cells infected with H pylori or PBS for 48 hours. (E) Relative luciferase activity of the wild-type promoter in 293T and AGS cells transfected with RELA plasmid or empty vector. Luciferase experiments were performed 3 times and analyzed with an unpaired t test. (F) Enrichment of the 3 predicted response elements from ChIP analysis (repeated twice, means ± SD, unpaired t test). (G) DNA agarose gel electrophoresis displaying representative results from 2 independent ChIP experiments. (H) IHC analysis of NFKB1 in mouse mucosa (from antrum, Mann–Whitney test). Black arrows show typical positive nuclear staining of NFKB1. Red arrows show positive control of NFKB1 nuclear staining in the infiltrated immunocytes. (I) Positive correlation between Nfkb1 activation and Cxcr2 levels (Spearman test). Left: Representative images of Nfkb1 and Cxcr2 staining from serial sections are shown (from antrum). Black arrows show representative glands where there is positive Nfkb1 nuclear staining and high expression of Cxcr2 protein. Scale bar: 50 μm. ∗P < .05. ∗∗P < .01. ∗∗∗P < .001. LUCI, luciferase.
Figure 7
Figure 7
H pylori infection activates p53–p21 signaling. (A) Expression of major senescence-associated genes as assessed using qPCR in X-ray–induced senescence in GES-1 cells (means ± SD). (B) Expression of the p53 pathway detected using Western blot analysis in AGS cells. Both qPCR and Western blot results are representative of 2 independent experiments. (C) Western blot analysis of proteins involved in the p53-associated senescence pathway in AGS cells overexpressing CXCR2. (D) Western blot analysis of proteins involved in the p53-associated senescence pathway after CXCR2 knockdown using small interfering (si)RNA. (E) Activation of p53–p21 signaling was analyzed by Western blot upon H pylori (MOI, 100) infection for 3 hours. (F) AGS cells were first transfected with CXCR2 siRNA for 48 hours, followed by H pylori (MOI, 100) infection for 3 hours. Samples then were harvested for Western blot analysis. (G) IHC analysis of p21 in mouse mucosa (from antrum). Scale bar: 100 μm. ∗∗∗P < .005. GAPDH, glyceraldehyde-3-phosphate dehydrogenase; NC, negative control.
Figure 8
Figure 8
CXCR2 promotes gastric epithelial senescence through p53–p21 signaling. (A and B) SA-β-gal and BrdU staining of AGS cells cotransfected with lentiviruses encoding CXCR2 and small interfering (si)RNA targeting TP53 mRNA for 24 hours, followed by radiation (5 Gy, means ± SD, unpaired t test). Staining was performed 5 days later. Scale bar: 50 μm. Data are representative of 3 independent experiments. Unpaired t test. (B) Representative Western blot images of p53 and p21 under this condition are shown. (C) SA-β-gal staining analysis of HGC27 cells transfected with lentiviruses encoding CXCR2. Cells were stained 5 days after exposure to 5 Gy X-ray. Scale bar: 50 μm. Means ± SD. Unpaired t test. (D) Plate colony formation assay of HGC27 cells transfected with lentiviruses encoding CXCR2. Only clones with a parameter greater than 1 mm were counted. (C) SA-β-gal staining and (D) colony formation were repeated twice independently. (E) Western blot analysis of several key proteins in proliferation-associated pathways in HGC27, KATO III, and AGS cells transfected with lentiviruses encoding CXCR2. All Western blot results shown are representative samples from 3 independent experiments. (F) Quick scores of CXCR2 and p21 in precancerous lesions from the 40 patients as determined by IHC staining. CXCR2 and p21 staining were performed in adjacent slices. Correlations were analyzed by the Spearman test. Left: Representative images are shown. (G) p21 expression in human precancerous lesions as detected by IHC (samples from 20 patients diagnosed with CG, AG, IM, and DP). Scale bar: 100 μm. Plot: median. Mann–Whitney test. All histology images were taken from the antrum. ∗∗P < .01. ∗∗∗P < .001. ∗∗∗∗P < .0001. GAPDH, glyceraldehyde-3-phosphate dehydrogenase; NC, negative control.
Figure 9
Figure 9
CXCR2 forms a positive feedback loop with p53 to enhance the cellular senescence of gastric epithelial cells. (A) Western blot analysis of CXCR2 expression in AGS and 293T cells transfected with lentiviruses encoding p53. (B) qPCR analysis of CXCR2 mRNA expression in 293T cells transfected with p53 (CDKN1A mRNA, encoding p21, was used as a positive control, means ± SD, unpaired t test). (C and D) qPCR and Western blot analyses of CXCR2 expression in AGS cells treated with Nutlin-3 in a time-dependent and dose-dependent manner. (E) Western blot analysis of p53 and CXCR2 expression in AGS cells transfected with p53 small interfering (si)RNA followed by radiation treatment. (F) Western blot analysis of CXCR2 in the HGC27 and KATO III cell lines after X-ray exposure. (G) SA-β-gal and BrdU staining of senescent HGC27 and KATO III cells after X-ray exposure. Scale bar: 50 μm. Repeated once. (H) Diagram showing the p53 transcription response element (RE) predicted by JASPAR and PROMO. (I) Enrichment scores of different REs obtained from ChIP analysis (means ± SD, unpaired t test) and exemplary DNA agarose gel electrophoresis images from 2 independent repeats. (J) Left: diagram of wild-type (Wt) and 4 mutant (Mut) reporters. Each predicted RE was deleted in 1 mutant reporter. Right: Relative luciferase activity of different promoters in AGS cells treated with Nutlin-3 (10 μmol/L) for 48 hours (means ± SD). (K) Relative luciferase activity of different promoters in 293T cells transfected with vector or wild-type p53 plasmid. Means ± SD. Luciferase data are representative of 3 independent repeats. (L) AGS cells were first infected with PMSS1 (MOI, 100) for 3 hours and then eradicated by antibiotics (penicillin and streptomycin) for 3 hours. Samples then were harvested, analyzed by Western blot, and compared with samples with active H pylori infection for 6 hours. Right: Representative images of AGS cells with H pylori infection and after H pylori eradication are shown. ∗P < .05. ∗∗P < .01. ∗∗∗P < .001. ∗∗∗∗P < .0001. DMSO, dimethyl sulfoxide; GAPDH, glyceraldehyde-3-phosphate dehydrogenase; HF, His-Flag; LUCI, luciferase; NC, negative control.
Figure 10
Figure 10
Pharmaceutical inhibition of CXCR2 attenuates gastric mucosa senescence and atrophy in vivo. (A) Diagram showing the protocol of the mouse study. (B) Colonization of H pylori in different groups assessed by histology score. (C) Neutrophil infiltration score in different groups. Left: Representative H&E images are shown. Black arrows: neutrophils. Scale bar: 100 μm. (D) Upper: Senescent cells detected using SA-β-gal staining in mouse gastric mucosa in different groups. Lower: Representative images of mouse stomachs. Scale bar: 50 μm. Plot: median. Significant differences were analyzed using the Mann–Whitney test. All histology images were taken from the antrum or the junction between the antrum and corpus. ∗P < .05. ∗∗P < .01. ∗∗∗∗P < .0001. NFR, nuclear fast red; SB, SB225002.
Figure 11
Figure 11
Inhibition of CXCR2 delays the progression of gastric precancerous lesions in an H pylori–infected mouse model. (A) Representative H&E image of different lesions observed in the stomach of the mice. All images were taken from the antrum except that representative images showing IM were taken from the corpus. (B) Representative H&E staining images of different groups. The representative images of PMSS1+MNU and PMSS1+MNU+SB groups were taken from the corpus or the junction between the corpus and antrum, and other images were taken from the antrum. (C) Histologic score in different groups based on pathologic types. Scale bar: 100 μm. Plot: median. Significant differences were analyzed using the Mann–Whitney test. ∗P < .05. ∗∗P < .01. ∗∗∗P < .005. SB, SB225002.

Comment in

References

    1. Correa P., Haenszel W., Cuello C., Zavala D., Fontham E., Zarama G., Tannenbaum S., Collazos T., Ruiz B. Gastric precancerous process in a high risk population: cohort follow-up. Cancer Res. 1990;50:4737–4740. - PubMed
    1. Correa P., Houghton J. Carcinogenesis of Helicobacter pylori. Gastroenterology. 2007;133:659–672. - PubMed
    1. Song H., Ekheden I.G., Zheng Z., Ericsson J., Nyren O., Ye W. Incidence of gastric cancer among patients with gastric precancerous lesions: observational cohort study in a low risk Western population. BMJ (Clin Res) 2015;351:h3867. - PMC - PubMed
    1. Weck M.N., Brenner H. Association of Helicobacter pylori infection with chronic atrophic gastritis: meta-analyses according to type of disease definition. Int J Cancer. 2008;123:874–881. - PubMed
    1. Adamu M.A., Weck M.N., Rothenbacher D., Brenner H. Incidence and risk factors for the development of chronic atrophic gastritis: five year follow-up of a population-based cohort study. Int J Cancer. 2011;128:1652–1658. - PubMed

Publication types

MeSH terms