Multicenter Study
. 2020 Dec:62:103096.
doi: 10.1016/j.ebiom.2020.103096. Epub 2020 Nov 5.

Computed tomography-adjusted fistula risk score for predicting clinically relevant postoperative pancreatic fistula after pancreatoduodenectomy: Training and external validation of model upgrade

Affiliations
Multicenter Study

Computed tomography-adjusted fistula risk score for predicting clinically relevant postoperative pancreatic fistula after pancreatoduodenectomy: Training and external validation of model upgrade

Yu Shi et al. EBioMedicine. 2020 Dec.

Abstract

Background: To develop a modified Fistula Risk Score (FRS) for predicting clinically relevant postoperative pancreatic fistula (CR-POPF) after pancreatoduodenectomy (PD) based on both FRS and contrast-enhanced computed tomography (CE-CT).

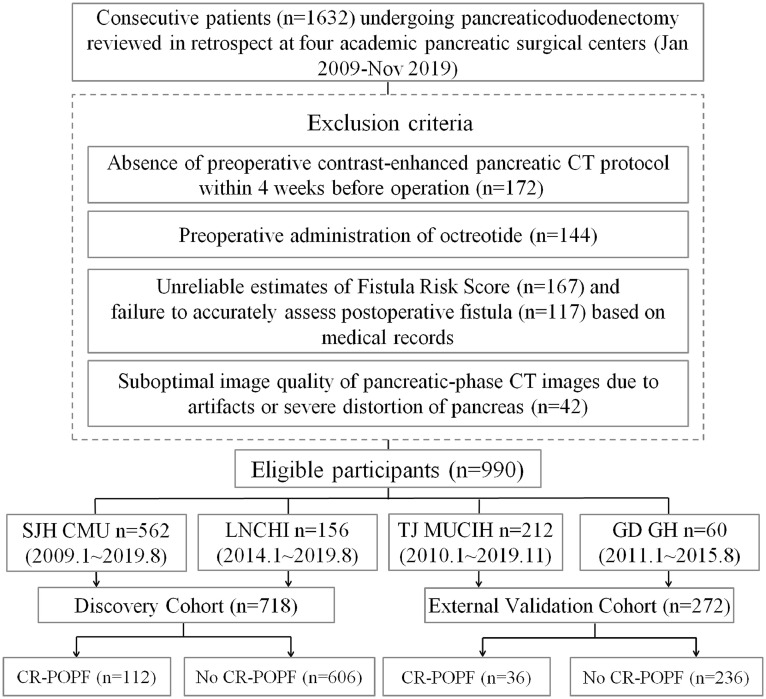
Methods: In this multicenter retrospective analysis, we focused on 990 consecutive patients with pancreatoduodenectomy performed at four institutions between 2009 and 2019. The enhanced CT-FRS model initially targeted 26 pre- and intraoperative factors, including CT descriptors, FRS elements and clinical factors, using LASSO-penalized multivariable logistic regression for predicting CR-POPF events in discovery (n = 718) and externally validated (n = 272) datasets. Probabilities generated were further correlated with histologic features of pancreatic stumps in 356 patients. C-indices were analyzed to compare the predictive potential between the original FRS and the CT-FRS.

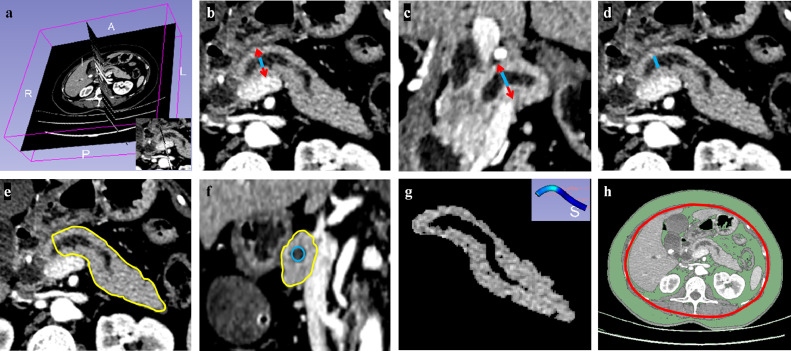
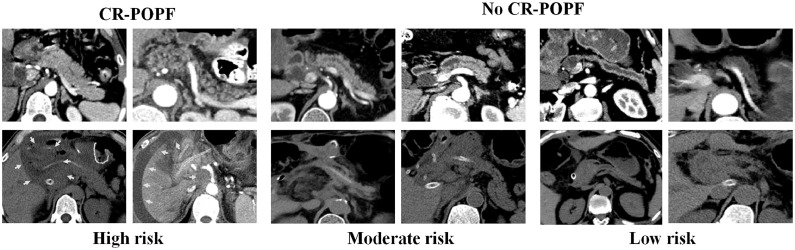
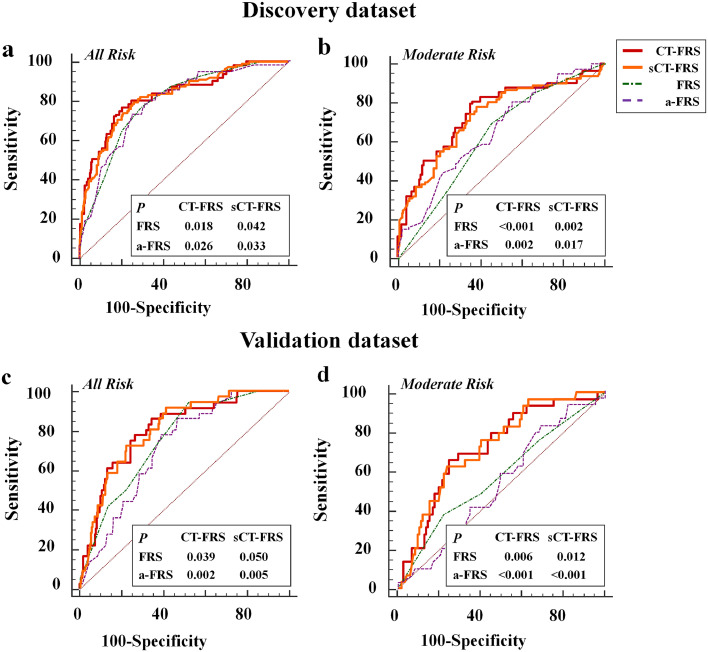
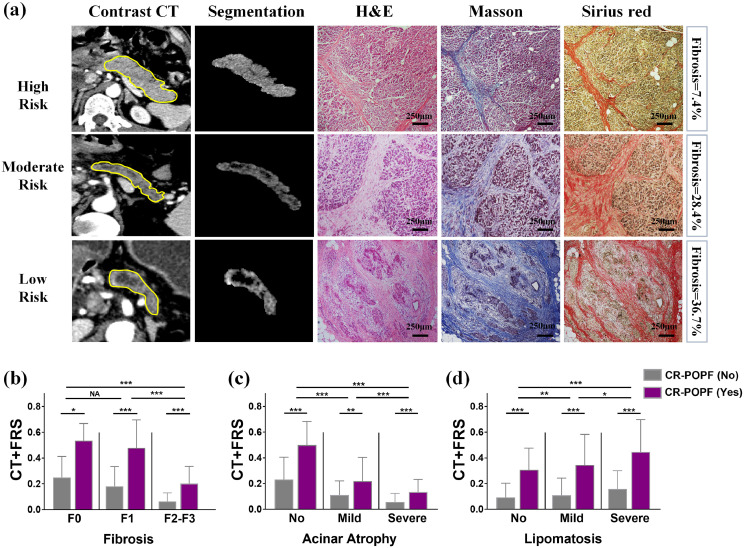
Findings: CR-POPF developed in 112 (15.6%) and 36 (13.2%) patients in discovery and validation datasets, respectively. The final CT-FRS construct, incorporating remnant pancreatic volume (RPV), stump area, fat and atrophy scores by CT, and main pancreatic duct size, offered significantly greater overall predictability than the original FRS in discovery (C-index: 0.825 vs 0.794; p = 0.04) and validation (0.807 vs 0.741; p = 0.05) cohorts. Importantly, it outperformed the FRS in patients at moderate risk levels (FRS: 3-6), showing remarkably improved C-indices (discovery: 0.729 vs 0.626 [p<0.001], validation: 0.722 vs 0.573 [p = 0.006]). CT-FRS probabilities increased in conjunction with less extensive pancreatic fibrosis (p<0.001), ample glandular acini (p<0.001), and advanced lipomatosis (p<0.001).

Interpretation: The enhanced CT-FRS performed significantly better than the original FRS in predicting CR-POPF occurrences after PD, especially at moderate FRS levels.

Keywords: Computed tomography; Pancreaticoduodenectomy; Postoperative pancreatic fistula; Risk prediction.


Conflict of interest statement

Declaration of Competing Interest None of the authors has any conflict of interest to declare. Yu Shi and Feng Gao contributed equally to this manuscript as the co-first authors.

Figures

Fig. 1
Fig. 1
Schematic of study design. CR-POPF: clinically relevant postoperative pancreatic fistula; SJH CMU: Shengjing Hospital of China Medical University; LNCHI (Liaoning Cancer Hospital and Institute); TJ MUCIH: Tianjin Medical University Cancer Institute and Hospital; GD GH: Guangdong General Hospital.
Fig. 2
Fig. 2
Representative preoperative CT images of segmentations and morphologic depictions of pancreatic remnant: (a) estimated transection line in 3D-Slicer; (b) transverse section for measuring pancreatic thickness (red arrow), subtracting diameter of main pancreatic duct (MPD, blue line) from parenchymal thickness for final figure and evaluating pancreatic atrophy by MPD-to-parenchymal thickness ratio (MPD / [thickness – MPD]) described in Table S2; (c) coronal section for measuring full pancreatic width (red arrow), subtracting MPD diameter (blue line) for final figure; (d) transverse section for measuring MPD diameter (blue line) for 0–4 scoring of Fistula Risk Score (FRS) as calculated in Table S4; (e) surface area encircled by yellow lines, indicating full pancreatic remnant; (f) Full pancreatic stump area (encircled by yellow lines) calculated by subtracting the visible MPD area from entire area of stump; (g) estimate of pancreatic remnant volume using Otsu's thresholding method (>25 HU) for automated subtraction of MPD volume from full pancreatic remnant volume by segmentation, the mean attenuation represented by mean HU value of all pixels within volume; and (h) assessment of visceral fat area (VFA).
Fig. 3
Fig. 3
Preoperative (first row) and postoperative (second row) CT images of patients with differing CT-FRS probabilities of developing clinically relevant postoperative pancreatic fistula (CR-POPF): (1) high-risk patients in columns 1–2 (probabilities: 0.709 and 0.485, respectively) with large remnant pancreatic volumes, small-sized main pancreatic ducts (MPDs size <2 mm), non-atrophic parenchyma (atrophy score ≤ 1), substantial stump areas, and fatty pancreatic remnants that increase CR-POPF risk, all showing intra-abdominal and perianastomotic fluid collection (green arrows) on postoperative CT images; (2) moderate-risk patients in columns 3 and 4 (probabilities: 0.195 and 0.134, respectively) with moderate-sized MPDs (2–5 mm) and slightly atrophic volumes, one (column 3) developing biochemical POPF and the other (column 4) devoid of CR-POPF, any type; and (3) low-risk patients in columns 5 and 6 with small atrophic glands and large-sized MPDs (>5 mm) (probabilities: 0.061 and 0.037, respectively) showing the least risk of CR-POPF, neither developing any type of CR-POPF.
Fig. 4
Fig. 4
Predictive performances of FRS, a-FRS, the full CT-FRS model and the simplified CT-FRS (sCT-FRS) model in predicting CR-POPF: Receiver operating characteristic (ROC) curves of FRS, a-FRS, CT-FRS, and sCT-FRS predictive models are plotted for (a, b) discovery and (c, d) validation cohorts. In all patients and in those with moderate risk by FRS, the two CT-FRS models fared significantly better than the original FRS and a-FRS, whereas the full and simplified CT-FRS models did not differ significantly at each task.
Fig. 5
Fig. 5
Preoperative CT findings and postoperative histologic evaluations of pancreatic stumps: (a) preoperative CT scans of patients with differing CR-POPF risks are shown, ranging from high (first row) to moderate (second row) and low (third row) risk based on CT-FRS model. In the first column, ROIs are delineated in pancreatic remnants, whereas the segmented pancreatic remnants of second column exclude ductal volumes. The final three columns reveal histologic features of remnant pancreas stained by H&E, Masson's trichrome, and Sirius Red, respectively. From high to low risk, both pancreatic fibrosis and glandular atrophy had progressed; and (b-d) CT-FRS probabilities correspond with stages of fibrosis (F0, F1, F2-F3), degrees of glandular atrophy (no [A0], mild [A1] and severe [A2]), and extents of lipomatosis (no [L0], mild [L1-L2], severe [L3]), decreasing as fibrosis and glandular atrophy advance, and increasing as lipomatosis advances. All CT-FRS probabilities in CR-POPF risk groups (purple columns) were significantly higher than those in non CR-POPF groups (gray columns) at each histologic stage or grade. Scale bars represent 250 μm.

References

    1. Nakeeb A., Lillemoe K.D., Cameron J.L. The role of pancreaticoduodenectomy for locally recurrent or metastatic carcinoma to the periampullary region. J Am Coll Surg. 1995;180(2):188–192. - PubMed
    1. Büchler M.W., Wagner M., Schmied B.M., Uhl W., Friess H., Z'graggen K. Changes in morbidity after pancreatic resection: toward the end of completion pancreatectomy. Arch Surg. 2003;138(12):1310–1314. - PubMed
    1. Poon R.T.P., Lo S.H., Fong D., Fan S.T., Wong J. Prevention of pancreatic anastomotic leakage after pancreaticoduodenectomy. Am J Surg. 2002;183(1):42–52. - PubMed
    1. Nahm C.B., Connor S.J., Samra J.S., Mittal A. Postoperative pancreatic fistula: a review of traditional and emerging concepts. Clin Exp Gastroenterol. 2018;11:105–118. - PMC - PubMed
    1. Pedrazzoli S. Pancreatoduodenectomy (PD) and postoperative pancreatic fistula (POPF): a systematic review and analysis of the POPF-related mortality rate in 60,739 patients retrieved from the English literature published between 1990 and 2015. Medicine (Baltimore) 2017;96(19):e6858. - PMC - PubMed

Publication types