. 2021 Jan;155(1):89-99.
doi: 10.1007/s00418-020-01939-w. Epub 2020 Nov 8.

Thioredoxin 1 is upregulated in the bone and bone marrow following experimental myocardial infarction: evidence for a remote organ response

Affiliations

Thioredoxin 1 is upregulated in the bone and bone marrow following experimental myocardial infarction: evidence for a remote organ response

José R Godoy et al. Histochem Cell Biol. 2021 Jan.

Abstract

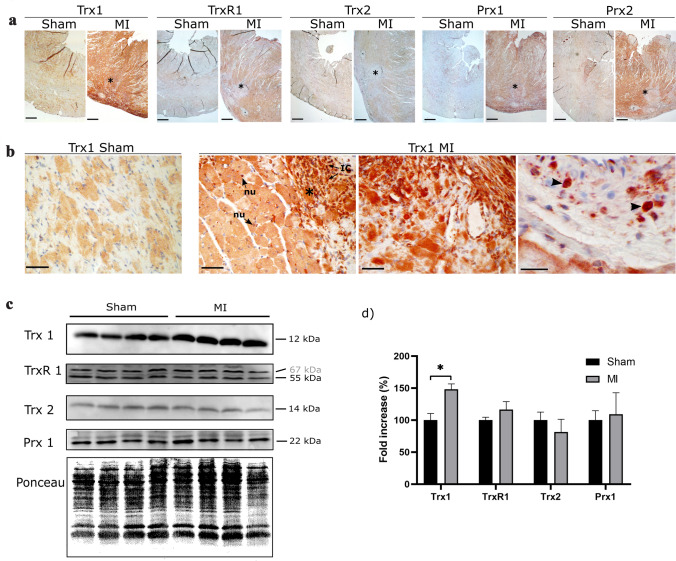
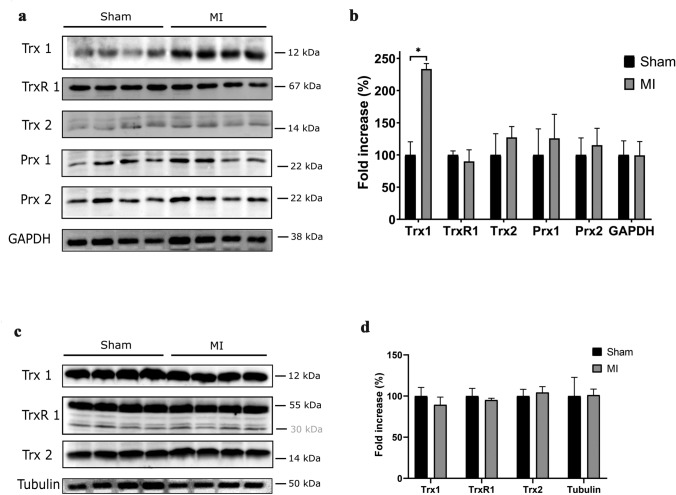
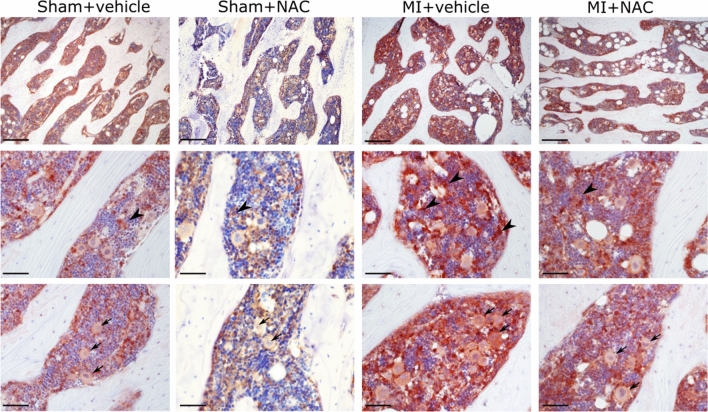
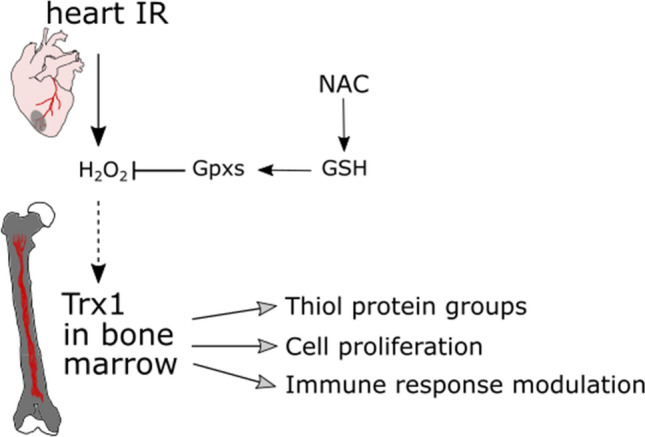
Ischemia and reperfusion events, such as myocardial infarction (MI), are reported to induce remote organ damage severely compromising patient outcomes. Tissue survival and functional restoration relies on the activation of endogenous redox regulatory systems such as the oxidoreductases of the thioredoxin (Trx) family. Trxs and peroxiredoxins (Prxs) are essential for the redox regulation of protein thiol groups and for the reduction of hydrogen peroxide, respectively. Here, we determined whether experimental MI induces changes in Trxs and Prxs in the heart as well as in secondary organs. Levels and localization of Trx1, TrxR1, Trx2, Prx1, and Prx2 were analyzed in the femur, vertebrae, and kidneys of rats following MI or sham surgery. Trx1 levels were significantly increased in the heart (P = 0.0017) and femur (P < 0.0001) of MI animals. In the femur and lumbar vertebrae, Trx1 upregulation was detected in bone-lining cells, osteoblasts, megakaryocytes, and other hematopoietic cells. Serum levels of Trx1 increased significantly 2 days after MI compared to sham animals (P = 0.0085). Differential regulation of Trx1 in the bone was also detected by immunohistochemistry 1 month after MI. N-Acetyl-cysteine treatment over a period of 1 month induced a significant reduction of Trx1 levels in the bone of MI rats compared to sham and to MI vehicle. This study provides first evidence that MI induces remote organ upregulation of the redox protein Trx1 in the bone, as a response to ischemia-reperfusion injury in the heart.

Keywords: Bone; Myocardial infarction; Oxidative stress; Peroxiredoxin; Remote organ response; Thioredoxin.


Conflict of interest statement

The authors declare that there is no conflict of interest regarding this paper.

Figures

Fig. 1
Fig. 1
Thioredoxins and peroxiredoxins levels and localization in rat hearts 1 week after sham and MI operation. a Representative pictures from the left ventricle showing Trx1, TrxR1, Trx2, Prx1, and Prx2 (asterisks indicate the infarcted area). Objective: × 2.5; scale bar: 500 µm; counterstaining: hematoxylin. b Higher magnifications of Trx1 in the heart. Asterisks indicate infarcted area. Arrows show nuclei (nu) of cardiomyocytes adjacent to the scar as well as infiltrating inflammatory cells (IC); arrowheads indicate infiltrating polymorphonuclear cells. Objectives: × 40 and × 100; scale bars: 50 µm and 25 µm, respectively; counterstaining: hematoxylin. c Levels of Trx1, TrxR1, Trx2, and Prx1 in the heart after MI or sham operation. Molecular weight expressed in grey characters indicates isoform (TrxR1). d Quantification of Western blot band intensities in c. Fold increase of redox proteins in percentage of MI versus sham-operated animals. Values represent mean ± SD; asterisk shows significant difference (P = 0.0017)
Fig. 2
Fig. 2
Levels of redox proteins in the femur and kidney of rats after MI or sham operation. a Whole femur samples were removed 1 week after surgery and lysates analyzed for levels of Trx1, TrxR1, Trx2, Prx1, and Prx2. b Quantification of Western blot band intensities in a. Fold increase of redox proteins in percentage of MI versus sham-operated animals. Values represent mean ± SD; asterisk shows significant difference (P < 0.0001). c Kidney extracts from the same animals in a were analysed for levels of Trx1, TrxR1, and Trx2. d Quantification of Western blot band intensities in c. Fold increase of redox proteins in percentage of MI versus sham-operated animals. Values represent mean ± SD
Fig. 3
Fig. 3
Localization of Trx1 in the rat bone 1 week after sham or MI surgery. Representative pictures from cortical and trabecular bone, and epiphyseal cartilage of the femur (a), and trabecular bone of the third lumbar vertebra (L3) (b) are shown. Oc osteocytes, Obl osteoblasts, Mk megakaryocytes, HPC other hematopoietic cells, BLC bone lining cells, PC zone of proliferating cartilage, HC zone of hypertrophic cartilage, nu nucleus. Objectives: × 10 (upper panel in a), × 20 (upper panel in b), × 40 lower panels; scale bars: 250 µm (upper panel a), 200 µm (upper panel in b), 50 µm lower panels; counterstaining: hematoxylin
Fig. 4
Fig. 4
Real-time PCR showing Trx1 mRNA levels in the left ventricle (a) and L5 vertebra (b) 2 weeks after MI or sham operation. Fold increase of Trx1 in percentage of MI versus sham-operated animals. Values represent the means ± SEM (n = 5 sham; n = 4 MI; P ≤ 0.05)
Fig. 5
Fig. 5
Trx1 levels in serum of MI and sham-operated rats at different times after surgery. Trx1 levels quantified by ELISA at day 2, day 8, and day 15 after MI or sham operation. Individual values of eight animals per group are shown. Mean ± SD shown for each group. Asterisk indicates significant difference (P = 0.0085)
Fig. 6
Fig. 6
Immunohistochemical analysis of Trx1 in the 5th lumbar vertebrae of rats 4 weeks after Sham and MI operation plus vehicle or N-acetyl-cysteine (NAC) treatment. Arrowheads indicate other hematopoietic cells, whereas arrows show megakaryocytes. Objectives: × 20 (upper panel) and × 40 lower panels; scale bars: 200 µm (upper panel), 50 µm lower panels; counterstaining: hematoxylin
Fig. 7
Fig. 7
Proposed mechanism of Trx1 upregulation in the bone marrow following MI. Hydrogen peroxide (H2O2) produced during IR induces Trx1 upregulation in the bone marrow. NAC treatment reduces H2O2 levels via glutathione (GSH)-dependent enzymes such as glutathione peroxidases (Gpxs) decreasing thereby Trx1 levels in the bone marrow

References

    1. Abdiu A, Nakamura H, Sahaf B, et al. Thioredoxin blood level increases after severe burn injury. Antioxid Redox Signal. 2000;2:707–716. doi: 10.1089/ars.2000.2.4-707. - DOI - PubMed
    1. Aon-Bertolino ML, Romero JI, Galeano P, et al. Thioredoxin and glutaredoxin system proteins-immunolocalization in the rat central nervous system. Biochim Biophys Acta. 2011;1810:93–110. doi: 10.1016/j.bbagen.2010.06.011. - DOI - PubMed
    1. Bertini R, Howard OM, Dong HF, et al. Thioredoxin, a redox enzyme released in infection and inflammation, is a unique chemoattractant for neutrophils, monocytes, and T cells. J Exp Med. 1999;189:1783–1789. doi: 10.1084/jem.189.11.1783. - DOI - PMC - PubMed
    1. Björnstedt M, Xue J, Huang W, et al. The thioredoxin and glutaredoxin systems are efficient electron donors to human plasma glutathione peroxidase. J Biol Chem. 1994;269:29382–29384. doi: 10.1016/S0021-9258(18)43889-6. - DOI - PubMed
    1. Cadenas S. ROS and redox signaling in myocardial ischemia–reperfusion injury and cardioprotection. Free Radic Biol Med. 2018;117:76–89. doi: 10.1016/j.freeradbiomed.2018.01.024. - DOI - PubMed