. 2020 Oct 9:11:573526.
doi: 10.3389/fimmu.2020.573526. eCollection 2020.

A Novel In-Cell ELISA Assay Allows Rapid and Automated Quantification of SARS-CoV-2 to Analyze Neutralizing Antibodies and Antiviral Compounds

Affiliations

A Novel In-Cell ELISA Assay Allows Rapid and Automated Quantification of SARS-CoV-2 to Analyze Neutralizing Antibodies and Antiviral Compounds

Lara Schöler et al. Front Immunol. .

Abstract

The coronavirus disease 2019 (COVID-19) caused by the severe acute respiratory syndrome coronavirus 2 (SARS-CoV-2) is currently the most pressing medical and socioeconomic challenge. Constituting important correlates of protection, the determination of virus-neutralizing antibodies (NAbs) is indispensable for convalescent plasma selection, vaccine candidate evaluation, and immunity certificates. In contrast to standard serological ELISAs, plaque reduction neutralization tests (PRNTs) are laborious, time-consuming, expensive, and restricted to specialized laboratories. To replace microscopic counting-based SARS-CoV-2 PRNTs by a novel assay exempt from genetically modified viruses, which are inapplicable in most diagnostics departments, we established a simple, rapid, and automated SARS-CoV-2 neutralization assay employing an in-cell ELISA (icELISA) approach. After optimization of various parameters such as virus-specific antibodies, cell lines, virus doses, and duration of infection, SARS-CoV-2-infected cells became amenable as direct antigen source for quantitative icELISA. Antiviral agents such as human sera containing NAbs or antiviral interferons dose dependently reduced the SARS-CoV-2-specific signal. Applying increased infectious doses, the icELISA-based neutralization test (icNT) was superior to PRNT in discriminating convalescent sera with high from those with intermediate neutralizing capacities. In addition, the icNT was found to be specific, discriminating between SARS-CoV-2-specific NAbs and those raised against other coronaviruses. Altogether, the SARS-CoV-2 icELISA test allows rapid (<48 h in total, read-out in seconds) and automated quantification of virus infection in cell culture to evaluate the efficacy of NAbs and antiviral drugs using reagents and equipment present in most routine diagnostics departments.

Keywords: COVID-19; SARS-CoV-2; antibodies; interferon; neutralizing; vaccine.


Figures

Figure 1
Figure 1
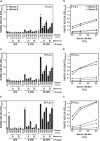
The icELISA test allows quantification of SARS-CoV-2 replication and its inhibition by antiviral compounds. (A) Caco-2 cells were infected with indicated doses of SARS-CoV-2. At 3 d p.i., cells were fixed and detected by icELISA using E- and N-specific primary antibodies. For all further icELISAs, α-N mAb1 was used. (B) Vero E6 and Caco-2 cells were infected with indicated doses of SARS-CoV-2. At 3 d p.i., cells were analyzed by icELISA. (C) Caco-2 cells were treated with indicated concentrations of IFNα2 or IFNβ. At 3 h post treatment, cells were infected with SARS-CoV-2 (MOI 0.1). Viral replication was evaluated at 3 d p.i. by icELISA. (D–F) Vero E6 cells were infected with indicated doses of SARS-CoV-2. At 6, 15, and 22 h p.i. (D, E, and F, respectively), and cells were analyzed by icELISA. Bars depict the mean values. Dots show the values of the individual measurements.
Figure 2
Figure 2
The icELISA faithfully reports on SARS-CoV-2 N protein expression. (A) Vero E6 cells were infected with indicated doses of SARS-CoV-2. At 6 h p.i., cells were fixed for icELISA analysis or lysed for immunoblot analysis. Bars depict icELISA mean values. Dots show values of individual measurements. Immunoblot analysis was performed using antibodies recognizing the N protein of SARS-CoV-2 or GAPDH. (B) Vero E6 cells were infected with SARS-CoV-2 (10,000 PFU per well) in the absence (‘w/o’) or presence of the translation inhibitor cycloheximide (‘CHX’). At 6 and 24 h p.i., cells were analyzed by icELISA. Bars depict mean values. Dots show values of individual measurements. Significance was calculated by unpaired two-tailed student´s t-test. ****p-value < 0.0001.
Figure 3
Figure 3
The icNT allows the quantification of SARS-CoV-2 NAbs as early as 6 h p.i. (A–F) 500, 5,000, and 50,000 PFU of SARS-CoV-2 were incubated with indicated dilutions of 2 convalescent sera for 1 h before Vero E6 cells were infected. At 6 h p.i. (A, B), 15 h p.i. (C, D), and 24 h p.i. (E, F), cells were analyzed by icELISA to evaluate the neutralizing capacity of the sera. (A, C, E) Bars depict the mean values. Squares, dots, and triangles show the values of the individual measurements. (B, D, F) All mean values of the different serum dilutions and virus doses were depicted in one diagram to compare the influence of the input virus amount on the course of the curve. Light gray, 500 PFU. Gray, 5,000 PFU. Dark gray, 50,000 PFU.
Figure 4
Figure 4
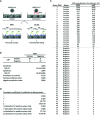
The icNT results correlate with the standard SARS-CoV-2 neutralization test. (A) Schematic representation of AEC stain-based classic NT and icELISA-based icNT. In the upper right panel, the intracellular viral antigens are missing due to the neutralization. NAb, neutralizing antibody. PRNT, plaque reduction neutralization test. POD, peroxidase. AEC, 3-amino-9-ethylcarbazole. TMB, tetramethylbenzidine. (B) Sensitivity and specificity calculation of icNT compared to the conventional PRNT. Calculations were performed using algorithms online available at https://www.medcalc.org/calc/diagnostic_test.php. (C) 200 PFU of SARS-CoV-2 were incubated with different dilutions of serum samples for 1 h before Vero E6 were infected. At 20 and 48 h p.i., neutralizing capacity was evaluated by icELISA and AEC staining with subsequent microscopic counting, respectively. The highest dilution capable to neutralize 50% of input was determined and results of PRNT and icNT were compared. The presence of detectable SARS2 NAbs (column: Status) and the 50% neutralization titers of PRNT and icNT are depicted. (D) Calculation of the correlation coefficient (r), the coefficient of determination (r2), and the p value for the entire data set shown in (C) (upper part) and the neutralizing samples (‘positive’) only (lower part).
Figure 5
Figure 5
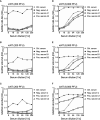
The icNT provides superior resolution upon usage of increased virus doses. (A–F) 200 or 8,000 PFU of SARS-CoV-2 were incubated with indicated dilutions of serum samples for 1 h before Vero E6 cells were infected. At 20 and 16 h p.i. (for 200 and 8,000 PFU, respectively), neutralizing capacity was evaluated by icELISA. Samples measured on the same plate are depicted in one diagram. The control serum was used as reference for all plates. Please note the different y-axis scales of the left and the right panel.
Figure 6
Figure 6
The SARS-CoV-2 icNT is specific and discriminates between serum samples either recognizing SARS-CoV-2 or other coronaviruses. (A) SARS-CoV-2 was incubated with indicated dilutions of serum samples for 1 h before Vero E6 cells were infected. Neutralizing capacity was evaluated by icELISA. Serum samples were obtained from individuals positively tested by diagnostic PCR (performed at the diagnostics department of the Institute for Virology of the University Hospital Essen) for HCoV-HKU1, HCoV-NL63, or HCoV-229E. Serum samples were taken at 2 to 3 months post symptom onset and positive PCR testing. (B) As in (A), but a serum sample of an individual who experienced co-infection of two HCoVs was used. The individual was positively tested for HCoV-229E and HCoV-OC43.

References

    1. Cui J, Li F, Shi ZL. Origin and evolution of pathogenic coronaviruses. Nat Rev Microbiol (2019) 17:181–92. 10.1038/s41579-018-0118-9 - DOI - PMC - PubMed
    1. Chen Y, Liu Q, Guo D. Emerging coronaviruses: Genome structure, replication, and pathogenesis. J Med Virol (2020) 92:418–23. 10.1002/jmv.25681 - DOI - PMC - PubMed
    1. Zhu N, Zhang D, Wang W, Li X, Yang B, Song J, et al. A Novel Coronavirus from Patients with Pneumonia in China, 2019. N Engl J Med (2020) 382:727–33. 10.1056/NEJMoa2001017 - DOI - PMC - PubMed
    1. Liu J, Zheng X, Tong Q, Li W, Wang B, Sutter K, et al. Overlapping and discrete aspects of the pathology and pathogenesis of the emerging human pathogenic coronaviruses SARS-CoV, MERS-CoV, and 2019-nCoV. J Med Virol (2020) 92:491–4. 10.1002/jmv.25709 - DOI - PMC - PubMed
    1. Mo P, Xing Y, Xiao Y, Deng L, Zhao Q, Wang H, et al. Clinical characteristics of refractory COVID-19 pneumonia in Wuhan, China. Clin Infect Dis (2020). 10.1093/cid/ciaa270 - DOI - PMC - PubMed

Publication types

MeSH terms