. 2020 Oct 9:11:590870.
doi: 10.3389/fimmu.2020.590870. eCollection 2020.

The Neat Dance of COVID-19: NEAT1, DANCR, and Co-Modulated Cholinergic RNAs Link to Inflammation

Affiliations

The Neat Dance of COVID-19: NEAT1, DANCR, and Co-Modulated Cholinergic RNAs Link to Inflammation

Chanan Meydan et al. Front Immunol. .

Abstract

The COVID-19 pandemic exerts inflammation-related parasympathetic complications and post-infection manifestations with major inter-individual variability. To seek the corresponding transcriptomic origins for the impact of COVID-19 infection and its aftermath consequences, we sought the relevance of long and short non-coding RNAs (ncRNAs) for susceptibility to COVID-19 infection. We selected inflammation-prone men and women of diverse ages among the cohort of Genome Tissue expression (GTEx) by mining RNA-seq datasets from their lung, and blood tissues, followed by quantitative qRT-PCR, bioinformatics-based network analyses and thorough statistics compared to brain cell culture and infection tests with COVID-19 and H1N1 viruses. In lung tissues from 57 inflammation-prone, but not other GTEx donors, we discovered sharp declines of the lung pathology-associated ncRNA DANCR and the nuclear paraspeckles forming neuroprotective ncRNA NEAT1. Accompanying increases in the acetylcholine-regulating transcripts capable of controlling inflammation co-appeared in SARS-CoV-2 infected but not H1N1 influenza infected lung cells. The lung cells-characteristic DANCR and NEAT1 association with inflammation-controlling transcripts could not be observed in blood cells, weakened with age and presented sex-dependent links in GTEx lung RNA-seq dataset. Supporting active involvement in the inflammatory risks accompanying COVID-19, DANCR's decline associated with decrease of the COVID-19-related cellular transcript ACE2 and with sex-related increases in coding transcripts potentiating acetylcholine signaling. Furthermore, transcription factors (TFs) in lung, brain and cultured infected cells created networks with the candidate transcripts, indicating tissue-specific expression patterns. Supporting links of post-infection inflammatory and cognitive damages with cholinergic mal-functioning, man and woman-originated cultured cholinergic neurons presented differentiation-related increases of DANCR and NEAT1 targeting microRNAs. Briefly, changes in ncRNAs and TFs from inflammation-prone human lung tissues, SARS-CoV-2-infected lung cells and man and woman-derived differentiated cholinergic neurons reflected the inflammatory pathobiology related to COVID-19. By shifting ncRNA differences into comparative diagnostic and therapeutic profiles, our RNA-sequencing based Resource can identify ncRNA regulating candidates for COVID-19 and its associated immediate and predicted long-term inflammation and neurological complications, and sex-related therapeutics thereof. Our findings encourage diagnostics of involved tissue, and further investigation of NEAT1-inducing statins and anti-cholinergic medications in the COVID-19 context.

Keywords: COVID-19; central nervous system; cholinergic; long non-coding RNA; miRNA.


Figures

Graphical Abstract
Graphical Abstract
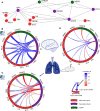
Study workflow - DANCR and NEAT1 interact with inflammatory markers in a sex- and tissue-specific manner (A) Segregating blood and lung samples from the GTEx dataset of healthy post-mortem donors into resilient and inflammation prone. Samples expressing high levels of seven of the inflammation biomarkers IL-1B, IL-6, NFKB1\2, REL, RELA\B were defined as inflammation-prone, and others as resilient. Differential expression analysis highlighted DANCR as a lncRNA DE between the two groups. Parallel analysis of cultured lung epithelial cells infected with SARS-CoV-2 found DANCR’s decline in infected cells. (B) Both GTEx post-mortem men and women lung and brain tissues and lung-derived cell culture infected with SARS-CoV-2 showed DANCR and NEAT1 changes in inflammatory biomarkers, part of which show modified levels under COVID-19 infection. Three different TF controllers of DANCR and NEAT1 can mediate the inflammatory tone in diverse organs (SPI1 (blue) in cortex, RUNX3 (yellow) in lung and TTF2 (green) in lung epithelial cells). DANCR and NEAT1 can block inflammation via interacting with other ncRNAs, sponging miRs, or affecting TFs like STAT3. Red, flat-headed and green arrows indicate expression blockade and induction of expression, respectively.
Figure 1
Figure 1
DANCR is downregulated in SARS-CoV-2 infected lung cells and in GTEx inflammation-prone lung samples. (A) The majority of the transcriptome (circle) consists of non-coding-RNA, including miRs, lncRNAs, and other RNAs. Changes in lncRNAs were assessed in viral-infected lung cell lines and inflammation-prone GTEx donors, and the expression levels of the down-regulated lncRNA DANCR was compared to those of inflammation-related coding transcripts. (B) Volcano plot showing coding transcripts (red and green) and lncRNAs (purple) from lung and blood samples of healthy post-mortem donors (n=419 and 407, respectively) with or without inflammatory reactions. Horizontal line represents p = 0.05 and vertical lines indicate -1/1 log2 of fold change. (C) 69% of the lncRNAs expressed in NHBE or A549 lung cells were downregulated [shown are only those with p value <0.05; of those, only DANCR had adjusted p < 0.05 (FDR)]. (D) DANCR is downregulated under viral infection both in bronchial epithelial cells and in lung adenocarcinoma cells [NHBE, p < 0.013; A549, p < 0.008; t. test (FDR)]. (E) DANCR expression change was significantly correlated (red, p < 0.05, FDR) with those of the cholinergic-associated AChE, multiple cytokines and NFkB subunits in both SARS-CoV-2 infected and control lung cell lines.
Figure 2
Figure 2
DANCR, NEAT1 and NFkB1 reactions differentiate between SARS-CoV-2 and pandemic H1N1 infection. (A) Normalized expression (CPM, z-score) of genes of interest in SARS-CoV-2\pandemic H1N1 [both 24 h post-infection (p. i.)] and control lung bronchial epithelial cells. (B) Boxplots show normalized expression of biological replicates (n = 3 for SARS-CoV-2 infected and control and for H1N1-infected and n=6 for H1N1 control). Red horizontal lines mark significantly different expression (p < 0.05 ANOVA, FDR). (C) Z-score fold changes of infected minus control SARS-CoV-2\H1N1. Black line shows y=x slope. NFkB1, DANCR, and NEAT1 show significant changes (p < 0.01), all other genes are found within the 0.99 SD of the slope.
Figure 3
Figure 3
DANCR shows inter-related age- and sex-associated correlation with elevated lung inflammatory genes and associates with ACE2. (A) Expression of DANCR and other genes in 419 lung samples was followed post-mortem in healthy GTex individuals. Correlation between coding genes to DANCR expression was tested in lungs and age correlation—in lung and blood. (B) Significant (red, p < 0.05, FDR) and insignificant (black) correlation of DANCR to cholinergic- and inflammation-related genes in lung samples. (C) Heat-map showing age-related decline in DANCR’s correlation with the red-colored genes in B. The samples were sorted by the number of genes whose links were significant in the different age groups. Color scale shows calculated relative share of each subgroup of the total population at this age. A trend (R = 0.7, p < 0.1) was seen for the correlation of age with the fraction of donors whose values appeared significant. (D) Expression of DANCR in lung samples along age (R = -1.3, p < 0.008). Boxplots in grey show expression variability in each age group. (E) Correlated expression of ACE2 and DANCR in 419 lung samples from the GTEx dataset (R = 0.25, p < 0.0001, Pearson). (F) Correlation of various transcript levels with age in 427 lung samples. Red asterisks indicate significance of p < 0.05 (FDR). (G) Neuroblastoma cells of female (LA-N-2) and male (LA-N-5) origin were treated with CNTF to induce cholinergic differentiation, or PBS-treated for control cells. Four days post-treatment, the levels of lung transcripts were qPCR measured and normalized to GAPDH levels (n=3 biological replicates for each qPCR condition). ChAT and VAChT were upregulated in differentiated cholinergic neurons (p < 0.01, p < 0.05), the neuroprotective long variant of NEAT1 (p < 0.09) and two common transcripts of DANCR, DANCR-204 (709 bp) and DANCR-205 (748 bp) (p < 0.43, p < 0.063, respectively).
Figure 4
Figure 4
Distinct transcription factors affect the infection-related brain and lung impact of DANCR, NEAT1 and inflammatory transcripts. (A) Network presenting links of DANCR and NEAT1 (green) and inflammatory genes (red) with the transcription factors (TFs; purple) controlling their expression. (B) correlation between the expression levels of the various TFs to inflammatory (red) or lncRNA (green) transcripts in cortex samples from 158 post-mortem GTEx donors. The width of the bars on the surrounding circle represent log10 of the transcript’s CPM, the width of the tracks connecting the genes represents -log10 of the FDR corrected p value of the correlation between the two connected genes, and the color intensity of the track represents the correlation R (blue—positive and red—negative correlation). (C) As in B but for 427 lung samples. (D) As in B but for Calu-3 lung epithelial cell (from GSE148729; n=18).
Figure 5
Figure 5
DANCR and NEAT1 expression networks are linked to genes discriminating between mild and severe SARS-CoV-2 insults. (A) 8 out of 19 genes found by Bost et al. (2020) to change between mild and sever SARS-CoV-2 infected patients show significantly correlated changes (p<0.05) to changes of DANCR (Pearson, FDR) in lung samples of 427 post-mortem GTEx donors. Gray region around the line represents SD for the linear fit. Line color represents significance [-log10(adjusted p value)] (86). (B) Same as A. for NEAT1. (C) A network of miRs (blue) that harbor binding sites on either DANCR or NEAT1 (green) and may target one or more of the 12 inflammation-related genes [(86) (red)].
Figure 6
Figure 6
DANCR and NEAT1 interlink with inflammatory transcripts and DE miRs both in SARS-CoV-2 infection and in differentiated cholinergic neurons. (A) Long RNA-sequencing was conducted on Calu-3 epithelial lung cells infected or not with SARS-CoV-2 and harvested 4, 12, and 24 h post infection. Short RNA-sequencing was performed on 4- and 24-h samples. Additionally, neuron progenitor cells (SUNE-1) were treated with siDNACR (to execute DANCR knockdown) or with si-Scramble (siSCR) for control and were sequenced for long RNAs. (B) 32 miRs were DE in infected Calu-3 cells (left column) and were ordered from largest positive to negative fold change (FC; top; bottom). Thirteen and 17 of these miRs were DE under cholinergic differentiation in female and male neuroblastoma cells (LA-N-2; middle column and LA-N-5; right column). Color coding represents log2 of FC with red standing for negative FC of infected/uninfected or differentiated/non-differentiated and blue—for positive. n=4 for each condition. (C) Boxplot representation for two miRs from B. Red stands for all control conditions (untreated \ uninfected); blue—for cholinergic differentiation (CNTF) and green – for SARS-CoV-2 infection. Expression is normalized to the mean of control in each group (female, male and SARS-CoV-2-infection). (D) A network showing miRs (blue) targeting either DANCR or NEAT1 (green) and at least one inflammatory transcript (red). Squares representing miRs that were DE under SARS-CoV-2 infection are shown with yellow margins. (E) Boxplots showing Calu-3 infected (green) and control (blue) cells in three different timepoints. Upper-left corner shows significance for corrected (FDR) ANOVA test results (# = p<0.065; * = p<0.05; ** = p<0.01; *** = p<0.001) where t stands for “time” (i.e. 4, 12, or 24 h), i—for “infection” (infected or uninfected) and “t.i” for the combination of time and infection. If not stated—insignificant. n=3 for each condition. (F) SUNE-1 neuron progenitor cells treated with siDANCR (orange) or siSCR (purple). Red horizontal lines indicate p<0.05 (t. test, FDR). n=3 for each condition.

Similar articles

Cited by

References

    1. Havers FP, Reed C, Lim T, Montgomery JM, Klena JD, Hall AJ, et al. Seroprevalence of Antibodies to SARS-CoV-2 in 10 Sites in the United States, March 23-May 12, 2020. JAMA Intern Med (2020). 10.1001/jamainternmed.2020.4130 - DOI - PubMed
    1. Driggin E, Madhavan MV, Bikdeli B, Chuich T, Laracy J, Bondi-Zoccai G, et al. Cardiovascular Considerations for Patients, Health Care Workers, and Health Systems During the Coronavirus Disease 2019 (COVID-19) Pandemic. J Am Coll Cardiol (2020). 10.1016/j.jacc.2020.03.031 - DOI - PMC - PubMed
    1. McGonagle D, Sharif K, O'Regan A, Bridgewood C. The Role of Cytokines including Interleukin-6 in COVID-19 induced Pneumonia and Macrophage Activation Syndrome-Like Disease. Autoimmun Rev (2020) 102537. 10.1016/j.autrev.2020.102537 - DOI - PMC - PubMed
    1. Wu C, Chen X, Cai Y, Xia J, Zhou X, Xu S, et al. Risk Factors Associated With Acute Respiratory Distress Syndrome and Death in Patients With Coronavirus Disease 2019 Pneumonia in Wuhan, China. JAMA Intern Med (2020). 10.1001/jamainternmed.2020.0994 - DOI - PMC - PubMed
    1. Group RC, Horby P, Lim WS, Emberson JR, Mafham M, Bell JL, et al. Dexamethasone in Hospitalized Patients with Covid-19 - Preliminary Report. N Engl J Med (2020). 10.1056/NEJMoa2021436 - DOI - PubMed

Publication types

MeSH terms