. 2020 Aug 6;7(2):305-312.
doi: 10.1093/jhps/hnaa026. eCollection 2020 Jul.

Assessment of three-dimensional acetabular coverage angles

Affiliations

Assessment of three-dimensional acetabular coverage angles

Vidyadhar V Upasani et al. J Hip Preserv Surg. .

Abstract

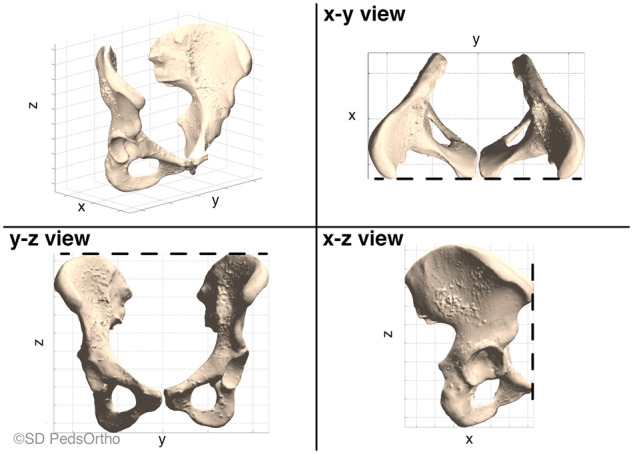
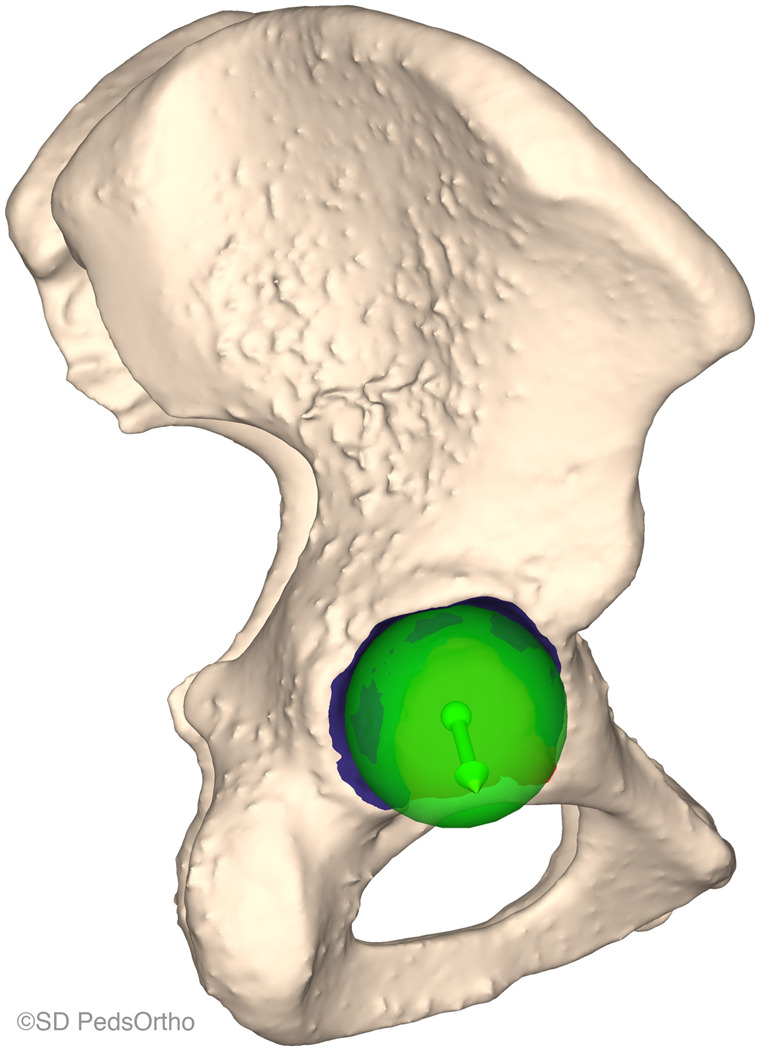
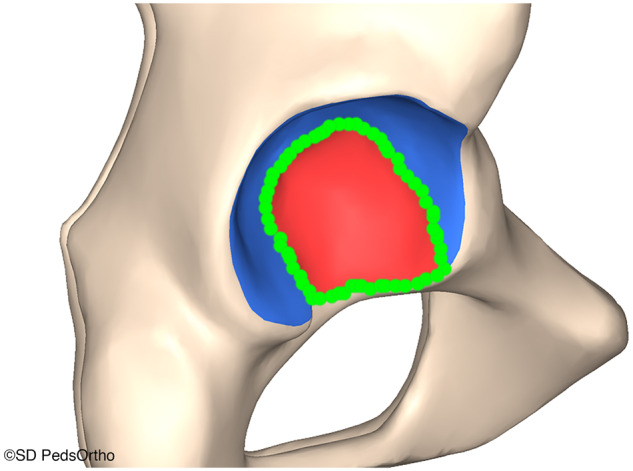
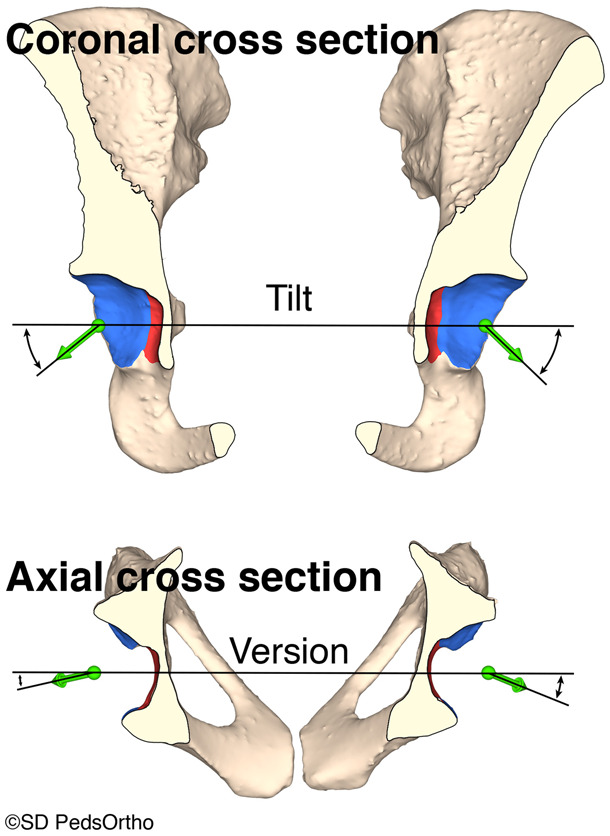
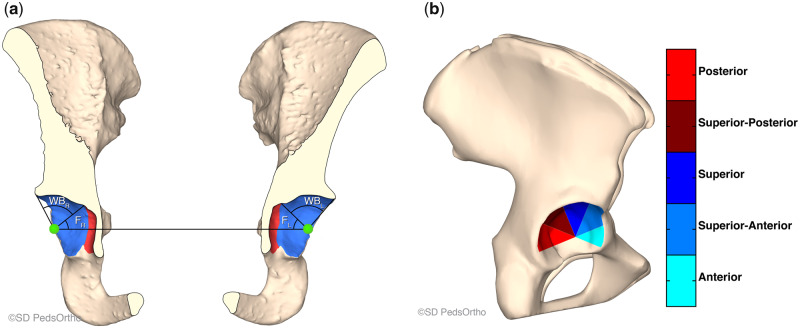
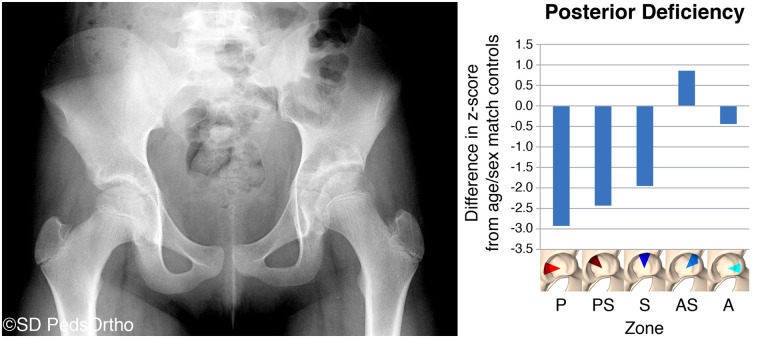
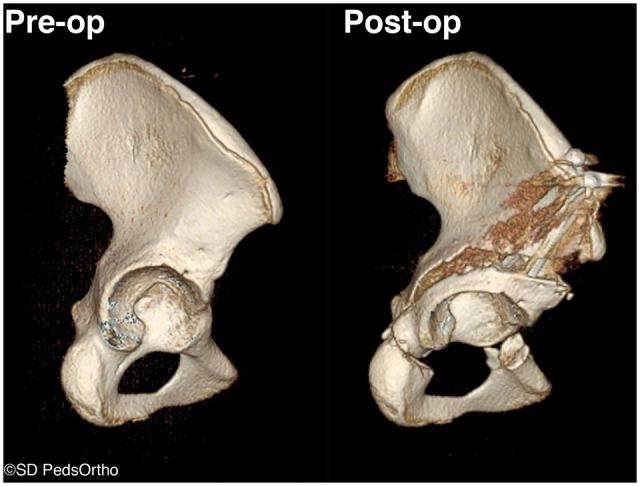
The purpose of this article is to report the inter- and intra-observer reliability of a computerized objective technique to quantify patient-specific acetabular morphology. We describe the use of and provide the software code for a technique to better define the location and magnitude of acetabular pathology. We have developed software code that allows the end user to obtain detailed measurements of the acetabulum using traditional computed tomography data. We provide the code and detailed instructions on how to use it in this article. The methodology was validated by having an unbiased observer (that was not involved in this project but has been trained in this software measurement methodology) to perform the entire acquisition, reconstruction and analysis procedure and compare their measurements to the measurements of one of the authors. The author then repeated the procedure 2 months later to determine intra-observer reliability. Inter- and intra-observer reliability for version, tilt, surface area and total acetabular coverage angles ranged from an intra-class correlation coefficient of 0.805 to 0.997. The method provided in this manuscript gives a reproducible objective assessment of three-dimensional (3D) acetabular morphology that can be used to assist in the diagnosis of hip pathology and to compare the morphological parameters of subjects with and without hip pathology. It allows a surgeon to understand the 3D shape of each individual's acetabulum, share these findings with patients and their parents to demonstrate the magnitude and location of the clinical abnormality and perform patient-specific surgical corrections to optimize the shape and coverage of the hip.


Figures

Fig. 1.
Fig. 1.
Pre-defined alignment of the pelvis in three planes based on landmark locations. Upper-right: on the xy view, the anterior superior iliac spines (ASIS) were aligned. Lower-left: on the yz view, the two iliac crests were aligned at the most superior point. Lower-right: on the xz view, the ASIS and the pubic tubercle were aligned.
Fig. 2.
Fig. 2.
Best-fit sphere calculated using least-square regression superimposed on the acetabulum. The center of the sphere is shown by a green dot and the acetabulum direction vector by an arrow.
Fig. 3.
Fig. 3.
Drawing the cotyloid fossa/articular surface boundaries manually. Green circles indicate a user’s hand drawn tracing.
Fig. 4.
Fig. 4.
Coronal and axial cross sections of a pelvic model illustrating the technique of measuring tilt, in the coronal plane, and version, in the axial plane.
Fig. 5.
Fig. 5.
(A) Coronal cross section of the 3D model illustrating coverage angle calculation. The total coverage angle is the angle between the line connecting the center of the best-fit spheres for each pelvis (identified by the two green dots) and the edge of the acetabulum. The coverage angle for the fossa is the line connecting the center of the best-fit spheres and the edge of the fossa (identified as the red area). The weight-bearing coverage area is the difference between the two (WBR/L = weight-bearing right/left and FR/L = Fossa right/left). (B) Diagram of the five clinically pertinent coverage angle octants of the acetabulum. The coverage angle reported for the octant section is the average of the coverage angles within the specified 45° (or octant) of the acetabulum edge.
Fig. 6.
Fig. 6.
(A) AP radiograph of an 11-year-old female with left acetabular dysplasia. (B) A graphical representation of this child’s z-scores for each section of the acetabulum. If the child’s acetabulum was exactly the same as the mean, the z-scores for each section would be zero. Values over 2 would represent over-coverage of that section; values below −2 indicate under-coverage of that section. This graph indicates that this child has a posteriorly deficient acetabulum.
Fig. 7.
Fig. 7.
Pre- and post-operative 3DCT reconstructions from the direct lateral view. Pre-operatively, the superior and posterior surfaces of the acetabulum are clearly seen. After corrective osteotomy, you can no longer see the superior surface of the acetabulum and the posterior surface that is visible is similar to the visible surface of the anterior portion of the acetabulum.

References

    1. Khanna V, Beaulé PE. Defining structural abnormalities of the hip joint at risk of degeneration. J Hip Preserv Surg 2014; 1: 12–20. - PMC - PubMed
    1. Parvaresh KC, Pennock AT, Bomar JD et al. Analysis of acetabular ossification from the triradiate cartilage and secondary centers. J Pediatr Orthop 2018; 38: e145–50. - PubMed
    1. Albers CE, Rogers P, Wambeek N et al. Preoperative planning for redirective, periacetabular osteotomies. J Hip Preserv Surg 2017; 4: 276–88. - PMC - PubMed
    1. Chadayammuri V, Garabekyan T, Jesse M-K et al. Measurement of lateral acetabular coverage: a comparison between CT and plain radiography. J Hip Preserv Surg 2015; 2: 392–400. - PMC - PubMed
    1. Tönnis D. Congenital Dysplasia and Dislocation of the Hip in Children and Adults. Berlin, Heidelberg: Springer-Verlag, 1987.