. 2020 Oct 1;10(10):3212-3229.
eCollection 2020.

Isocitrate dehydrogenase 3A, a rate-limiting enzyme of the TCA cycle, promotes hepatocellular carcinoma migration and invasion through regulation of MTA1, a core component of the NuRD complex

Affiliations

Isocitrate dehydrogenase 3A, a rate-limiting enzyme of the TCA cycle, promotes hepatocellular carcinoma migration and invasion through regulation of MTA1, a core component of the NuRD complex

Xujun Liu et al. Am J Cancer Res. .

Abstract

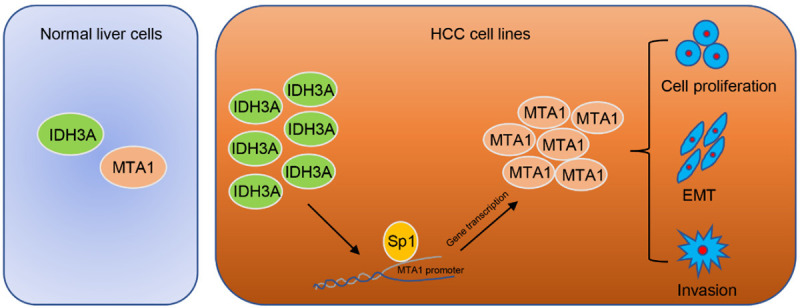
The precise molecular mechanism of hepatocellular carcinoma (HCC) remains ambiguous. Isocitrate dehydrogenase 3A (IDH3A) is known as a subunit of the IDH3 heterotetramer. To the best of our knowledge, the biological effect of IDH3A in malignant tumors is unclear. Here, we report that IDH3A is significantly upregulated in HCC tissues; moreover, high expression of IDH3A is strongly associated with tumor size and the clinicopathologic stage of HCC. RNA-seq revealed that depletion of IDH3A affects the expression of metastasis associated 1 (MTA1), an oncogene which is related to the progression of numerous cancer types to the metastasis stage. Cell transfection was used to upregulate and downregulate the expression of IDH3A in HCC cells. The migration activity of HCC cells was assessed using wound healing assays. While transwell assays were carried out to detect the invasion of HCC cells. RNA-seq, RT-qPCR and western blot were used to validate MTA1 as a potential target gene. The present study suggested that IDH3A can upregulate MTA1 expression and promote epithelial-mesenchymal transition (EMT) in HCC by inducing MTA1 expression, thereby facilitating cell migration and invasion of HCC cells. Here, we demonstrated the importance of IDH3A in HCC progression. The identification of the IDH3A axis provides novel insight into the pathogenesis of HCC, and the IDH3A axis might represent a novel target for the treatment of HCC.

Keywords: EMT; IDH3A; MTA1; invasion; migration.


Conflict of interest statement

None.

Figures

Figure 1
Figure 1
IDH3A is upregulated in hepatocellular carcinoma (HCC), and high expression of IDH3A protein is strongly associated with tumor size and advanced stage in HCC. A. The mRNA level of IDH3A in a variety of cancers by online analysis (www.cbioportal.org/public-portal/). B. The expression of IDH3A in HCC by GTEx database (http://gepia.cancer-pku.cn/index.html). C. Representative sections of normal liver tissues and primary and metastatic HCC tissues that were stained with IDH3A antibody are presented. Scale bar=100 μm. The scores were assessed by evaluating the intensity and extent of immunopositivity. Two-tailed unpaired Student’s t test was utilized to analyze the results (*P < 0.05). D. Representative images of samples of clinicopathologic stage I, II and III HCC that were stained with IDH3A antibody are shown. The scores were assessed by evaluating the intensity and extent of immunopositivity. A two-tailed unpaired Student’s t test was utilized to analyze the results (*P < 0.05). E. The survival rate of HCC patients with high or low IDH3A expression was analyzed by the Kaplan-Meier analysis (*P < 0.05). F. The expression of IDH3A in HCC cell lines and human hepatocytes was determined using western blotting and RT-qPCR analyses (*P < 0.05).
Figure 2
Figure 2
IDH3A promotes EMT and cell migration as well as invasion in HCC. A and B. IDH3A was overexpressed or knocked down in HepG2 cells. The expression of IDH3A and EMT markers were determined by RT-qPCR and western blotting analyses (*P < 0.05). C. IDH3A was overexpressed or knocked down in MHCC-97H cells. The expression of MTA1 was determined by RT-qPCR and western blotting analyses (*P < 0.05). D. MHCC-97H cells were transfected with IDH3A siRNA and/or IDH3A for the wound healing assay (*P < 0.05). E. MHCC-97H cells were transfected with IDH3A siRNA and/or IDH3A for the transwell invasion assay (*P < 0.05).
Figure 3
Figure 3
IDH3A regulates MTA1 expression in HCC. A. Heatmap of 3933 differentially expressed genes in HepG2 cells expressing IDH3A siRNA to siRNA control from three independent biological replicates. B. Bioinformatics analysis of the different gene expression events that were identified in IDH3A-depleted HepG2 cells using the DAVID Functional Annotation Tool (DAVID, https://david.ncifcrf.gov/). C. IDH3A was knocked down in HepG2 cells, RT-qPCR was performed to detect the roles of IDH3A (*P < 0.05). D. HepG2 cells were transfected with IDH3A siRNA and/or IDH3A. The expression of MTA1 was determined by RT-qPCR and western blotting analyses (*P < 0.05).
Figure 4
Figure 4
The expression of MTA1 is increased in HCC and associated with IDH3A expression. A. Representative sections of adjacent normal tissues and HCC tissue that were stained with MTA1 antibody are presented. Scale bar=100 μm. The scores were assessed via evaluating the intensity and extent of immunopositivity. A two-tailed unpaired Student’s t test was utilized to analyze the results (*P < 0.05). B. Representative images of samples of clinicopathologic stage I, II and III HCC that were stained with MTA1 antibody, the scores were assessed via evaluating the intensity and extent of immunopositivity. A two-tailed unpaired Student’s t test was utilized to analyze the results (*P < 0.05). C. The survival rate of HCC patients with high or low MTA1 expression was analyzed by the Kaplan-Meier analysis (*P < 0.05). D. The correlation between IDH3A expression and MTA1 expression was analyzed by Pearson analysis.
Figure 5
Figure 5
IDH3A Regulates MTA1 Expression through Sp1. A. TF motifs identified from ATAC-seq peaks. Top known and de novo motif enrichments. B. Sp1 recognized consensus site was identified in the promoter region of MTA1 using a bioinformatics website (http://alggen.lsi.upc.es/cgi-bin/promo_v3/promo/promoinit.cgi?dirDB=TF_8.3). The number represents the nucleotide position relative to the transcription start site (+1). C. HepG2 cells were co-transfected with MTA1-Luc and expression construct for vector or Sp-1 and Renilla. 48 h after the transfection, luciferase activity was measured. Relative luciferase activity was calculated as firefly luciferase activity divided by Renilla luciferase activity and shown relative to the control. D. HepG2 cells were transfected with the vector, IDH3A, or treated with siControl, siIDH3A. qChIP analysis of MTA1 promoters was performed using antibodies against Sp1. Results are represented as fold change over control IgG. E. HepG2 cells were transfected with vector, Sp1, or treated with control siRNA or Sp1 siRNAs. Total RNAs and proteins were extracted and analyzed for the expression of MTA1 by RT-qPCR and Western blotting, respectively.
Figure 6
Figure 6
IDH3A promotes cell migration and invasion through regulating MTA1 expression in HCC. A. HepG2 cells were transfected with MTA1, IDH3A and/or MTA1 siRNA, MTA1 siRNA, IDH3A siRNA and/or MTA1. The expression of MTA1 and EMT markers were determined by RT-qPCR and western blotting analyses (*P < 0.05). B. MHCC-97H cells were transfected with MTA1, IDH3A and/or MTA1 siRNA, MTA1 siRNA, IDH3A siRNA and/or MTA1. The expression of MTA1 was determined by RT-qPCR and western blotting analyses (*P < 0.05). C. MHCC-97H cells were transfected with MTA1, IDH3A and/or MTA1 siRNA, MTA1 siRNA, IDH3A siRNA and/or MTA1 for wound-healing assay (*P < 0.05). D. MHCC-97H cells were transfected with MTA1, IDH3A and/or MTA1 siRNA, siMTA1, IDH3A siRNA and/or MTA1 for transwell invasion assay (*P < 0.05). E. MHCC-97H cells that were infected with lentiviruses carrying control shRNA, IDH3A shRNA and/or infected with retroviruses carrying MTA1 were injected intravenously through the tail vein of SCID mice (n=6). Lung metastasis was quantified by bioluminescence imaging.
Figure 7
Figure 7
Proposed model for the role of IDH3A in HCC cells. The mechanism of IDH3A-mediated HCC cancer cell migration and invasion as well as EMT is mediated by the regulation of MTA1.

References

    1. Siegel RL, Miller KD, Jemal A. Cancer statistics, 2018. CA Cancer J Clin. 2018;68:7–30. - PubMed
    1. Allemani C, Matsuda T, Di Carlo V, Harewood R, Matz M, Niksic M, Bonaventure A, Valkov M, Johnson CJ, Esteve J, Ogunbiyi OJ, Azevedo ESG, Chen WQ, Eser S, Engholm G, Stiller CA, Monnereau A, Woods RR, Visser O, Lim GH, Aitken J, Weir HK, Coleman MP CONCORD Working Group. Global surveillance of trends in cancer survival 2000-14 (CONCORD-3): analysis of individual records for 37 513 025 patients diagnosed with one of 18 cancers from 322 population-based registries in 71 countries. Lancet. 2018;391:1023–1075. - PMC - PubMed
    1. Cornella H, Alsinet C, Villanueva A. Molecular pathogenesis of hepatocellular carcinoma. Alcohol Clin Exp Res. 2011;35:821–825. - PubMed
    1. Llovet JM, Zucman-Rossi J, Pikarsky E, Sangro B, Schwartz M, Sherman M, Gores G. Hepatocellular carcinoma. Nat Rev Dis Primers. 2016;2:16018. - PubMed
    1. Llovet JM, Di Bisceglie AM, Bruix J, Kramer BS, Lencioni R, Zhu AX, Sherman M, Schwartz M, Lotze M, Talwalkar J, Gores GJ Panel of Experts in HCC-Design Clinical Trials. Design and endpoints of clinical trials in hepatocellular carcinoma. J Natl Cancer Inst. 2008;100:698–711. - PubMed

LinkOut - more resources