Review
. 2020 Oct 9:8:585363.
doi: 10.3389/fbioe.2020.585363. eCollection 2020.

Nonlinear Optical Microscopy: From Fundamentals to Applications in Live Bioimaging

Affiliations
Review

Nonlinear Optical Microscopy: From Fundamentals to Applications in Live Bioimaging

Valentina Parodi et al. Front Bioeng Biotechnol. .

Abstract

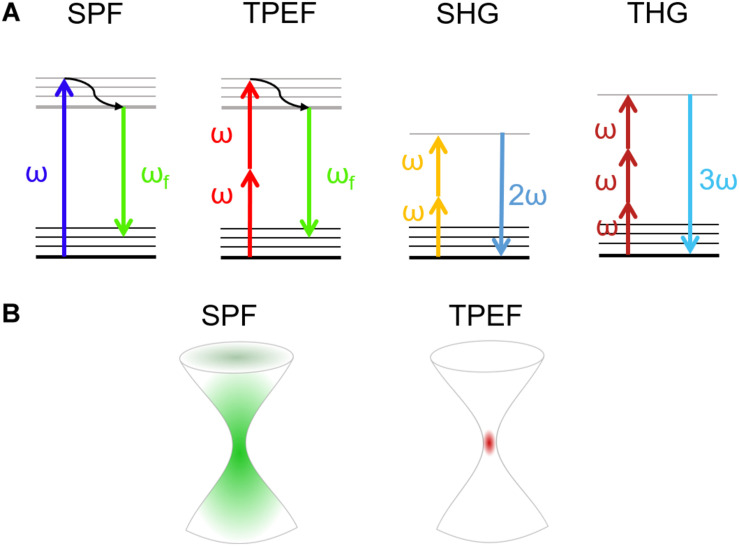
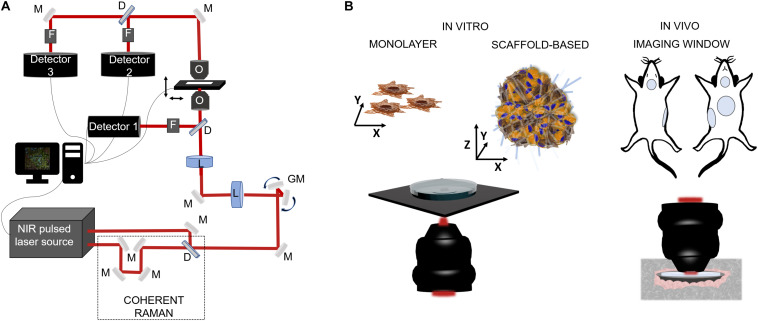
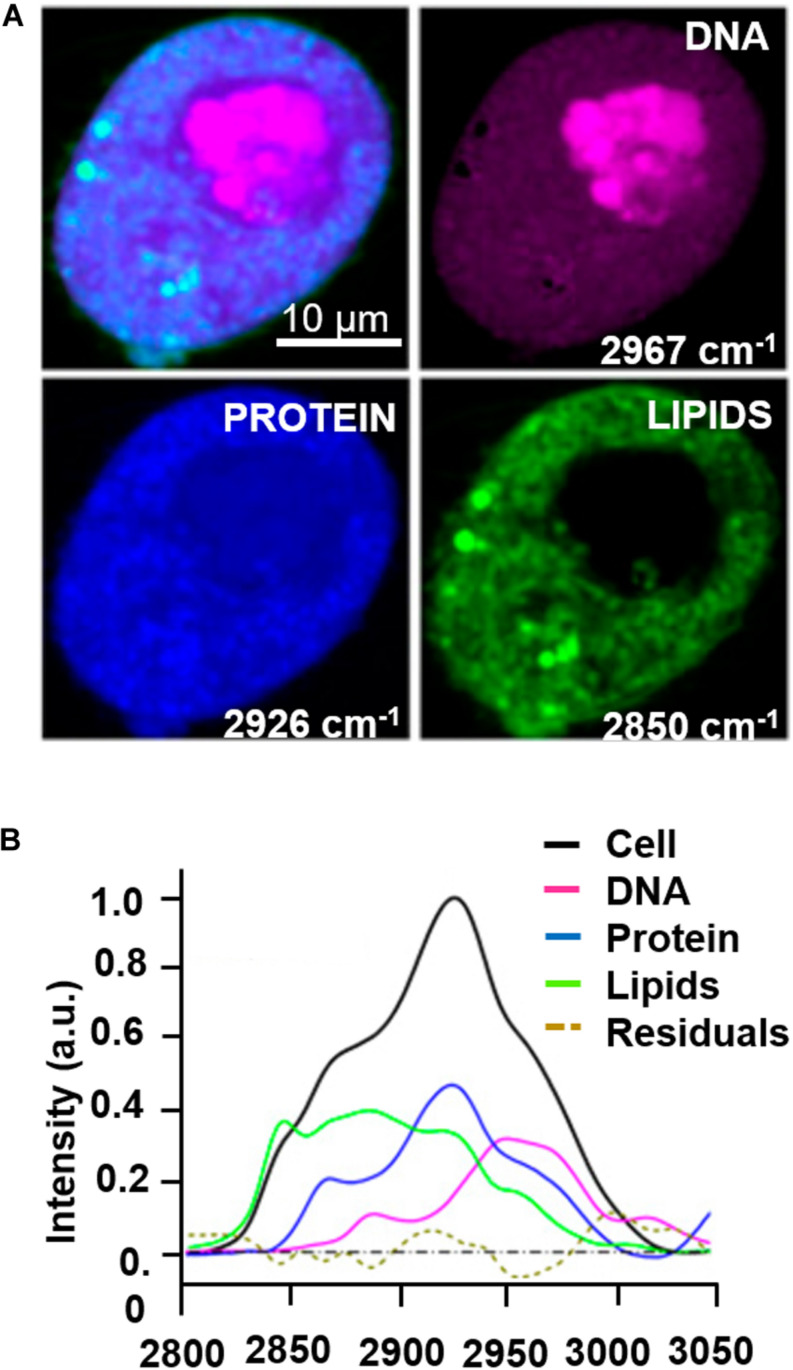
A recent challenge in the field of bioimaging is to image vital, thick, and complex tissues in real time and in non-invasive mode. Among the different tools available for diagnostics, nonlinear optical (NLO) multi-photon microscopy allows label-free non-destructive investigation of physio-pathological processes in live samples at sub-cellular spatial resolution, enabling to study the mechanisms underlying several cellular functions. In this review, we discuss the fundamentals of NLO microscopy and the techniques suitable for biological applications, such as two-photon excited fluorescence (TPEF), second and third harmonic generation (SHG-THG), and coherent Raman scattering (CRS). In addition, we present a few of the most recent examples of NLO imaging employed as a label-free diagnostic instrument to functionally monitor in vitro and in vivo vital biological specimens in their unperturbed state, highlighting the technological advantages of multi-modal, multi-photon NLO microscopy and the outstanding challenges in biomedical engineering applications.

Keywords: label-free microscopy; live imaging; nonlinear microscopy; stem cells; tissue engineering.


Figures

FIGURE 1
FIGURE 1
(A) Jablonski diagrams involving (from left to right) single-photon (SPF) and two-photon excited (TPEF) fluorescence, and second harmonic (SHG) and third harmonic (THG) generation. (B) Size of the excited volume in single-photon (left) and multi-photon (right) fluorescence.
FIGURE 2
FIGURE 2
(A,B) Jablonski diagrams of CARS and SRS energy transitions. (C) Schematic representation of the excitation and emission frequencies involved in SRS and CARS: in evidence the SRS signal in terms of gain (SRG) on the Stokes pulse or the loss (SRL) on the pump pulse.
FIGURE 3
FIGURE 3
Schematic representations of NLO microscopy application in biology. (A) Example of a NLO set-up characterized by a NIR laser source (two in the case of coherent Raman), a set of fixed (M) and mobile (galvanometric mirrors-GM) mirrors and lenses (L) to drive the light toward the focalization objective (O) and then to the sample which is positioned on a motorized stage. The collection of the emitted light can be in reflection by the use of a dichroic mirror (D), a set of filters (F) (to exclude the excitation component from the reflected light) and, a photodetector, or by transmission thanks to a collection objective or a condenser positioned above the sample. (B) On the left side, cell model for in vitro inspections: single cell analysis on cellular monolayer or 3D cellular constructs composed by heterogenous cell population and a scaffold matrix. The microscope configuration can be in reflection modality, to maintain sample sterility, or in transmission, exposing sample to immersion objective and contaminants. On the right side, intravital microscopy for preclinical analysis is usually made by the use of imaging windows for repetitive observations on the same site for small rodent models. In vivo imaging is made in reflection modality using of cover-glasses sealed on the skin of the animal in specific locations, i.e., mammary glands, cranial, abdominal, and tracheal sites.
FIGURE 4
FIGURE 4
Example of multi-color SRS microscopy on living tumor cells during prophase: (A) DNA (magenta) at 2967 cm–1, proteins (blue) at 2926 cm–1 and lipids (green) at 2850 cm–1. (B) Raman spectrum extracted from the cell pellet showing the signatures of the different species. Scale bar = 10 μm. Figures adapted from (Lu et al., 2015) for kind permission of PNAS.
FIGURE 5
FIGURE 5
Intravital imaging of mouse tumor microenvironment showing SHG (green), THG (magenta), TPEF (yellow), and three photon fluorescence (cyan) signals. In evidence the green signal from collagen fibers, cyan from NADH, yellow from FAD and magenta from interfaces. Scale bar = 100 μm. Figure reproduced from You et al. (2018) with kind permission from Springer-Nature Communications and licensed by s100.copyright. com\AppDispatchServlet.
FIGURE 6
FIGURE 6
(A) Schematic representation of the experimental model employed in this work: on the left, SEM image of a single element of Nichoid 3D synthetic scaffold (Scale bar = 20 μm) used for MSCs culture. Nichoids design was made of three lattice parallel grids with graded pore size and an overall thickness of 30 μm to enable optical accessibility. On the right a rendering of the transmission inverted NLO microscope for multi-modal TPEF, SHG, CARS, and SRS microscopy. (B) Adipogenic differentiation of MSCs after 2 weeks of culture. On the left, oil red-O colorimetric assay of fixed cells, showed lipid droplets formation in red, while in the center, CARS image, of the same sample acquired before fixation and oil red-O staining, showing lipid droplets, resonant at 2845 cm–1 and indicated by white arrows. On the right a 3D rendering of CARS signal acquired by sequential imaging at variable depth inside the sample and stacking the images. (C) Chondrogenic MSCs differentiation after 3 weeks of culture. On the left, toluidine blue assays performed on fixed specimen, revealed production of acidic component of ECM stained in blue. In the center, CARS imaging at 2940 cm–1 Raman shift, resonant with collagen (highlighted by arrows), in untreated, live, and differentiated sample. On the right side, SHG image acquired on vital stem cells after 21 days of differentiation, white arrows indicate collagen fibrils. Autofluorescence signal from the Nichoids material is present and more evident in SHG modality.

References

    1. Alonzo C. A., Karaliota S., Pouli D., Liu Z., Karalis K. P., Georgakoudi I. (2016). Two-photon excited fluorescence of intrinsic fluorophores enables label-free assessment of adipose tissue function. Sci. Rep. 6:31012. 10.1038/srep31012 - DOI - PMC - PubMed
    1. Barad Y., Eisenberg H., Horowitz M., Silberberg Y. (1997). Nonlinear scanning laser microscopy by third harmonic generation. Appl. Phys. Lett. 70 922–924. 10.1063/1.118442 - DOI
    1. Bloembergen N. (1982). Nonlinear optics and spectroscopy. Rev. Mod. Phys. 54 685–695.
    1. Bradley J., Pope I., Masia F., Sanusi R., Langbein W., Swann K., et al. (2016). Quantitative imaging of lipids in live mouse oocytes and early embryos using CARS microscopy. Development 143 2238–2247. 10.1242/dev.129908 - DOI - PMC - PubMed
    1. Campagnola P. (2012). Second harmonic generation imaging microscopy: applications to diseases diagnostics. Anal. Chem. 83 3224–3231. 10.1021/ac1032325.Second - DOI - PMC - PubMed

LinkOut - more resources