

Assessment of Plasma Oxalate Concentration in Patients With CKD
- PMID: 33163722
- PMCID: PMC7609998
- DOI: 10.1016/j.ekir.2020.08.029
Assessment of Plasma Oxalate Concentration in Patients With CKD
Abstract
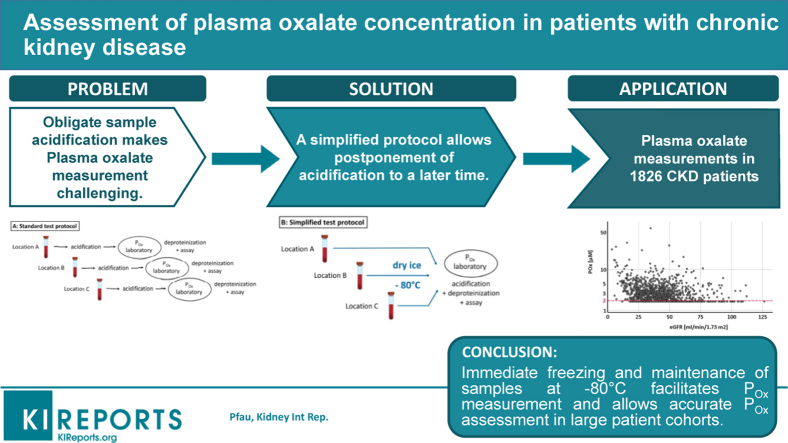
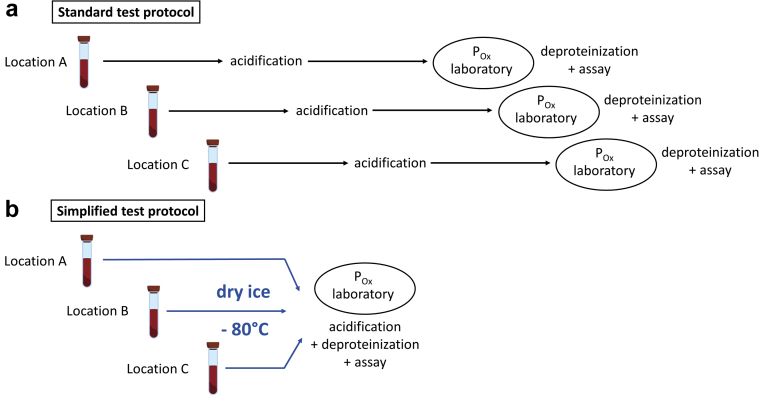
Introduction: Alterations in oxalate homeostasis are associated with kidney stone disease and progression of chronic kidney disease (CKD). However, accurate measurement of plasma oxalate (POx) concentrations in large patient cohorts is challenging as prompt acidification of samples has been deemed necessary. In the present study, we investigated the effects of variations in sample handling on POx results and examined an alternative strategy to the established preanalytical procedures.
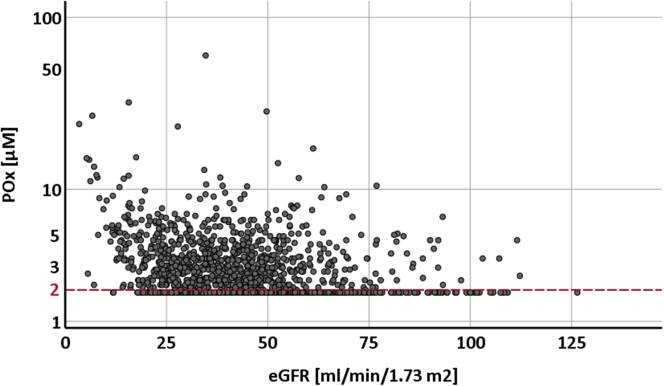
Methods: The effect of storage time at room temperature (RT) and maintenance of samples at -80°C was tested. POx was measured in 1826 patients enrolled in the German Chronic Kidney Disease (GCKD) study, an ongoing multicenter, prospective, observational cohort study.
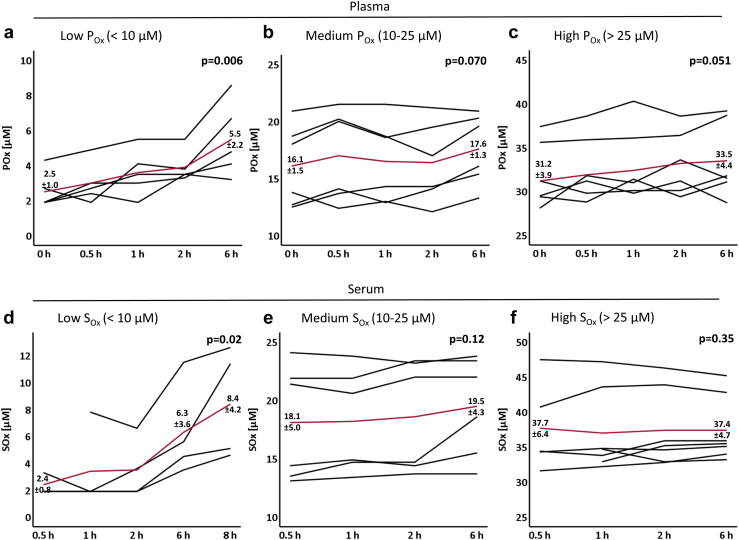
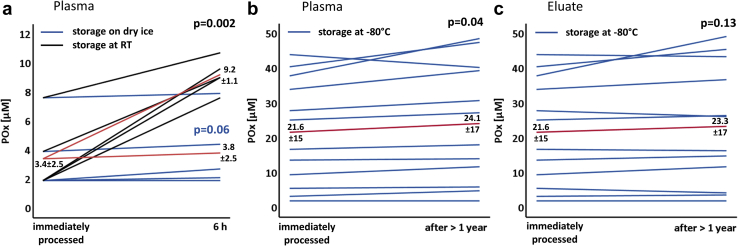
Results: We demonstrate that POx concentrations increased rapidly when samples were maintained at RT. This was most relevant for POx <10 μM, as concentrations more than doubled within a few hours. Immediate freezing on dry ice and storage at -80°C provided stable results and allowed postponement of acidification for >1 year. In the patients of the lowest estimated glomerular filtration rate (eGFR) quartile, median POx was 2.7 μM (interquartile range [IQR] <2.0-4.2) with a median eGFR of 25.1 ml/min per 1.73 m2 (IQR 20.3-28.1).
Conclusion: We conclude that immediate freezing and maintenance of plasma samples at -80°C facilitates the sample collection process and allows accurate POx assessment in large cohorts. The present study may serve as a reference for sample handling to assess POx in clinical trials and to determine its role in CKD progression.
Keywords: POx concentration; POx measurement; chronic kidney disease; clinical trials; preanalytical conditions.
© 2020 International Society of Nephrology. Published by Elsevier Inc.
Figures
Similar articles
-
Circulating Oxalate Levels in Short Bowel Syndrome as a Severity Marker of CKD.Kidney Int Rep. 2023 Dec 28;9(3):686-693. doi: 10.1016/j.ekir.2023.12.023. eCollection 2024 Mar. Kidney Int Rep. 2023. PMID: 38481504 Free PMC article.
-
Plasma oxalate and eGFR are correlated in primary hyperoxaluria patients with maintained kidney function-data from three placebo-controlled studies.Pediatr Nephrol. 2021 Jul;36(7):1785-1793. doi: 10.1007/s00467-020-04894-9. Epub 2021 Jan 30. Pediatr Nephrol. 2021. PMID: 33515281 Free PMC article. Clinical Trial.
-
Plasma oxalate in relation to eGFR in patients with primary hyperoxaluria, enteric hyperoxaluria and urinary stone disease.Clin Biochem. 2017 Dec;50(18):1014-1019. doi: 10.1016/j.clinbiochem.2017.07.017. Epub 2017 Jul 29. Clin Biochem. 2017. PMID: 28764885 Free PMC article.
-
Plasma oxalate levels in primary hyperoxaluria type I show significant intra-individual variation and do not correlate with kidney function.Pediatr Nephrol. 2020 Jul;35(7):1227-1233. doi: 10.1007/s00467-020-04531-5. Epub 2020 Apr 9. Pediatr Nephrol. 2020. PMID: 32274573
-
Association of Urinary Oxalate Excretion With the Risk of Chronic Kidney Disease Progression.JAMA Intern Med. 2019 Apr 1;179(4):542-551. doi: 10.1001/jamainternmed.2018.7980. JAMA Intern Med. 2019. PMID: 30830167 Free PMC article.
Cited by
-
SLC26A1 is a major determinant of sulfate homeostasis in humans.J Clin Invest. 2023 Feb 1;133(3):e161849. doi: 10.1172/JCI161849. J Clin Invest. 2023. PMID: 36719378 Free PMC article.
-
Author Reply to Comment on "Assessment of Plasma Oxalate Concentration in Patients With CKD" by Oka et al.Kidney Int Rep. 2021 Mar 5;6(4):1194-1195. doi: 10.1016/j.ekir.2021.02.027. eCollection 2021 Apr. Kidney Int Rep. 2021. PMID: 33912771 Free PMC article. No abstract available.
-
Balancing Stone Prevention and Kidney Function: A Therapeutic Dilemma.J Clin Med. 2025 May 23;14(11):3678. doi: 10.3390/jcm14113678. J Clin Med. 2025. PMID: 40507440 Free PMC article. Review.
-
Circulating Oxalate Levels in Short Bowel Syndrome as a Severity Marker of CKD.Kidney Int Rep. 2023 Dec 28;9(3):686-693. doi: 10.1016/j.ekir.2023.12.023. eCollection 2024 Mar. Kidney Int Rep. 2023. PMID: 38481504 Free PMC article.
-
Interleukin-16 is increased in dialysis patients but is not a cardiovascular risk factor.Sci Rep. 2024 May 17;14(1):11323. doi: 10.1038/s41598-024-61808-7. Sci Rep. 2024. PMID: 38760468 Free PMC article.
References
-
- Kusumi K., Barr-Beare E., Saxena V. Renal calcium oxalate deposits induce a pro-atherosclerotic and pro-osteoporotic response in mice. J Cell Biochem. 2017;118:2744–2751. - PubMed
-
- Saito T., Ikeda M., Asai K. Crystalline cardiomyopathy due to secondary oxalosis after short-bowel syndrome and end-stage renal failure. Clin Res Cardiol. 2016;105:714–716. - PubMed
Grants and funding
LinkOut - more resources
Full Text Sources
Other Literature Sources
Research Materials
Miscellaneous
