. 2020 Sep;4(5):585-593.
doi: 10.1109/trpms.2020.2991120. Epub 2020 Apr 29.

Impact of Using Uniform Attenuation Coefficients for Heterogeneously Dense Breasts in a Dedicated Breast PET/X-ray Scanner

Affiliations

Impact of Using Uniform Attenuation Coefficients for Heterogeneously Dense Breasts in a Dedicated Breast PET/X-ray Scanner

Lawrence R MacDonald et al. IEEE Trans Radiat Plasma Med Sci. 2020 Sep.

Abstract

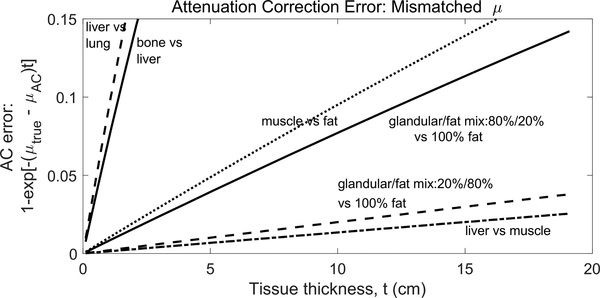
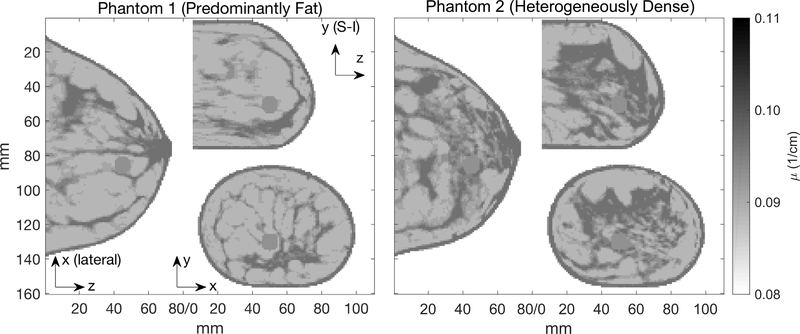
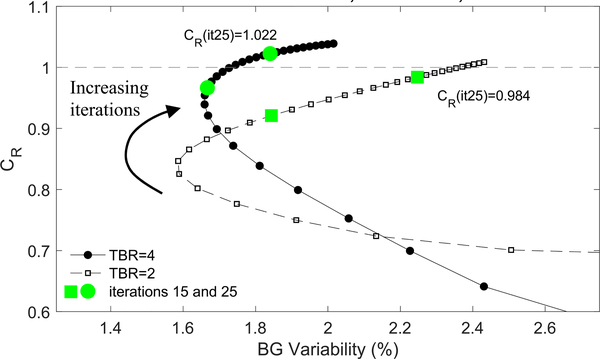
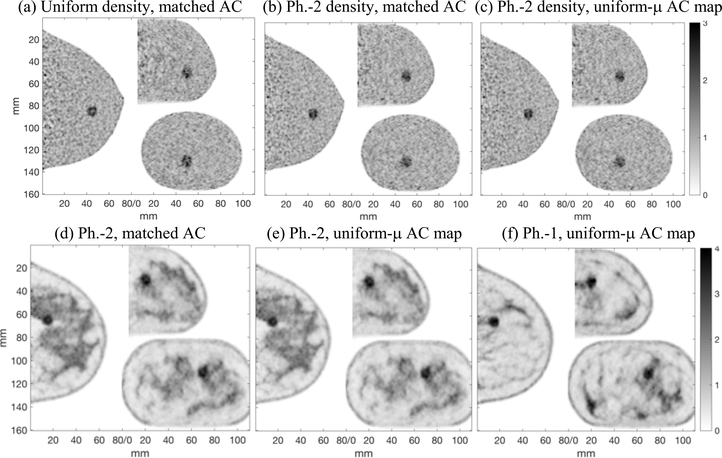
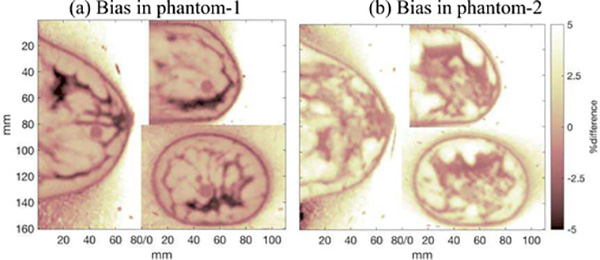
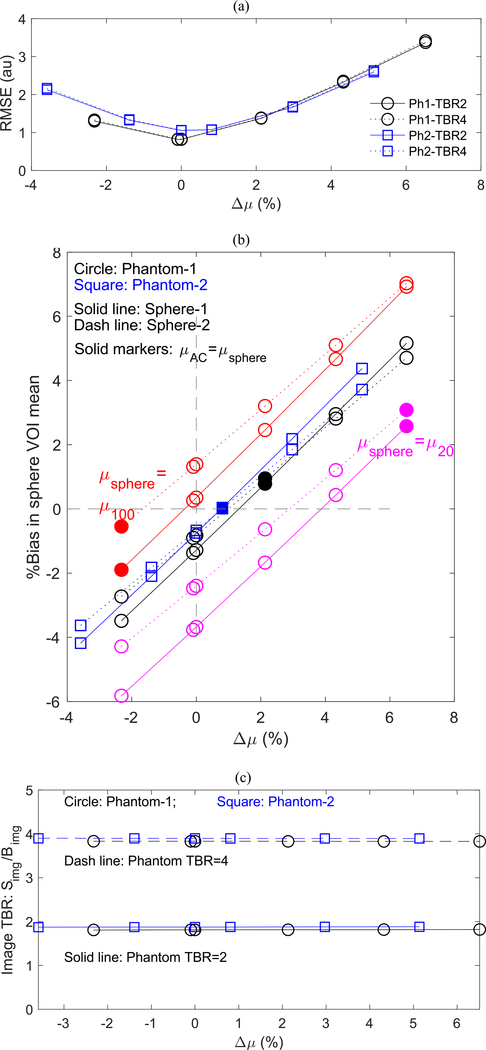
We investigated PET image quantification when using a uniform attenuation coefficient (μ) for attenuation correction (AC) of anthropomorphic density phantoms derived from high-resolution breast CT scans. A breast PET system was modeled with perfect data corrections except for AC. Using uniform μ for AC resulted in quantitative errors roughly proportional to the difference between μ used in AC (μ AC) and local μ, yielding approximately ± 5% bias, corresponding to the variation of μ for 511 keV photons in breast tissue. Global bias was lowest when uniform μ AC was equal to the phantom mean μ (μ mean). Local bias in 10-mm spheres increased as the sphere μ deviated from μ mean, but remained only 2-3% when the μ sphere was 6.5% higher than μ mean. Bias varied linearly with and was roughly proportional to local μ mismatch. Minimizing local bias, e.g., in a small sphere, required the use of a uniform μ value between the local μ and the μ mean. Thus, biases from using uniform-μ AC are low when local μ sphere is close to μ mean. As the μ sphere increasingly differs from the phantom μ mean, bias increases, and the optimal uniform μ is less predictable, having a value between μ sphere and the phantom μ mean.

Keywords: Attenuation correction; Breast PET; Positron Emission Tomography; Quantitative PET; Simulation.


Figures

Fig. 1.
Fig. 1.
Top: Dimensions and coordinates of the four-sided rectangular PETX scanner used for this work. S-I: superior-inferior, A-P: anterior-posterior. Bottom: Photograph of the PETX scanner that consists of six flat detector panels, two of which are removed in the photo. This is a frame for benchtop testing only, not the mechanism that mounts to a mammography machine. Photos of a prototype mechanism for mounting the PET detectors on a mammography machine are shown in a separate publication [4].
Fig. 2.
Fig. 2.
Percent error when attenuation coefficients (μ) used for correction are not matched to the attenuation coefficient of the medium being imaged. Different coincidence lines-of-response will experience different errors depending on the tissue thickness they traverse. This is a simple one-dimensional calculation using attenuation coefficients from SimSET tables. Table I gives μ values of mixed breast tissue used in this work.
Fig. 3.
Fig. 3.
Breast phantoms shown here and used in simulations have 1.0 mm voxels and attenuation coefficients given in Table I. They were down-sampled from 0.5 mm high-resolution dedicated breast CT scans with indexed density values [32]. The 3-D outline of each breast phantom #1 and #2 is the same. A third phantom with uniform μ was also created with the same outline. The image slices shown here contain sphere #2.
Fig. 4.
Fig. 4.
CR in the 10-mm diameter sphere-2 vs. BG-Variability in images of the phantom with uniform activity and uniform attenuating background reconstructed with matched AC μ-map.
Fig. 5.
Fig. 5.
Top row: Images of the phantom with uniform background activity, 10mm sphere #2 with TBR=2, and (a) uniform density, reconstructed with matched AC, (b) anthropomorphic density (Phantom-2), reconstructed with matched AC, (c) anthropomorphic density (Phantom-2), reconstructed with a uniform-μ AC map (μAC = μmean2). The top row images are shown with no post-reconstruction smoothing to illustrate the noise level. Bottom row: Images of the phantoms with non-uniform activity distribution, sphere #1, and anthropomorphic density: (d) Phantom-2 reconstructed with matched AC, (e) Phantom-2 reconstructed with uniform-μ AC map, (f) Phantom-1 reconstructed with uniform-μ AC map. A 3D Gaussian post-reconstruction smoothing (sigma = 0.75mm) was applied to the images in the bottom row. Single 1mm thick slices are shown in all cases. Artifacts from mis-matched AC are not observed.
Fig. 6.
Fig. 6.
Voxel-by-voxel bias images: (100%)(VuniAC - VmatchAC) / (VmatchAC), where VuniAC and VmatchAC are the image volumes reconstructed with uniform AC (μAC = μmean) and matched AC, respectively. A single slice of the difference images are shown here for the phantoms with uniform background activity, TBR = 4, and (a) Phantom-1, and (b) Phantom-2 attenuation distributions. The difference images were very similar for the corresponding cases of images of the phantoms with heterogeneous activity distribution. Outside of the breast object (air), activity image voxel values are nominally zero; image reconstruction yielded small finite values in these voxels, resulting in finite bias for these voxels.
Fig. 7.
Fig. 7.
As a function of Δμ: (a) Global RMSE between image volumes reconstructed with matched and uniform AC maps. (b) Bias in 10mm diameter sphere VOI mean for TBR = 2. The sphere VOI maximum values followed similar linear relationships. Solid markers indicate the case where μAC = μsphere. Simulations used μsphere = μ100, μ60, and μ20. Results were equivalent for TBR = 4 images. (c) Simg/Bimg for sphere VOI mean. Simg/Bimg for sphere VOI max was similarly constant with varying Δμ. These results were independent of the μ of the sphere.

Similar articles

Cited by

References

    1. MacDonald LR, Hunter WCJ, Kinahan PE, Miyaoka RS, Effects of detector thickness on geometric sensitivity and event positioning errors in the rectangular PET/X scanner, IEEE Tran. Nucl. Sci, 60(5):3242–52, 2013. Digital Object Identifier: 10.1109/TNS.2013.2278841. - DOI - PMC - PubMed
    1. Qian H, Wangerin KA, Wagadarikar A, Manjeshwar RM, MacDonald LR, Kinahan PE, Image Reconstruction in Rectangular PET Systems Using Distance-Driven Projections, 2013 IEEE Nuclear Science Symposium and Medical Imaging Conference Proceedings, 2014. DOI: 10.1109/NSSMIC.2013.6829338 - DOI
    1. Zeng G, Kinahan P, Qian H, Harrison R, Champley K, MacDonald L, Simulation study of quantitative precision of the PET/X dedicated breast PET scanner, J. Med. Imag. 4(4), 045502 (2017), doi: 10.1117/1.JMI.4.4.045502. - DOI - PMC - PubMed
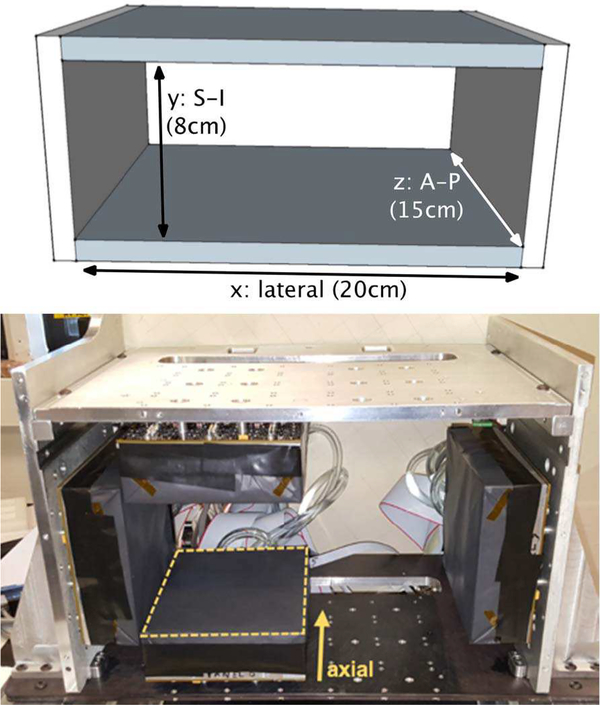
    1. MacDonald L, Hunter W, Zeng G, Pierce L, Dolinski S, DeWitt D, Miyaoka R, Kinahan P, "The PET/X dedicated breast-PET scanner for optimizing cancer therapy", Proc. SPIE 10718, 14th International Workshop on Breast Imaging (IWBI 2018), 107180M (6 July 2018); doi: 10.1117/12.2318419 - DOI
    1. Humbert O, Cochet A, Coudert B, et al., Role of Positron Emission Tomography for the Monitoring of Response to Therapy in Breast Cancer, The Oncologist, 20:94–104, 2015. - PMC - PubMed

LinkOut - more resources