Nonfasted Liver Stiffness Correlates with Liver Disease Parameters and Portal Hypertension in Pediatric Cholestatic Liver Disease
- PMID: 33163838
- PMCID: PMC7603532
- DOI: 10.1002/hep4.1574
Nonfasted Liver Stiffness Correlates with Liver Disease Parameters and Portal Hypertension in Pediatric Cholestatic Liver Disease
Abstract
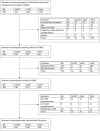
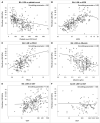
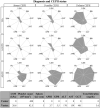
Elastographic measurement of liver stiffness is of growing importance in the assessment of liver disease. Pediatric experiences with this technique are primarily single center and limited in scope. The Childhood Liver Disease Research Network provided a unique opportunity to assess elastography in a well-characterized multi-institutional cohort. Children with biliary atresia (BA), alpha-1 antitrypsin deficiency (A1ATD), or Alagille syndrome (ALGS) followed in a prospective longitudinal network study were eligible for enrollment in a prospective investigation of transient elastography (FibroScan). Studies were performed in participants who were nonfasted and nonsedated. Liver stiffness measurements (LSMs) were correlated with standard clinical and biochemical parameters of liver disease along with a research definition of clinically evident portal hypertension (CEPH) graded as absent, possible, or definite. Between November 2016 and August 2019, 550 participants with a mean age of 8.8 years were enrolled, 458 of whom had valid LSMs (BA, n = 254; A1ATD, n = 104; ALGS, n = 100). Invalid scans were more common in participants <2 years old. There was a positive correlation between LSM and total bilirubin, international normalized ratio (INR), aspartate aminotransferase (AST), alanine aminotransferase (ALT), gamma-glutamyl transpeptidase (GGT), GGT to platelet ratio (GPR), pediatric end-stage liver disease score, AST to platelet ratio index, and spleen size, and a negative correlation with albumin and platelet count in BA, with similar correlations for A1ATD (except AST, ALT, and albumin) and ALGS (except for INR, GGT, GPR, and ALT). Possible or definite CEPH was more common in BA compared to ALGS and A1ATD. LSM was greater in definite versus absent CEPH in all three diseases. Disease-specific clinical and biochemical characteristics of the different CEPH grades were observed. Conclusion: It is feasible to obtain LSMs in children, especially over the age of 2 years. LSM correlates with liver parameters and portal hypertension, although disease-specific patterns exist.
© 2020 The Authors. Hepatology Communications published by Wiley Periodicals LLC on behalf of the American Association for the Study of Liver Diseases.
Figures


References
-
- Nakamura Y, Aikata H, Fukuhara T, Honda F, Morio K, Morio R, et al. Liver fibrosis assessment by FibroScan compared with pathological findings of liver resection specimen in hepatitis C infection. Hepatol Res 2017;47:767‐772. - PubMed
-
- Kim DW, Yoon HM, Jung AY, Lee JS, Oh SH, Kim KM, et al. Diagnostic performance of ultrasound elastography for evaluating portal hypertension in children: a systematic review and meta‐analysis. J Ultrasound Med 2019;38:747‐759. - PubMed
-
- Aqul A, Jonas MM, Harney S, Raza R, Sawicki GS, Mitchell PD, et al. Correlation of transient elastography with severity of cystic fibrosis‐related liver disease. J Pediatr Gastroenterol Nutr 2017;64:505‐511. - PubMed
Grants and funding
LinkOut - more resources
Full Text Sources
Miscellaneous

