

Transcription Factor Binding Affinities and DNA Shape Readout
- PMID: 33163946
- PMCID: PMC7607496
- DOI: 10.1016/j.isci.2020.101694
Transcription Factor Binding Affinities and DNA Shape Readout
Abstract
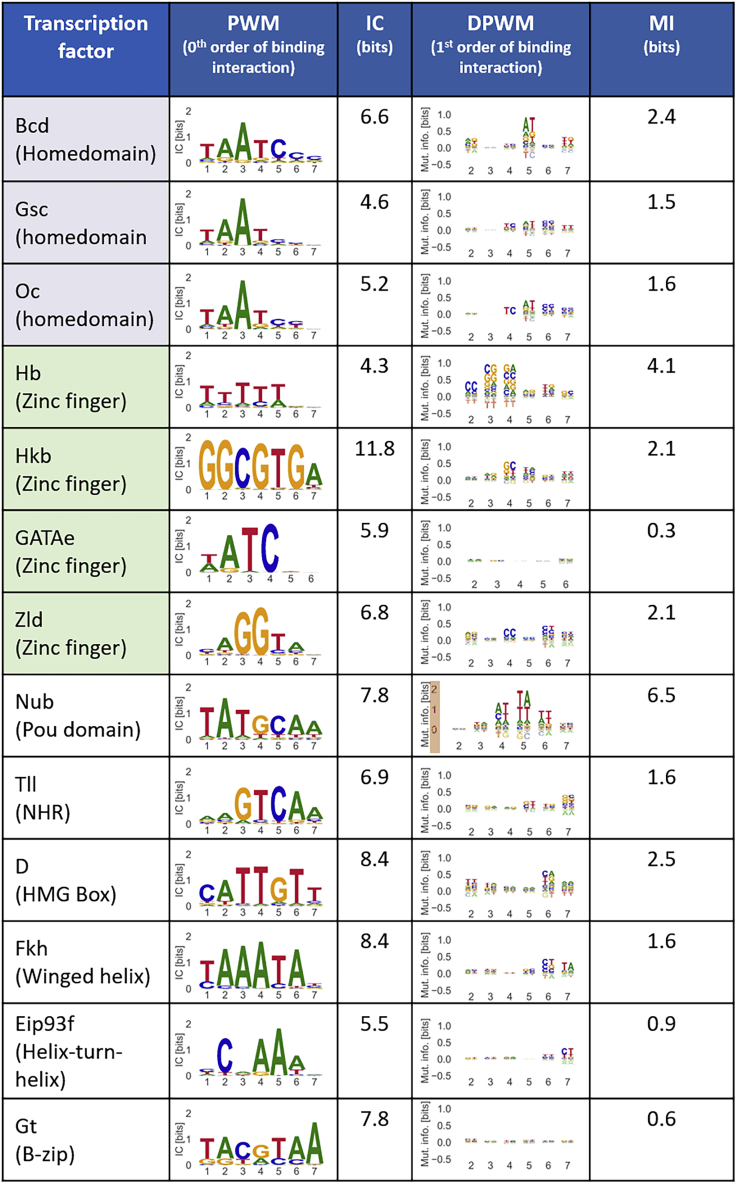
An essential event in gene regulation is the binding of a transcription factor (TF) to its target DNA. Models considering the interactions between the TF and the DNA geometry proved to be successful approaches to describe this binding event, while conserving data interpretability. However, a direct characterization of the DNA shape contribution to binding is still missing due to the lack of accurate and large-scale binding affinity data. Here, we use a binding assay we recently established to measure with high sensitivity the binding specificities of 13 Drosophila TFs, including dinucleotide dependencies to capture non-independent amino acid-base interactions. Correlating the binding affinities with all DNA shape features, we find that shape readout is widely used by these factors. A shape readout/TF-DNA complex structure analysis validates our approach while providing biological insights such as positively charged or highly polar amino acids often contact nucleotides that exhibit strong shape readout.
Keywords: Biomolecules; Molecular Biology; Molecular Mechanism of Gene Regulation.
© 2020 The Authors.
Conflict of interest statement
The authors declare no conflict of interests.
Figures


Similar articles
-
Quantitative modeling of transcription factor binding specificities using DNA shape.Proc Natl Acad Sci U S A. 2015 Apr 14;112(15):4654-9. doi: 10.1073/pnas.1422023112. Epub 2015 Mar 9. Proc Natl Acad Sci U S A. 2015. PMID: 25775564 Free PMC article.
-
Transcription factor family-specific DNA shape readout revealed by quantitative specificity models.Mol Syst Biol. 2017 Feb 6;13(2):910. doi: 10.15252/msb.20167238. Mol Syst Biol. 2017. PMID: 28167566 Free PMC article.
-
A unified approach for quantifying and interpreting DNA shape readout by transcription factors.Mol Syst Biol. 2018 Feb 22;14(2):e7902. doi: 10.15252/msb.20177902. Mol Syst Biol. 2018. PMID: 29472273 Free PMC article.
-
Toward a Mechanistic Understanding of DNA Methylation Readout by Transcription Factors.J Mol Biol. 2020 Mar 13;432(6):1801-1815. doi: 10.1016/j.jmb.2019.10.021. Epub 2019 Nov 2. J Mol Biol. 2020. PMID: 31689433 Free PMC article. Review.
-
Methods for Analysis of Transcription Factor DNA-Binding Specificity In Vitro.Subcell Biochem. 2011;52:155-73. doi: 10.1007/978-90-481-9069-0_7. Subcell Biochem. 2011. PMID: 21557082 Review.
Cited by
-
Skipping events impose repeated binding attempts: profound kinetic implications of protein-DNA conformational changes.Nucleic Acids Res. 2024 Jul 8;52(12):6763-6776. doi: 10.1093/nar/gkae333. Nucleic Acids Res. 2024. PMID: 38721783 Free PMC article.
-
Substrate DNA Promoting Binding of Mycobacterium tuberculosis MtrA by Facilitating Dimerization and Interpretation of Affinity by Minor Groove Width.Microorganisms. 2023 Oct 7;11(10):2505. doi: 10.3390/microorganisms11102505. Microorganisms. 2023. PMID: 37894163 Free PMC article.
-
Elucidating the biology of transcription factor-DNA interaction for accurate identification of cis-regulatory elements.Curr Opin Plant Biol. 2022 Aug;68:102232. doi: 10.1016/j.pbi.2022.102232. Epub 2022 Jun 6. Curr Opin Plant Biol. 2022. PMID: 35679803 Free PMC article. Review.
-
Harnessing regulatory networks in Actinobacteria for natural product discovery.J Ind Microbiol Biotechnol. 2024 Jan 9;51:kuae011. doi: 10.1093/jimb/kuae011. J Ind Microbiol Biotechnol. 2024. PMID: 38569653 Free PMC article. Review.
-
Mechanisms driving functional divergence of transcription factor paralogs.New Phytol. 2025 Sep;247(5):2022-2033. doi: 10.1111/nph.70309. Epub 2025 Jun 19. New Phytol. 2025. PMID: 40538067 Free PMC article. Review.
References
-
- Affolter M., Slattery M., Mann R.S. A lexicon for homeodomain-DNA recognition. Cell. 2008;133:1133–1135. - PubMed
-
- Baird-Titus J.M., Clark-Baldwin K., Dave V., Caperelli C.A., Ma J., Rance M. The solution structure of the native K50 Bicoid homeodomain bound to the consensus TAATCC DNA-binding site. J. Mol. Biol. 2006;356:1137–1151. - PubMed
LinkOut - more resources
Full Text Sources
Molecular Biology Databases
Miscellaneous
