DNA-Origami-Based Fluorescence Brightness Standards for Convenient and Fast Protein Counting in Live Cells
- PMID: 33164530
- PMCID: PMC7726105
- DOI: 10.1021/acs.nanolett.0c03925
DNA-Origami-Based Fluorescence Brightness Standards for Convenient and Fast Protein Counting in Live Cells
Abstract
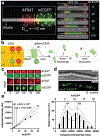
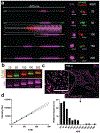
Fluorescence microscopy has been one of the most discovery-rich methods in biology. In the digital age, the discipline is becoming increasingly quantitative. Virtually all biological laboratories have access to fluorescence microscopes, but abilities to quantify biomolecule copy numbers are limited by the complexity and sophistication associated with current quantification methods. Here, we present DNA-origami-based fluorescence brightness standards for counting 5-300 copies of proteins in bacterial and mammalian cells, tagged with fluorescent proteins or membrane-permeable organic dyes. Compared to conventional quantification techniques, our brightness standards are robust, straightforward to use, and compatible with nearly all fluorescence imaging applications, thereby providing a practical and versatile tool to quantify biomolecules via fluorescence microscopy.
Keywords: Bioconjugation; Brightness standard; DNA origami; Fluorescent protein; Live cell imaging; Quantitative microscopy.
Figures


Similar articles
-
Counting fluorescent dye molecules on DNA origami by means of photon statistics.Small. 2013 Dec 9;9(23):4061-8. doi: 10.1002/smll.201300619. Epub 2013 Jun 24. Small. 2013. PMID: 23794455
-
Fluorescent Biosensors Based on Single-Molecule Counting.Acc Chem Res. 2016 Sep 20;49(9):1722-30. doi: 10.1021/acs.accounts.6b00237. Epub 2016 Sep 1. Acc Chem Res. 2016. PMID: 27583695 Review.
-
DNA origami-based standards for quantitative fluorescence microscopy.Nat Protoc. 2014;9(6):1367-91. doi: 10.1038/nprot.2014.079. Epub 2014 May 15. Nat Protoc. 2014. PMID: 24833175
-
Toward quantitative fluorescence microscopy with DNA origami nanorulers.Methods Cell Biol. 2014;123:449-66. doi: 10.1016/B978-0-12-420138-5.00024-0. Methods Cell Biol. 2014. PMID: 24974042
-
Make them blink: probes for super-resolution microscopy.Chemphyschem. 2010 Aug 23;11(12):2475-90. doi: 10.1002/cphc.201000189. Chemphyschem. 2010. PMID: 20632356 Review.
Cited by
-
Functionalizing DNA origami to investigate and interact with biological systems.Nat Rev Mater. 2023 Feb;8(2):123-138. doi: 10.1038/s41578-022-00517-x. Epub 2022 Dec 19. Nat Rev Mater. 2023. PMID: 37206669 Free PMC article.
-
FisB relies on homo-oligomerization and lipid binding to catalyze membrane fission in bacteria.PLoS Biol. 2021 Jun 29;19(6):e3001314. doi: 10.1371/journal.pbio.3001314. eCollection 2021 Jun. PLoS Biol. 2021. PMID: 34185788 Free PMC article.
-
Efficiency scale for scattering luminescent particles linked to fundamental and measurable spectroscopic properties.Sci Rep. 2023 Apr 17;13(1):6254. doi: 10.1038/s41598-023-32933-6. Sci Rep. 2023. PMID: 37069220 Free PMC article.
-
Probing cell membrane integrity using a histone-targeting protein nanocage displaying precisely positioned fluorophores.Nano Res. 2023;16(1):894-904. doi: 10.1007/s12274-022-4785-5. Epub 2022 Sep 2. Nano Res. 2023. PMID: 36090614 Free PMC article.
References
Publication types
MeSH terms
Substances
Grants and funding
LinkOut - more resources
Full Text Sources
Other Literature Sources

