. 2020;78(4):1419-1438.
doi: 10.3233/JAD-200109.

Electrophysiological and Imaging Calcium Biomarkers of Aging in Male and Female 5×FAD Mice

Affiliations

Electrophysiological and Imaging Calcium Biomarkers of Aging in Male and Female 5×FAD Mice

Adam O Ghoweri et al. J Alzheimers Dis. 2020.

Abstract

Background: In animal models and tissue preparations, calcium dyshomeostasis is a biomarker of aging and Alzheimer's disease that is associated with synaptic dysfunction, neuritic pruning, and dysregulated cellular processes. It is unclear, however, whether the onset of calcium dysregulation precedes, is concurrent with, or is the product of pathological cellular events (e.g., oxidation, amyloid-β production, and neuroinflammation). Further, neuronal calcium dysregulation is not always present in animal models of amyloidogenesis, questioning its reliability as a disease biomarker.

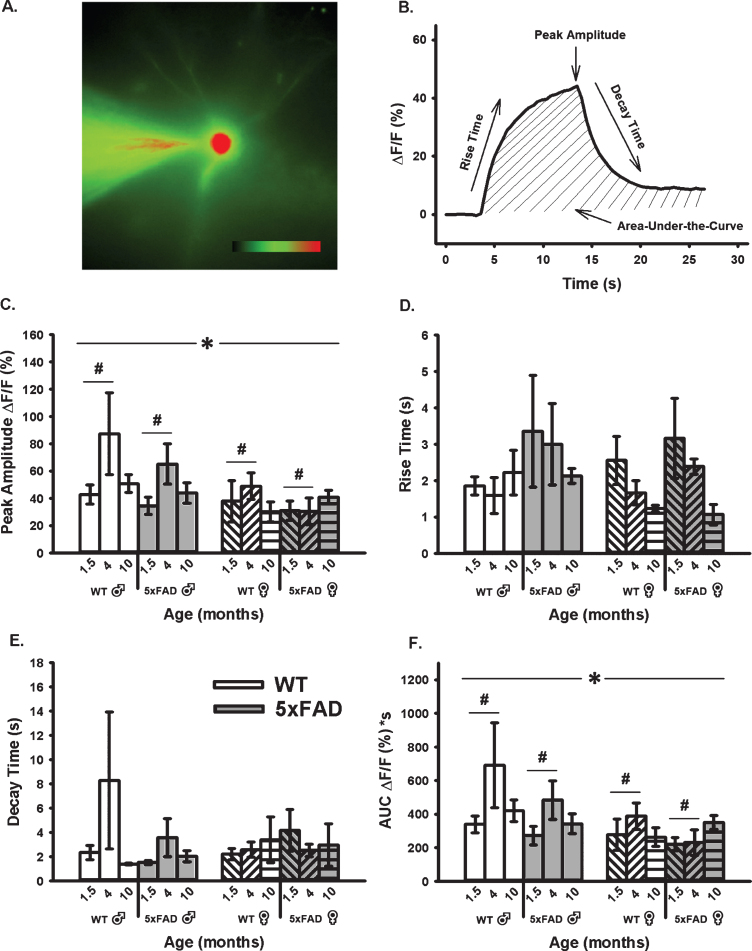
Objective: Here, we directly tested for the presence of calcium dysregulation in dorsal hippocampal neurons in male and female 5×FAD mice on a C57BL/6 genetic background using sharp electrodes coupled with Oregon-green Bapta-1 imaging. We focused on three ages that coincide with the course of amyloid deposition: 1.5, 4, and 10 months old.

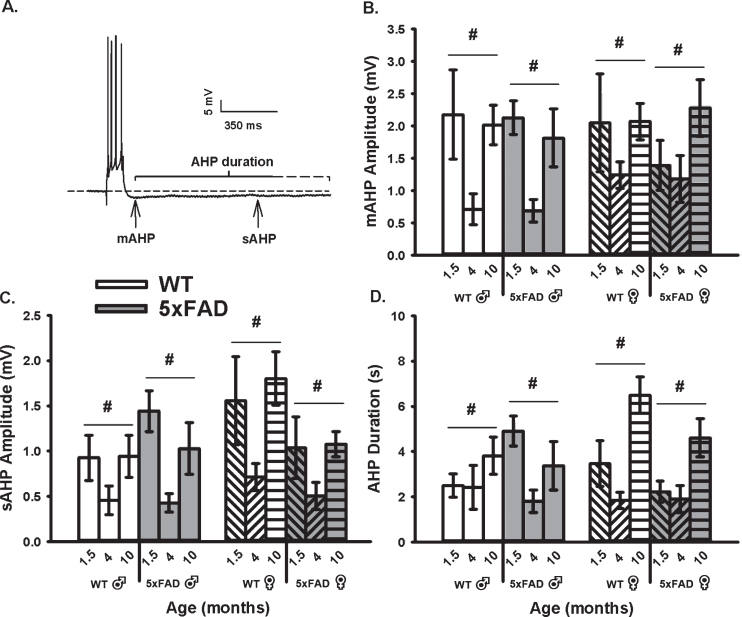
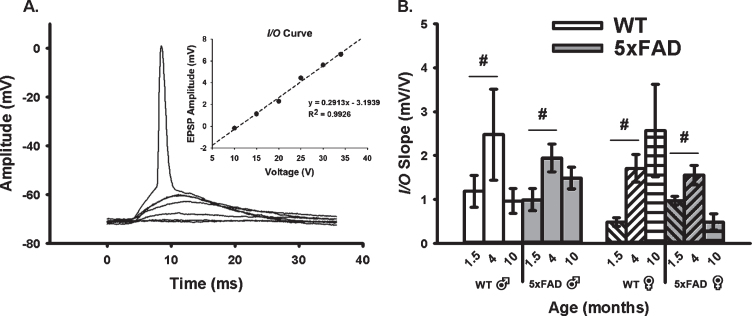
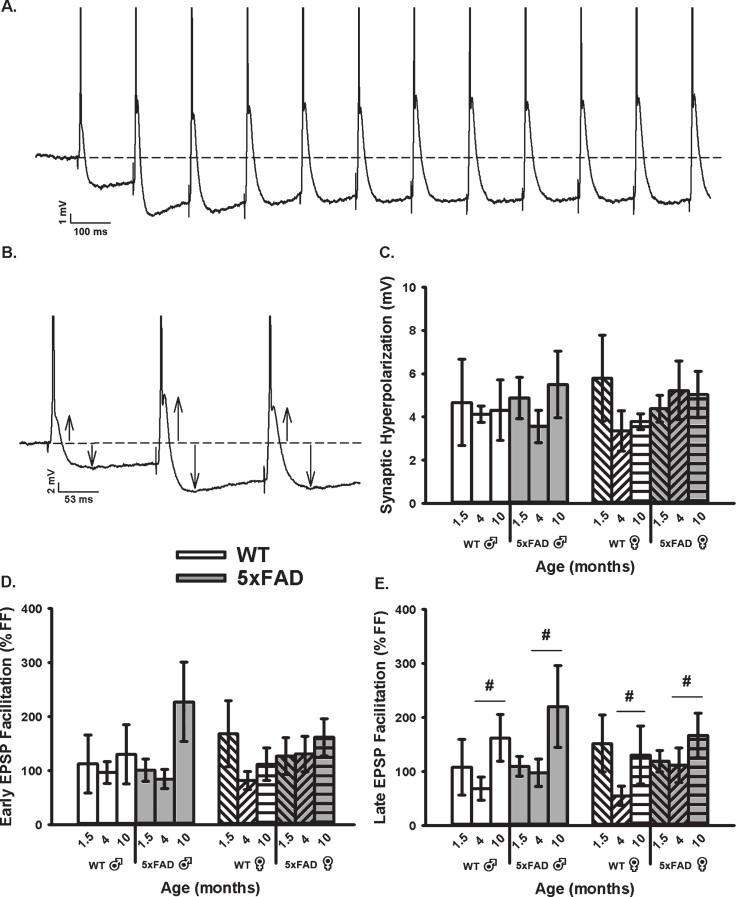
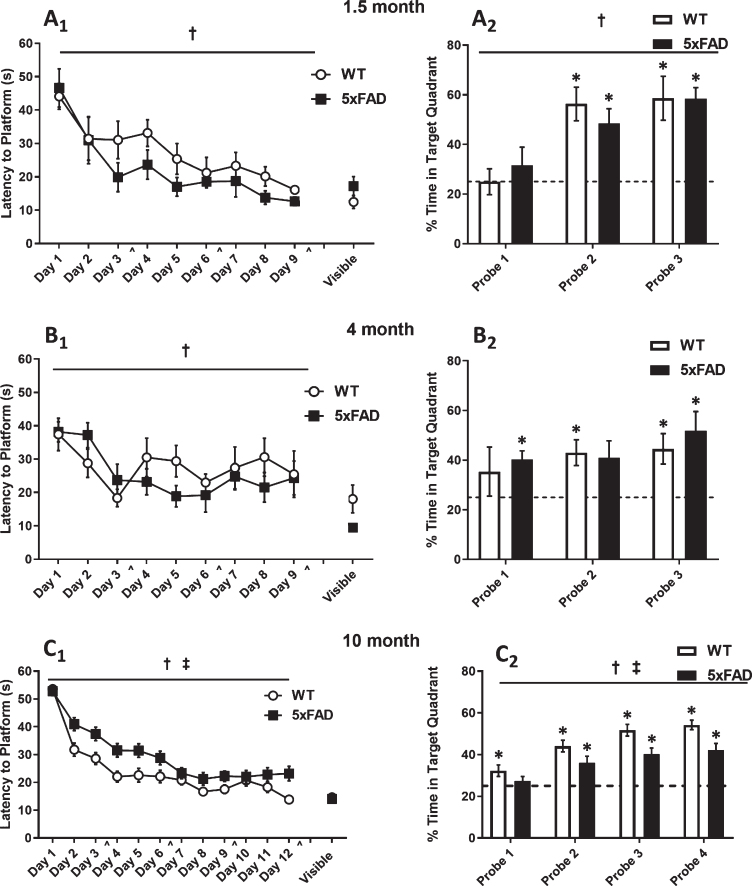
Methods: Outcome variables included measures of the afterhyperpolarization, short-term synaptic plasticity, and calcium kinetics during synaptic activation. Quantitative analyses of spatial learning and memory were also conducted using the Morris water maze. Main effects of sex, age, and genotype were identified on measures of electrophysiology and calcium imaging.

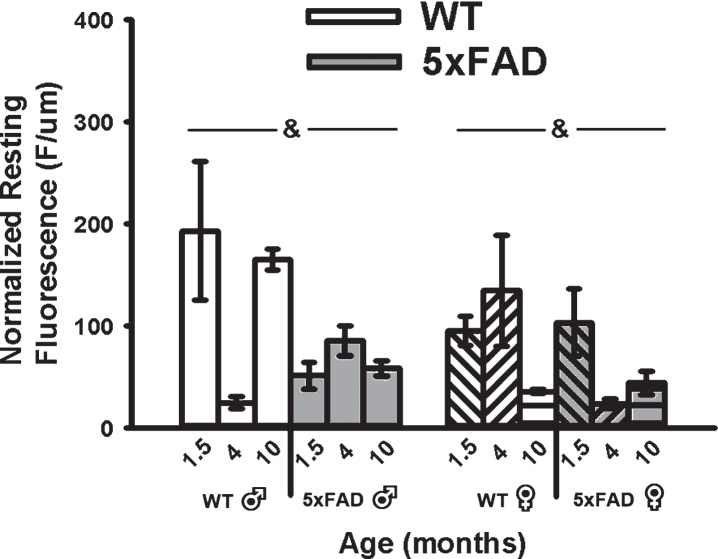
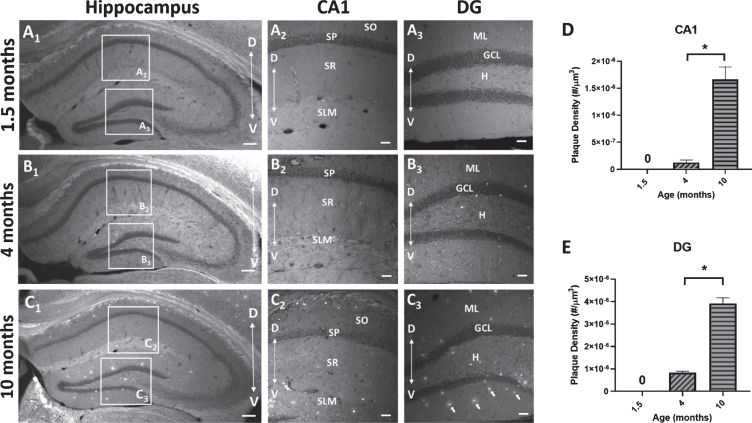
Results: Measures of resting Oregon-green Bapta-1 fluorescence showed significant reductions in the 5×FAD group compared to controls. Deficits in spatial memory, along with increases in Aβ load, were detectable at older ages, allowing us to test for temporal associations with the onset of calcium dysregulation.

Conclusion: Our results provide evidence that reduced, rather than elevated, neuronal calcium is identified in this 5×FAD model and suggests that this surprising result may be a novel biomarker of AD.

Keywords: 5×FAD; Alzheimer’s disease; afterhyperpolarization; aging; calcium; electrophysiology; hippocampus; hyperactivity; intracellular; sex.


Conflict of interest statement

Authors’ disclosures available online (https://www.j-alz.com/manuscript-disclosures/20-0109r1).

Figures

Fig. 1
Fig. 1
AHP Measures in WT and 5×FAD Mice Across Age and Sex. A) Example of an AHP following post-synaptic depolarization with 4 APs. B) A main effect of aging (p < 0.05) on the mAHP was observed within each genotype and across sex. C, D) Similar findings were observed on the sAHP (800 ms) amplitude measures, as well as on the AHP duration. Hashes (#) represent significance in aging at p < 0.05.
Fig. 2
Fig. 2
Extracellular Synaptic Activation. A) Example of EPSPs recorded below and at threshold of an AP. Inset shows input/output (I/O) plot fit from EPSP amplitudes with increasing stimulation intensity. B) Synaptic excitability derived from I/O measures (slopes) reveal a significant main effect of aging across genotypes and sex. Hashes (#) represent significance in aging at p < 0.05.
Fig. 3
Fig. 3
Repeated Synaptic Stimulation (RSS). A) Example of RSS showing EPSP potentiation and synaptic hyperpolarization. Cells were repeatedly stimulated at 7 Hz for 10 s. B) Upward arrows illustrate growth in EPSP amplitude during RSS and downward arrows show increased amplitude in the synaptic hyperpolarization. APs are truncated for illustration in A and B. C) Synaptic hyperpolarization measured during RSS was not altered across aging or genotypes. D, E) EPSP facilitation taken during the first (early) and last (late) periods of RSS. A main effect of age was noted on measures of late EPSP facilitation displaying an increase in the older group, independent of sex. Hashes (#) represent significance in aging at p < 0.05.
Fig. 4
Fig. 4
Changes in OGB-1 Fluorescence During 10 s RSS. A) Example of an imaged OGB-1 loaded neuron. B). Normalized fluorescence change across time (% ΔF/F) before, during, and after RSS. C) Peak amplitude measures show both a significant effect of age and sex. D, E) No significant differences were found in measures of rise or decay time constants. F) AUC shows significant effects of both age and sex. Hashes (#) represent significance in aging and asterisks (*) represent sex differences at p < 0.05.
Fig. 5
Fig. 5
Resting Fluorescence Before RSS. Mean resting fluorescence was normalized to the depth of each recorded cell. Significant genotype effect was detected, highlighting reduced fluorescence in the 5×FAD animals compared to WT. Ampersands (&) indicate significance for genotype at p < 0.05.
Fig. 6
Fig. 6
Morris Water Maze Data. Mice were trained using 4 trials per day for 9 days (1.5- and 4-month-old animals; A1-B1.) or 12 days (10-month-old animals; C1.) days on the hidden platform task. Memory performance was assessed using probe trials on days 4, 7, 10 [∧] (all age groups; A2-C2.) and 13 (10-month; C2.). By the final probe, all groups spent significantly more time (>25%) in the target quadrant. 1.5- and 4-month mice exhibited a significant decline in the latency to find the hidden platform across training days, but no differences were seen between genotypes (A1-B1.). There were no significant differences between genotypes during probe trials (A2-B2.). 10-month-old 5× FAD and WT mice exhibited a significant decline in latency to find the hidden platform across training days; however, 5× FAD mice had a longer latency to reach the platform compared to the WT mice (C1.). During probe trials, 5×FAD mice spent significantly less time in the target quadrant than WT littermates (C2.), indicating a memory deficit. Asterisks (*), daggers (†), and double daggers (‡) represent significant values at p < 0.05.
Fig. 7
Fig. 7
Amyloid-β (Aβ) plaque deposits in the hippocampus of 5×FAD mice. Coronal sections (40μm) of the dorsal hippocampus (AP, -2.0 bregma) from 1.5, 4, and 10-month-old 5×FAD mice were stained with the amyloid imaging agent BTA-1. A1-C1) Representative images of the hippocampus of 5×FAD mice demonstrating the observed age-dependent increase in Aβ plaque accumulation and the regions of interest (ROI) in CA1 and dentate gyrus (DG) that were used to quantify Aβ plaque density. A2,3-C2,3) Representative maximum intensity projection images (20× air; 635μm×635μm×15μm, Δz = 5μm) of Aβ plaque deposits in CA1 and DG from 1.5, 4, and 10-month-old 5×FAD mice. Arrows in panel C3 point to BTA-1 stained Aβ plaques. D, E) Aβ plaque density (plaque #/μm3) was quantified in the CA1 region and DG from 20× images using the Analyze Particles plug-in in FIJI. Significant differences in Aβ plaque density were found between 4-month-old and 10-month-old 5×FAD mice. Analysis of the 1.5-month-old mice were not included because no plaques were observed. Hippocampal layers; CA1: stratum oriens (SO), stratum pyramidale (SP), stratum radiatum (SR), stratum lacunosum-moleculare (SLM) and DG: molecular layer (ML), granule cell layer (GCL) and the hilus (H). Scale bar: 4× images = 200μm, 20× images = 50μm. Asterisks (*) represent significance determined by a 2-tailed unpaired t-test with p < 0.05. Dorsal (D) ← →Ventral (V).

References

    1. Alzheimer’s Association (2016) 2016 Alzheimer’s disease facts and figures. Alzheimers Dement 12, 459–509. - PubMed
    1. Mandelkow EM, Mandelkow E (1993) Tau as a marker for Alzheimer’s disease. Trends Biochem Sci 18, 480–483. - PubMed
    1. Lassmann H, Fischer P, Jellinger K (1993) Synaptic pathology of Alzheimer’s disease. Ann N Y Acad Sci 695, 59–64. - PubMed
    1. De-Paula VJ, Radanovic M, Diniz BS, Forlenza OV (2012) Alzheimer’s disease. Subcell Biochem 65, 329–352. - PubMed
    1. Takeda S (2019) Progression of Alzheimer’s disease, tau propagation, and its modifiable risk factors. Neurosci Res 141, 36–42. - PubMed

Publication types

MeSH terms