Review
. 2021 Jan 1;49(1):e63-e79.
doi: 10.1097/CCM.0000000000004710.

Practitioner's Guide to Latent Class Analysis: Methodological Considerations and Common Pitfalls

Affiliations
Review

Practitioner's Guide to Latent Class Analysis: Methodological Considerations and Common Pitfalls

Pratik Sinha et al. Crit Care Med. .

Abstract

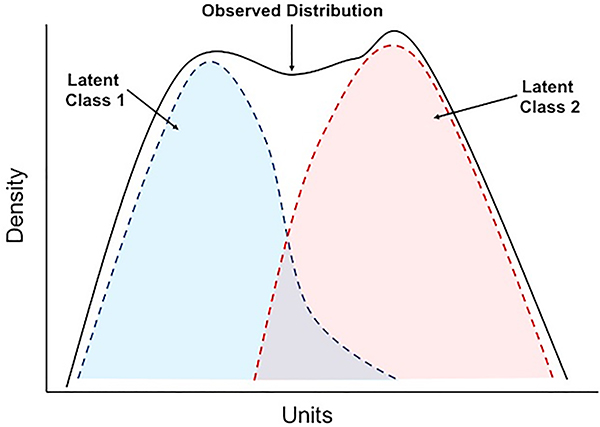
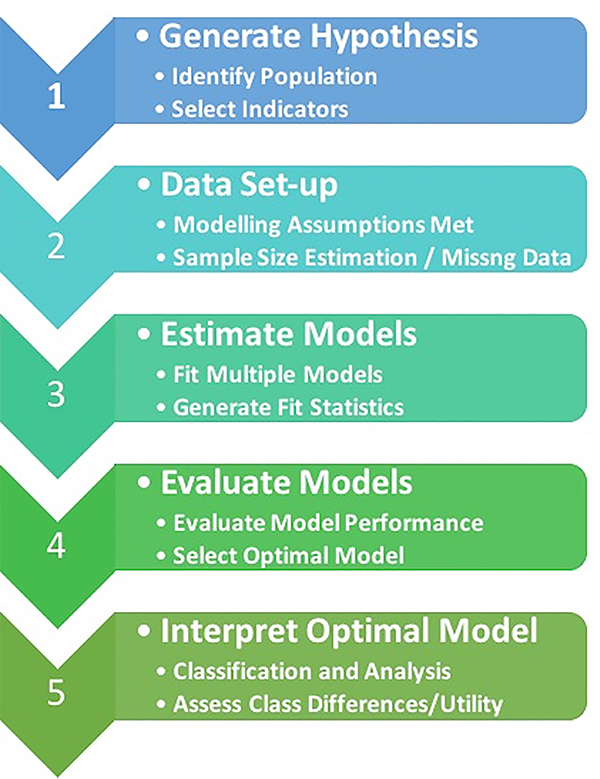
Latent class analysis is a probabilistic modeling algorithm that allows clustering of data and statistical inference. There has been a recent upsurge in the application of latent class analysis in the fields of critical care, respiratory medicine, and beyond. In this review, we present a brief overview of the principles behind latent class analysis. Furthermore, in a stepwise manner, we outline the key processes necessary to perform latent class analysis including some of the challenges and pitfalls faced at each of these steps. The review provides a one-stop shop for investigators seeking to apply latent class analysis to their data.


Figures

Figure 1
Figure 1
Illustration of “hidden” or latent classes in a population where the data are normally distributed. The black lines show the density of distribution in the whole population, the dotted lines represent two latent classes (blue and red). The presence of latent classes within a population is a central assumption to the modelling algorithms of latent class analysis.
Figure 2
Figure 2
Schematic of the stepwise approach for performing latent class analysis.
Figure 3
Figure 3
Histogram demonstrating the impact of imputation strategies for biomarker assay quantification values that were below the lower limit of detection (LLD). For each presented biomarker the values were imputed as either as (I) LLD; (II) LLD/2; (III) LLD = 0 (IV) LLD = 0.1. 3A: Represents z-score transformation and log-transformed data for Surfactant Protein-D, where there were 7 out of 587 values below the LLD (84.5 ng/mL). 3B: Represents z-score transformation and log-transformed data for Intercellular Adhesion Molecule-1, where there were 7 out of 587 values below the LLD (2.3 ng/mL).
Figure 3
Figure 3
Histogram demonstrating the impact of imputation strategies for biomarker assay quantification values that were below the lower limit of detection (LLD). For each presented biomarker the values were imputed as either as (I) LLD; (II) LLD/2; (III) LLD = 0 (IV) LLD = 0.1. 3A: Represents z-score transformation and log-transformed data for Surfactant Protein-D, where there were 7 out of 587 values below the LLD (84.5 ng/mL). 3B: Represents z-score transformation and log-transformed data for Intercellular Adhesion Molecule-1, where there were 7 out of 587 values below the LLD (2.3 ng/mL).
Figure 4:
Figure 4:
Example of an Elbow plot used for evaluating the Bayesian information criteria (BIC) or other indices of model-fitting. The red arrow indicates the “elbow”, where further increases in model complexity (i.e. more classes) does not yield the same decreases in BIC (lower values suggest a better fitting model. These values are from unpublished data from prior ARDS studies.
Figure 5:
Figure 5:. Illustration of the “Salsa effect” in latent class analysis using simulated data. The indicators of the identified classes when plotted on a graph they run parallel to each other, suggesting that the identified classes are merely representative of scales of severity of these variables.
ICAM-1 = Intercellular Adhesion Molecule-1, IL = Interleukin Ang-2 = Angiopoetin-2, sTNFR-1 = Soluble tumor necrosis factor receptor-1.
Figure 6
Figure 6
Key steps and consideration when critically evaluating a latent class analysis study.

References

    1. Matthay MA, Zemans RL, Zimmerman GA, Arabi YM, et al.: Acute respiratory distress syndrome. Nat Rev Dis Primers 2019; 5(1):18. - PMC - PubMed
    1. Marshall JC: Why have clinical trials in sepsis failed? Trends Mol Med 2014; 20(4):195–203 - PubMed
    1. Soni N: ARDS, acronyms and the Pinocchio effect. Anaesthesia 2010; 65(10):976–979 - PubMed
    1. Sinha P, Calfee CS: Phenotypes in acute respiratory distress syndrome: moving towards precision medicine. Curr Opin Crit Care 2019; 25(1):12–20 - PMC - PubMed
    1. Pavord ID, Beasley R, Agusti A, Anderson GP, et al.: After asthma: redefining airways diseases. Lancet 2018; 391(10118):350–400 - PubMed

Publication types