

Association of Highly Restrictive State Abortion Policies With Abortion Rates, 2000-2014
- PMID: 33165610
- PMCID: PMC7653496
- DOI: 10.1001/jamanetworkopen.2020.24610
Association of Highly Restrictive State Abortion Policies With Abortion Rates, 2000-2014
Abstract
Importance: Although abortion is common in the United States, patients face substantial barriers to obtaining an abortion. Recently enacted abortion restrictions pose such barriers.
Objectives: To assess the association between a state legislative climate that is highly restrictive toward abortion provision and the abortion rate and to evaluate whether distance to a facility providing abortion care mediates the association between legislative climate and the abortion rate.
Design, setting, and participants: This cohort study examined county-of-residence abortion rates from all states that publicly provided them and used data on abortion restrictions, facility locations, and county demographic characteristics for the years 2000 to 2014. The association between legislative climate and abortion rates was evaluated using propensity score-weighted, linear regression difference-in-difference analysis. All models included state and year fixed effects and standard errors adjusted for state-level clustering.
Exposures: Highly restrictive legislative climate, defined as having at least 3 of 4 types of abortion restrictions; distance to a high-volume facility providing abortion care (ie, performing ≥395 abortions per year) in miles.
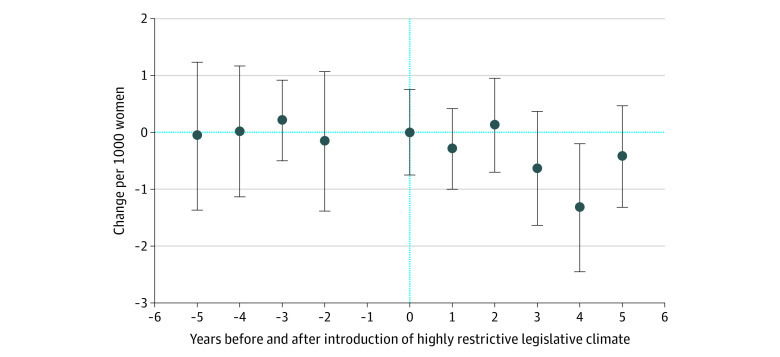
Main outcomes and measures: County-level abortion rate, defined as abortions per 1000 women per year.
Results: Abortion rate data were obtained from 1178 counties in 18 states for a median of 12.5 years (range, 5-14). The median abortion rate was 2.89 per 1000 women (interquartile range, 1.71-4.46 per 1000 women). A highly restrictive legislative climate, when compared with a less restrictive one, was associated with 0.48 fewer abortions per 1000 women (95% CI, -0.92 to -0.04 abortions per 1000 women; P = .03). Adjusted for distance to a facility providing abortion care, a highly restrictive legislative climate was associated with 0.44 fewer abortions per 1000 women (95% CI, -0.85 to -0.03; P = .04). Each mile to a facility was associated with 0.02 fewer abortions per 1000 women (95% CI, -0.03 to -0.01 abortions per 1000 women; P = .003). Legislative climate was not significantly associated with distance to a facility providing abortion care (change in distance associated with highly restrictive climate, -2.73 [95% CI, -6.02 to 0.57] miles; P = .10).
Conclusions and relevance: This study provides evidence that a state legislative climate that is highly restrictive toward abortion provision is associated with a lower abortion rate. The cumulative effect of restrictive policies may pose a barrier to abortion access.
Conflict of interest statement
Figures
Similar articles
-
Association of Travel Distance to Nearest Abortion Facility With Rates of Abortion.JAMA Netw Open. 2021 Jul 1;4(7):e2115530. doi: 10.1001/jamanetworkopen.2021.15530. JAMA Netw Open. 2021. PMID: 34228128 Free PMC article.
-
Change in Second-Trimester Abortion After Implementation of a Restrictive State Law.Obstet Gynecol. 2019 Apr;133(4):771-779. doi: 10.1097/AOG.0000000000003183. Obstet Gynecol. 2019. PMID: 30870293 Free PMC article.
-
Distance to an Abortion Provider and Its Association with the Abortion Rate: A Multistate Longitudinal Analysis.Perspect Sex Reprod Health. 2020 Dec;52(4):227-234. doi: 10.1363/psrh.12164. Epub 2020 Dec 17. Perspect Sex Reprod Health. 2020. PMID: 33332717
-
The economic impact of state restrictions on abortion: parental consent and notification laws and Medicaid funding restrictions.J Policy Anal Manage. 1993 Summer;12(3):498-511. J Policy Anal Manage. 1993. PMID: 10127357 Review.
-
Government in the examining room: restrictions on the provision of abortion.J Am Med Womens Assoc (1972). 1994 Sep-Oct;49(5):153-5, 164. J Am Med Womens Assoc (1972). 1994. PMID: 7806759 Review.
Cited by
-
Abortion access barriers shared in "r/abortion" after Roe: a qualitative analysis of a Reddit community post-Dobbs decision leak in 2022.Sex Reprod Health Matters. 2024 Dec;32(1):2426921. doi: 10.1080/26410397.2024.2426921. Epub 2024 Dec 6. Sex Reprod Health Matters. 2024. PMID: 39513330 Free PMC article.
-
Association Between State Abortion Restrictiveness and Perinatal Depression.J Womens Health (Larchmt). 2025 Jun;34(6):835-842. doi: 10.1089/jwh.2024.0533. J Womens Health (Larchmt). 2025. PMID: 40499069 Free PMC article.
-
Racial/ethnic and educational inequities in restrictive abortion policy variation and adverse birth outcomes in the United States.BMC Health Serv Res. 2021 Oct 22;21(1):1139. doi: 10.1186/s12913-021-07165-x. BMC Health Serv Res. 2021. PMID: 34686197 Free PMC article.
-
State abortion restrictiveness and prevalence of intimate partner violence and domestic violence among recently birthing black and white individuals.Front Reprod Health. 2025 Apr 14;7:1535865. doi: 10.3389/frph.2025.1535865. eCollection 2025. Front Reprod Health. 2025. PMID: 40297131 Free PMC article.
-
The influence of feminist abortion accompaniment on emotions related to abortion: A longitudinal observational study in Mexico.SSM Popul Health. 2022 Oct 4;19:101259. doi: 10.1016/j.ssmph.2022.101259. eCollection 2022 Sep. SSM Popul Health. 2022. PMID: 36238820 Free PMC article.
References
-
- Guttmacher Institute Last five years account for more than one-quarter of all abortion restrictions enacted since Roe. Published March 18, 2016. Accessed July 1, 2020. https://www.guttmacher.org/article/2016/01/last-five-years-account-more-...
-
- Nash E, Gold RB, Ansari-Thomas A, Cappello O, Mohammed L. Laws affecting reproductive health and rights: state trends at midyear, 2016. Guttmacher Institute Published July 21, 2016. Accessed July 1, 2020. https://www.guttmacher.org/article/2016/07/laws-affecting-reproductive-h...
-
- Nash E, Mohammed L, Cappello O, Naide S. State policy trends 2019: a wave of abortion bans, but some states are fighting back. Guttmacher Institute Published December 10, 2019. Accessed July 1, 2020. https://www.guttmacher.org/article/2019/12/state-policy-trends-2019-wave...
Publication types
MeSH terms
LinkOut - more resources
Full Text Sources
Medical
