

Quantitative detection of sleep apnea with wearable watch device
- PMID: 33166293
- PMCID: PMC7652322
- DOI: 10.1371/journal.pone.0237279
Quantitative detection of sleep apnea with wearable watch device
Abstract
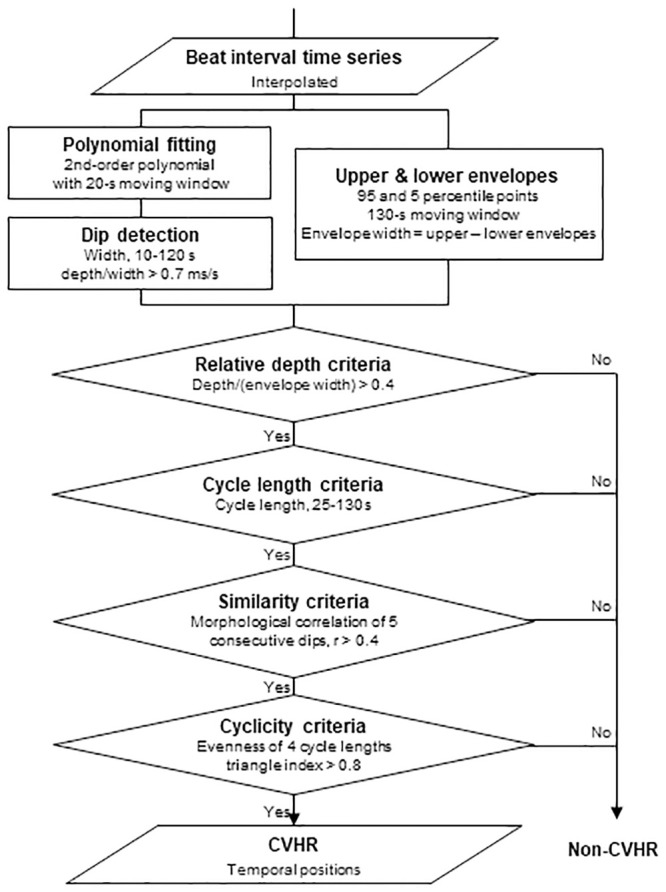
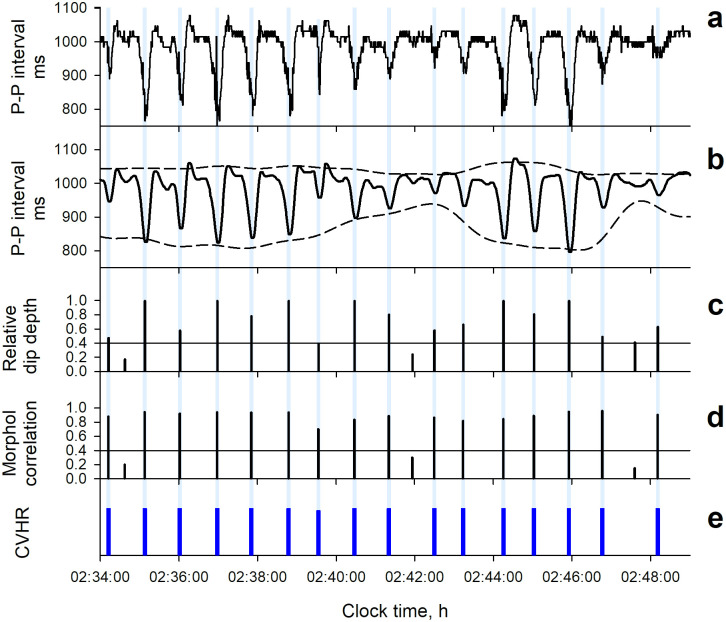
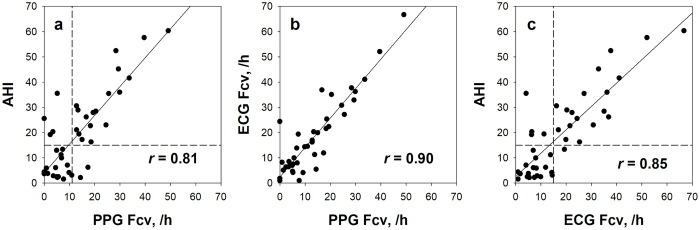
The spread of wearable watch devices with photoplethysmography (PPG) sensors has made it possible to use continuous pulse wave data during daily life. We examined if PPG pulse wave data can be used to detect sleep apnea, a common but underdiagnosed health problem associated with impaired quality of life and increased cardiovascular risk. In 41 patients undergoing diagnostic polysomnography (PSG) for sleep apnea, PPG was recorded simultaneously with a wearable watch device. The pulse interval data were analyzed by an automated algorithm called auto-correlated wave detection with adaptive threshold (ACAT) which was developed for electrocardiogram (ECG) to detect the cyclic variation of heart rate (CVHR), a characteristic heart rate pattern accompanying sleep apnea episodes. The median (IQR) apnea-hypopnea index (AHI) was 17.2 (4.4-28.4) and 22 (54%) subjects had AHI ≥15. The hourly frequency of CVHR (Fcv) detected by the ACAT algorithm closely correlated with AHI (r = 0.81), while none of the time-domain, frequency-domain, or non-linear indices of pulse interval variability showed significant correlation. The Fcv was greater in subjects with AHI ≥15 (19.6 ± 12.3 /h) than in those with AHI <15 (6.4 ± 4.6 /h), and was able to discriminate them with 82% sensitivity, 89% specificity, and 85% accuracy. The classification performance was comparable to that obtained when the ACAT algorithm was applied to ECG R-R intervals during the PSG. The analysis of wearable watch PPG by the ACAT algorithm could be used for the quantitative screening of sleep apnea.
Conflict of interest statement
This study was partly funded by WINFrontier Co., Ltd., and the company provided support in the form of salaries for two of the authors (M.K. and K.I.). This does not alter our adherence to PLOS ONE policies on sharing data. The materials, equipment, software, consumables, and systems used in this study do not include the products or services of this company. None of the other authors has any competing interests to declare.
Figures

References
-
- Somers VK, White DP, Amin R, Abraham WT, Costa F, et al. (2008) Sleep apnea and cardiovascular disease: an American Heart Association/American College Of Cardiology Foundation Scientific Statement from the American Heart Association Council for High Blood Pressure Research Professional Education Committee, Council on Clinical Cardiology, Stroke Council, and Council On Cardiovascular Nursing. In collaboration with the National Heart, Lung, and Blood Institute National Center on Sleep Disorders Research (National Institutes of Health). Circulation 118: 1080–1111. 10.1161/CIRCULATIONAHA.107.189375 - DOI - PubMed
Publication types
MeSH terms
LinkOut - more resources
Full Text Sources
Medical
