. 2021 May 1;203(9):1099-1111.
doi: 10.1164/rccm.202005-1596OC.

Episodic Aspiration with Oral Commensals Induces a MyD88-dependent, Pulmonary T-Helper Cell Type 17 Response that Mitigates Susceptibility to Streptococcus pneumoniae

Affiliations

Episodic Aspiration with Oral Commensals Induces a MyD88-dependent, Pulmonary T-Helper Cell Type 17 Response that Mitigates Susceptibility to Streptococcus pneumoniae

Benjamin G Wu et al. Am J Respir Crit Care Med. .

Abstract

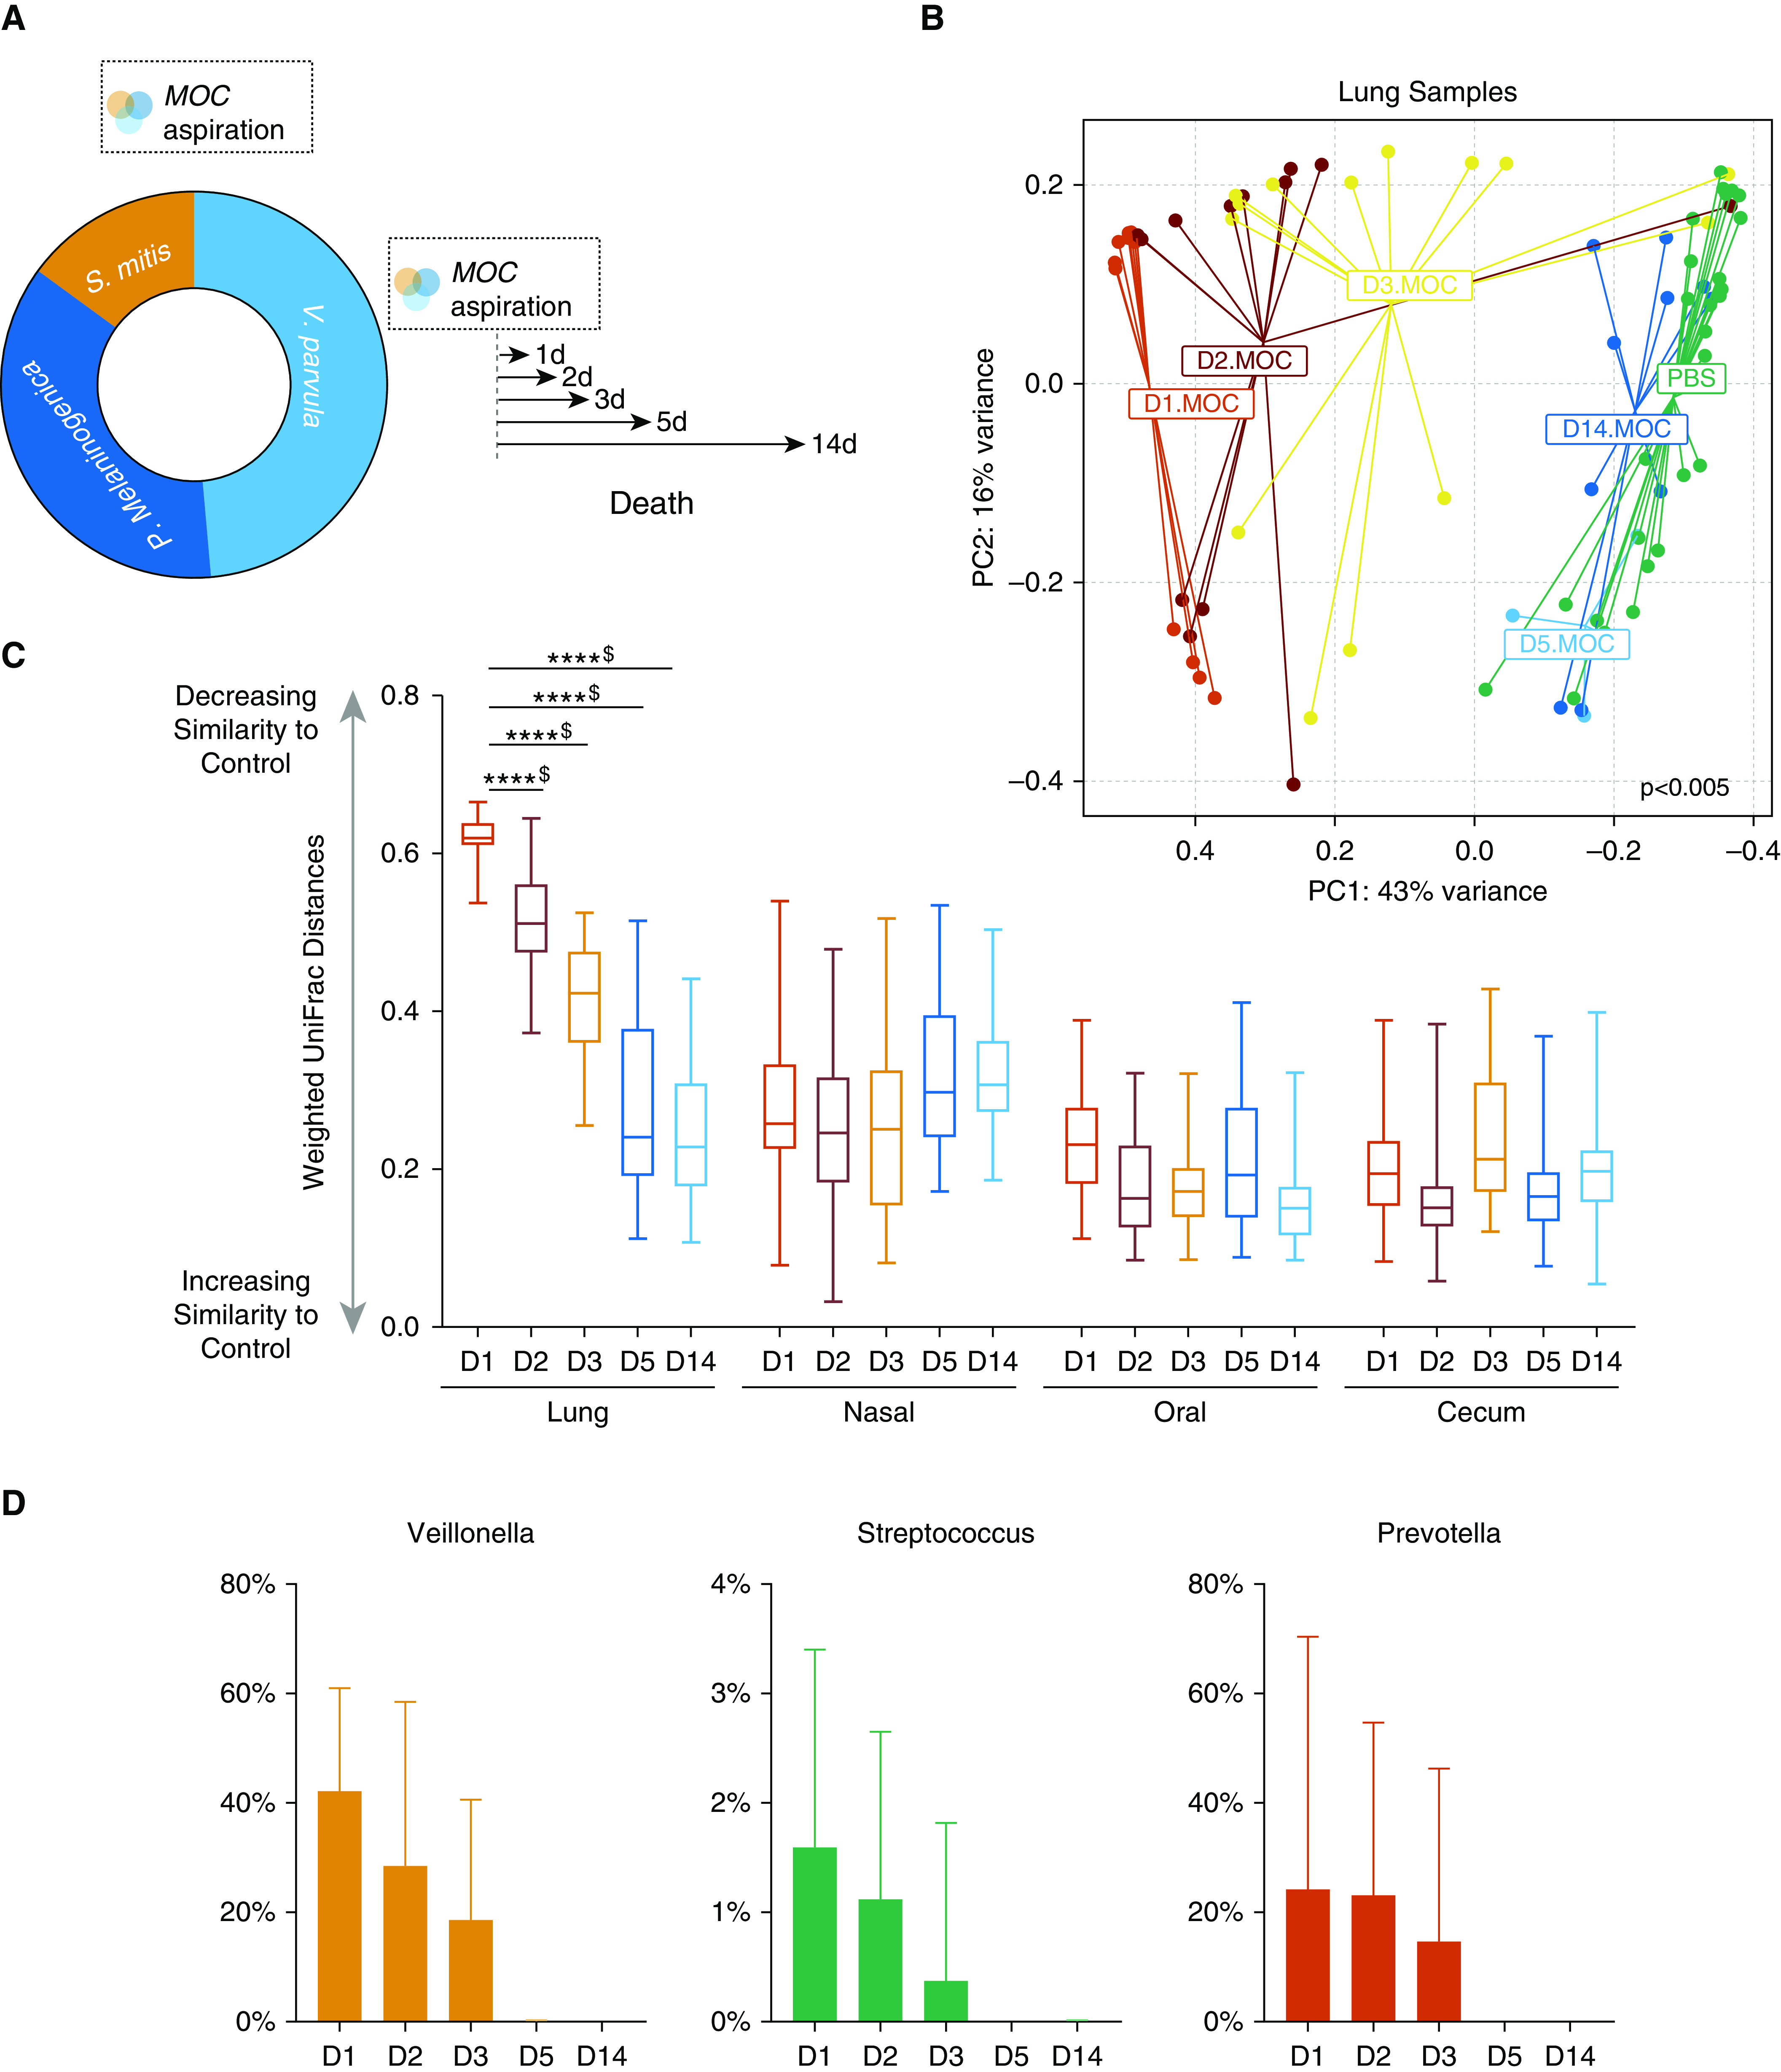
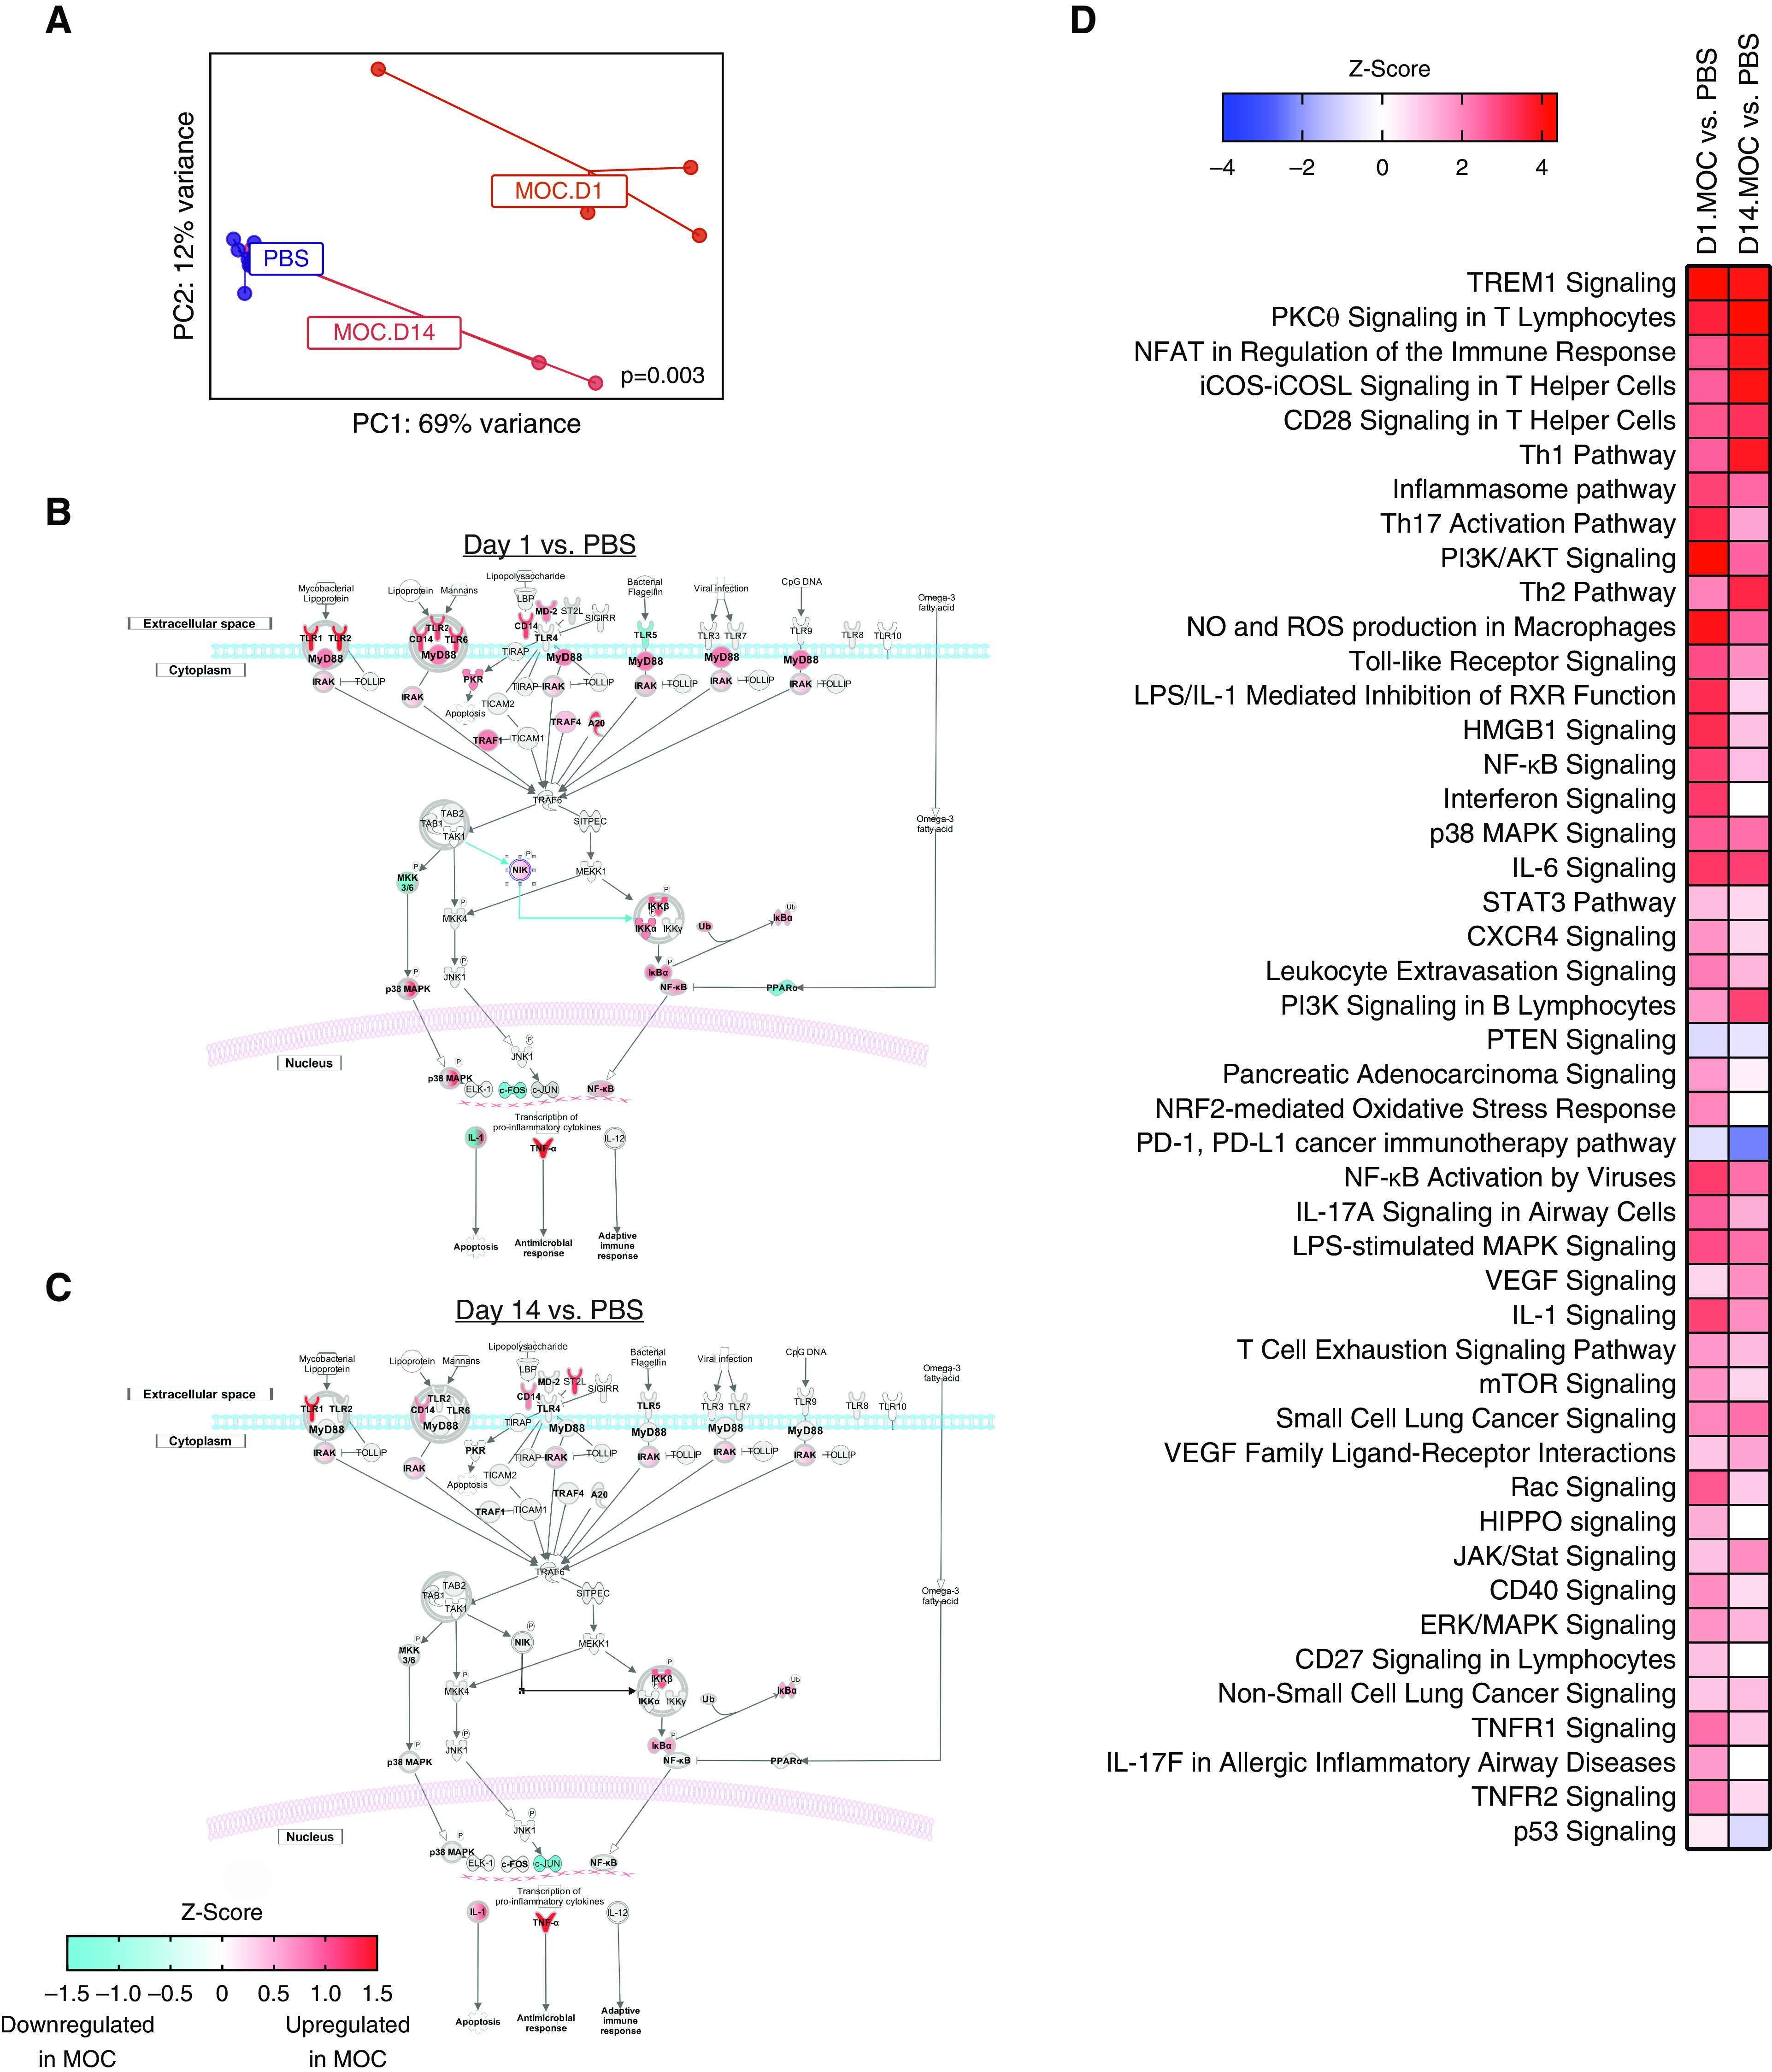
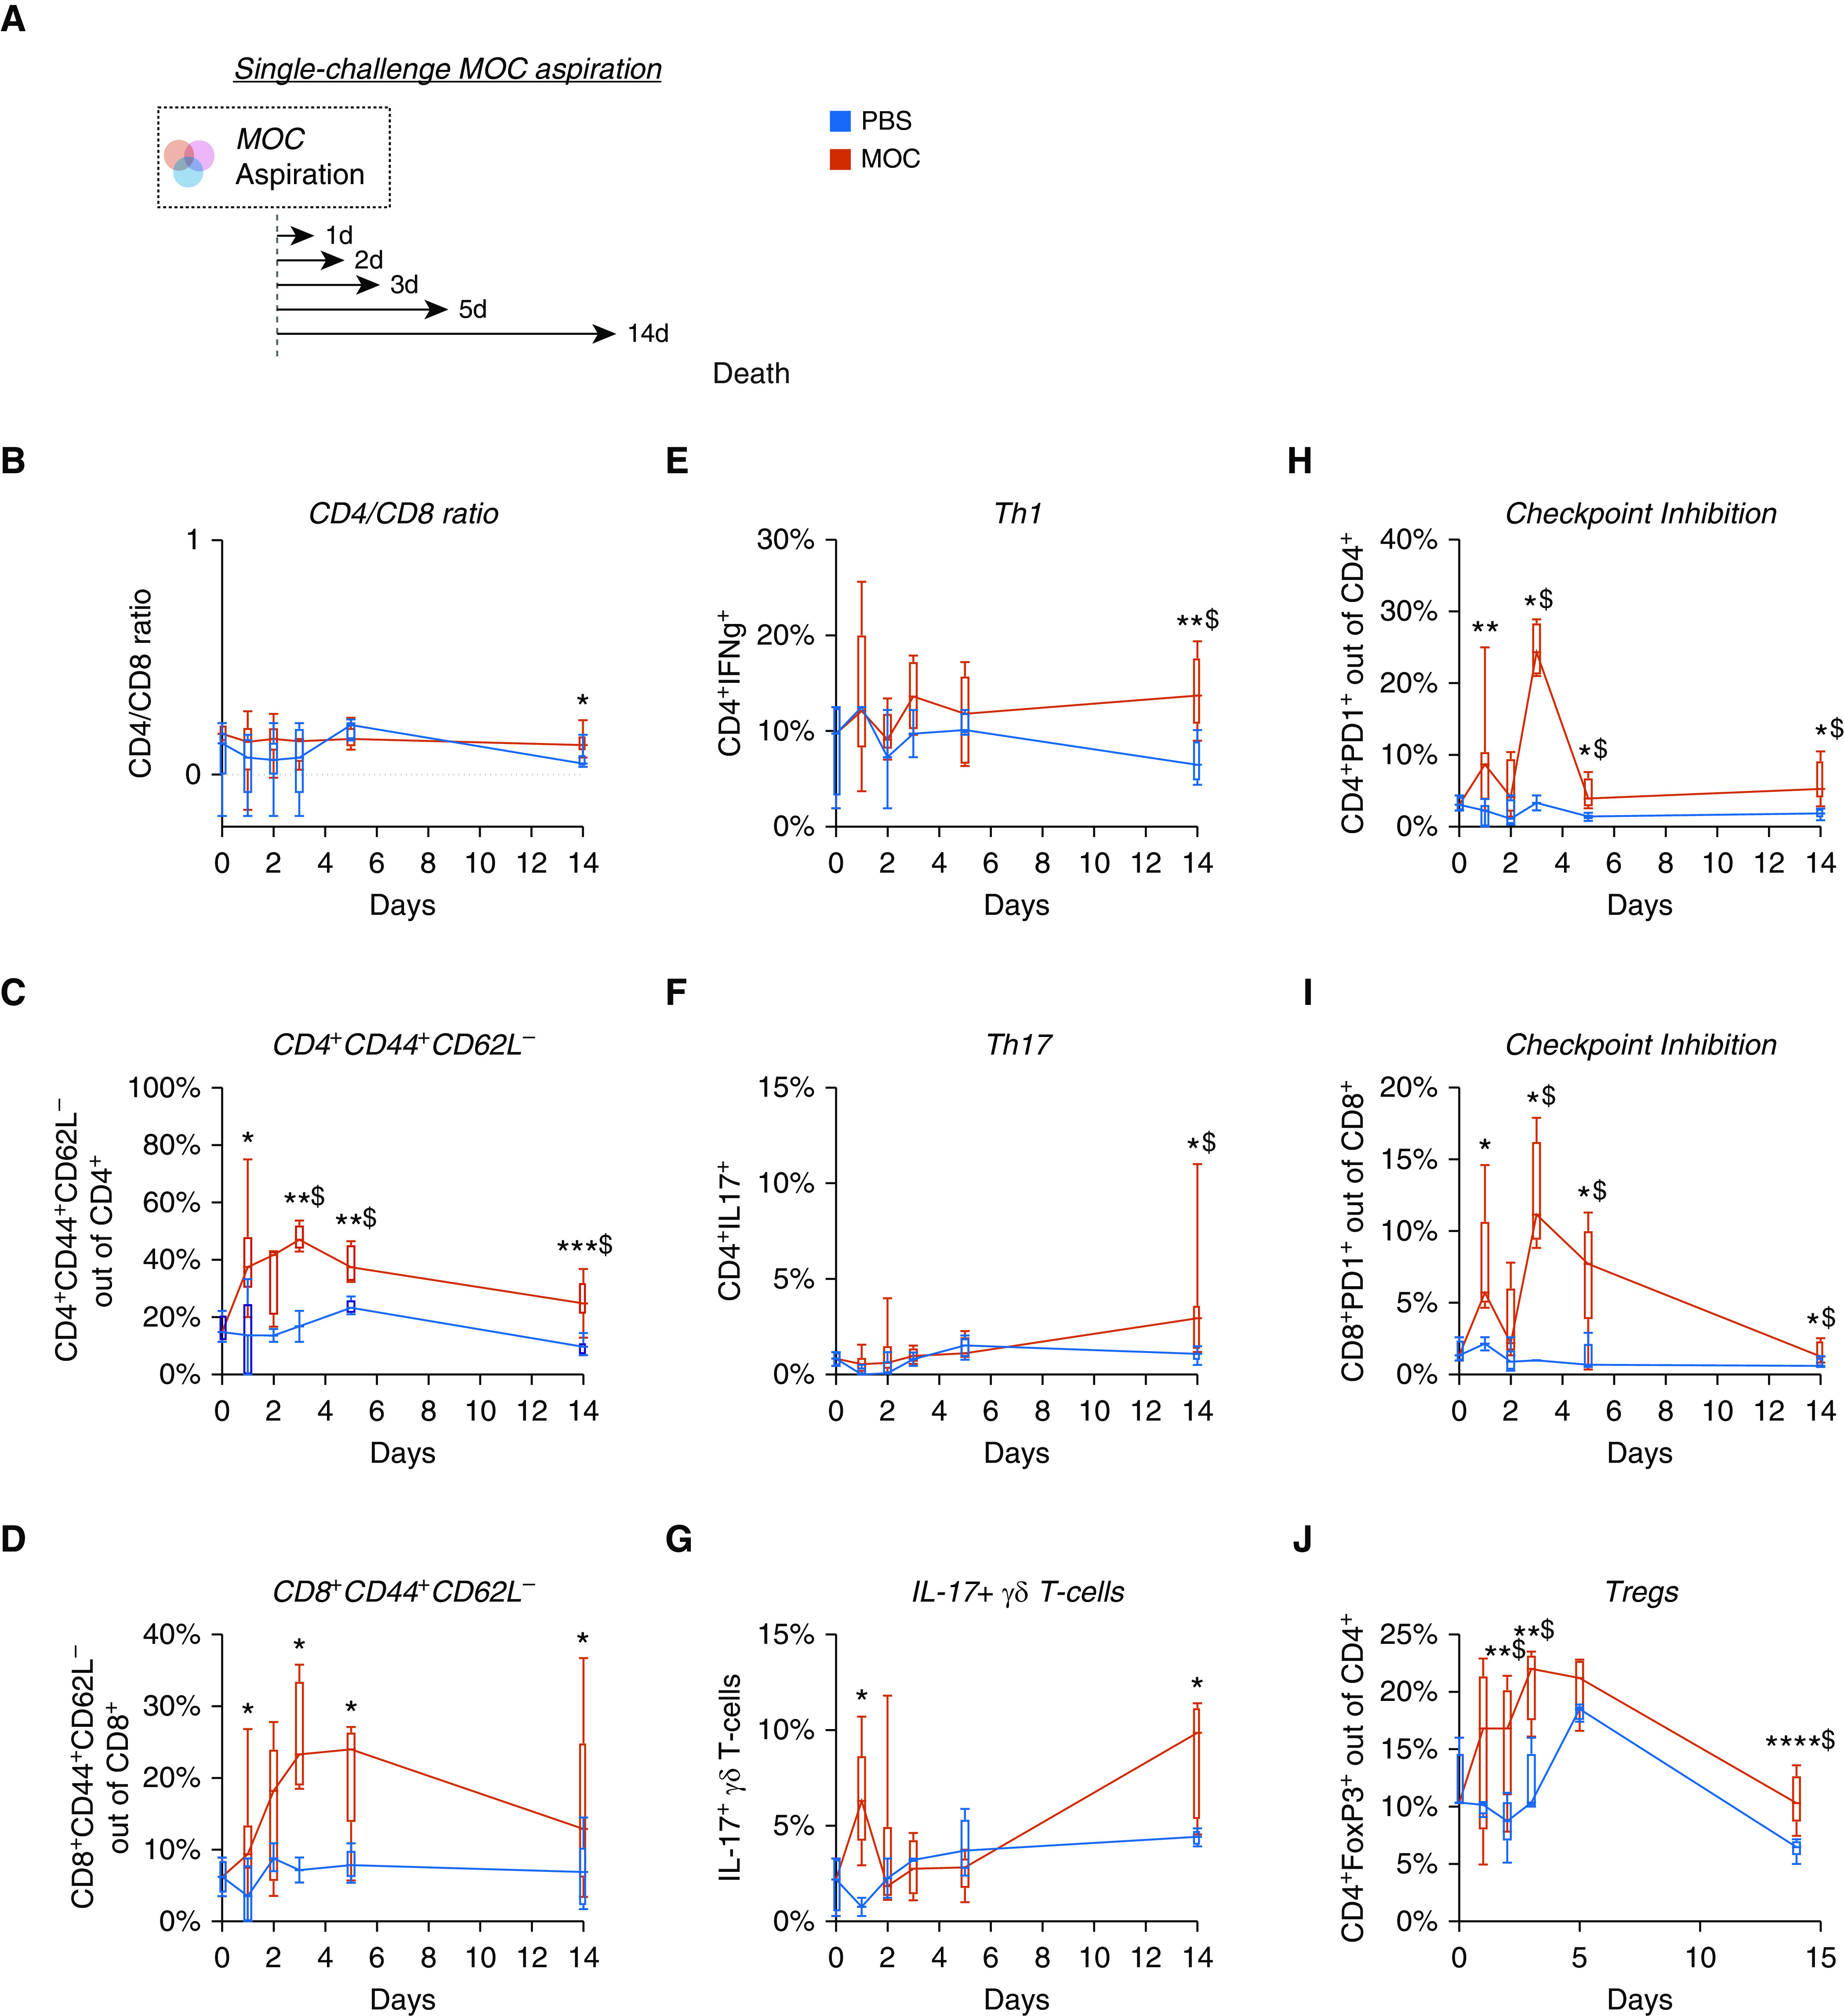
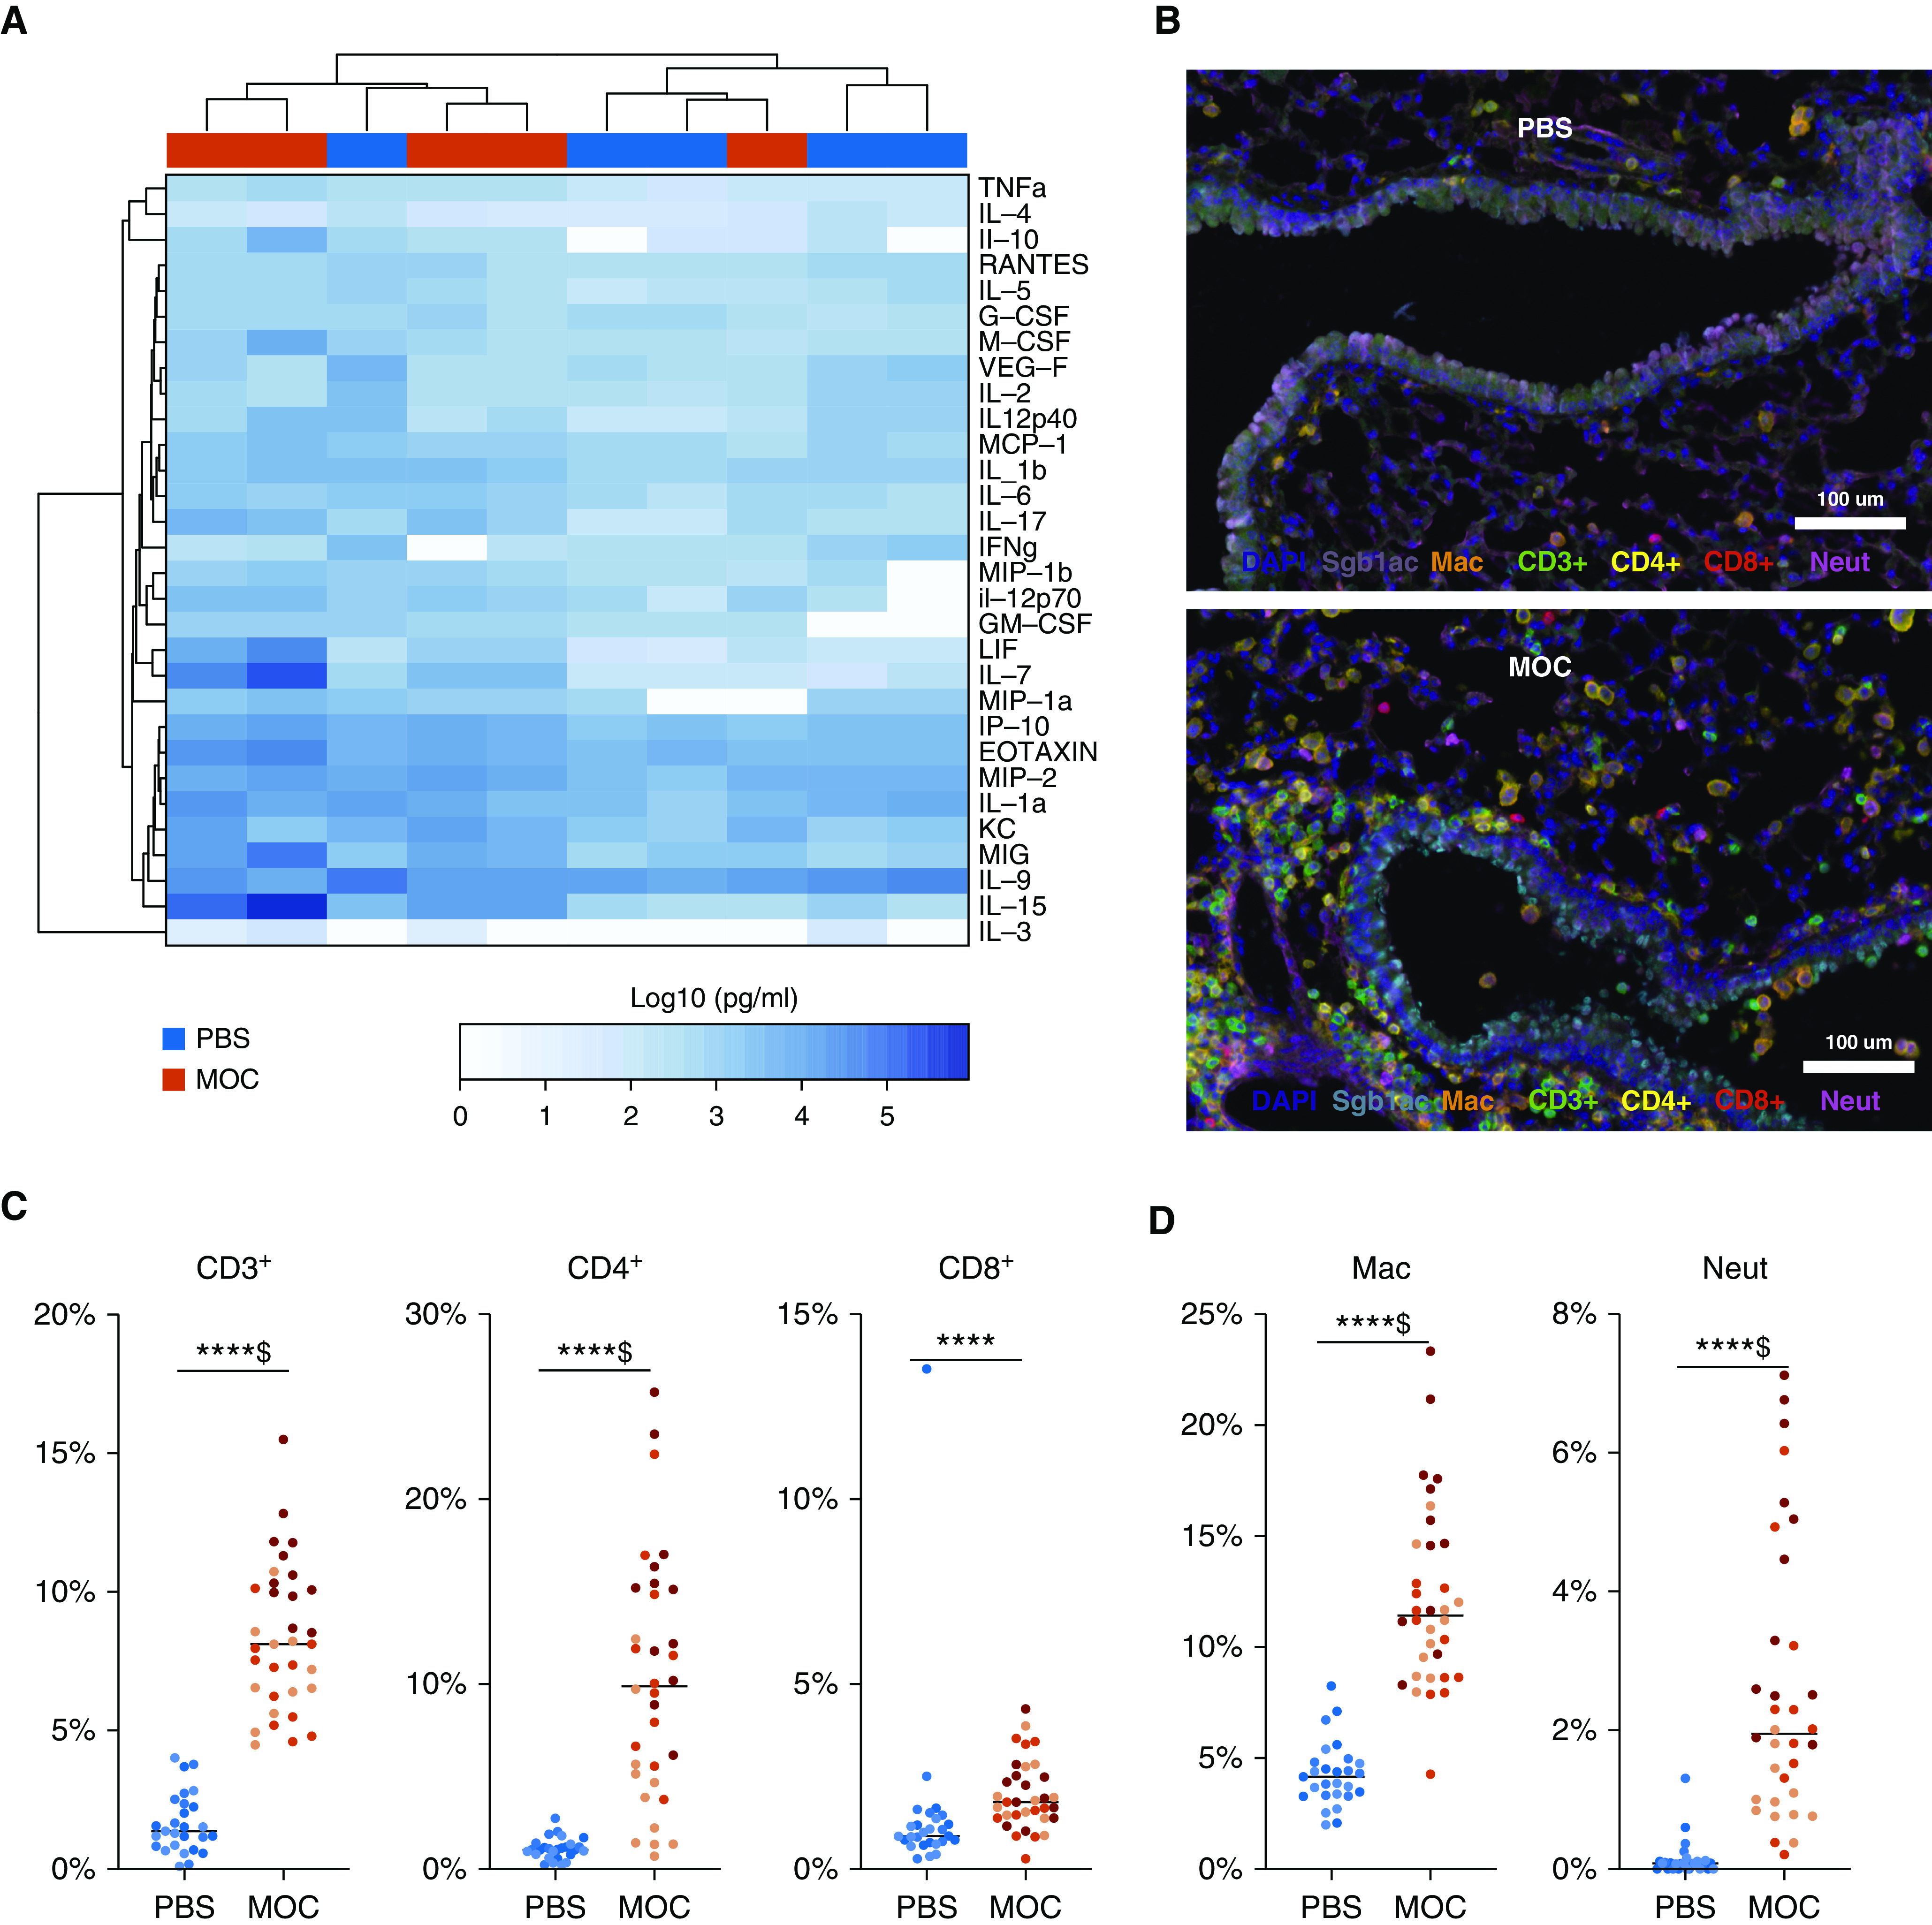
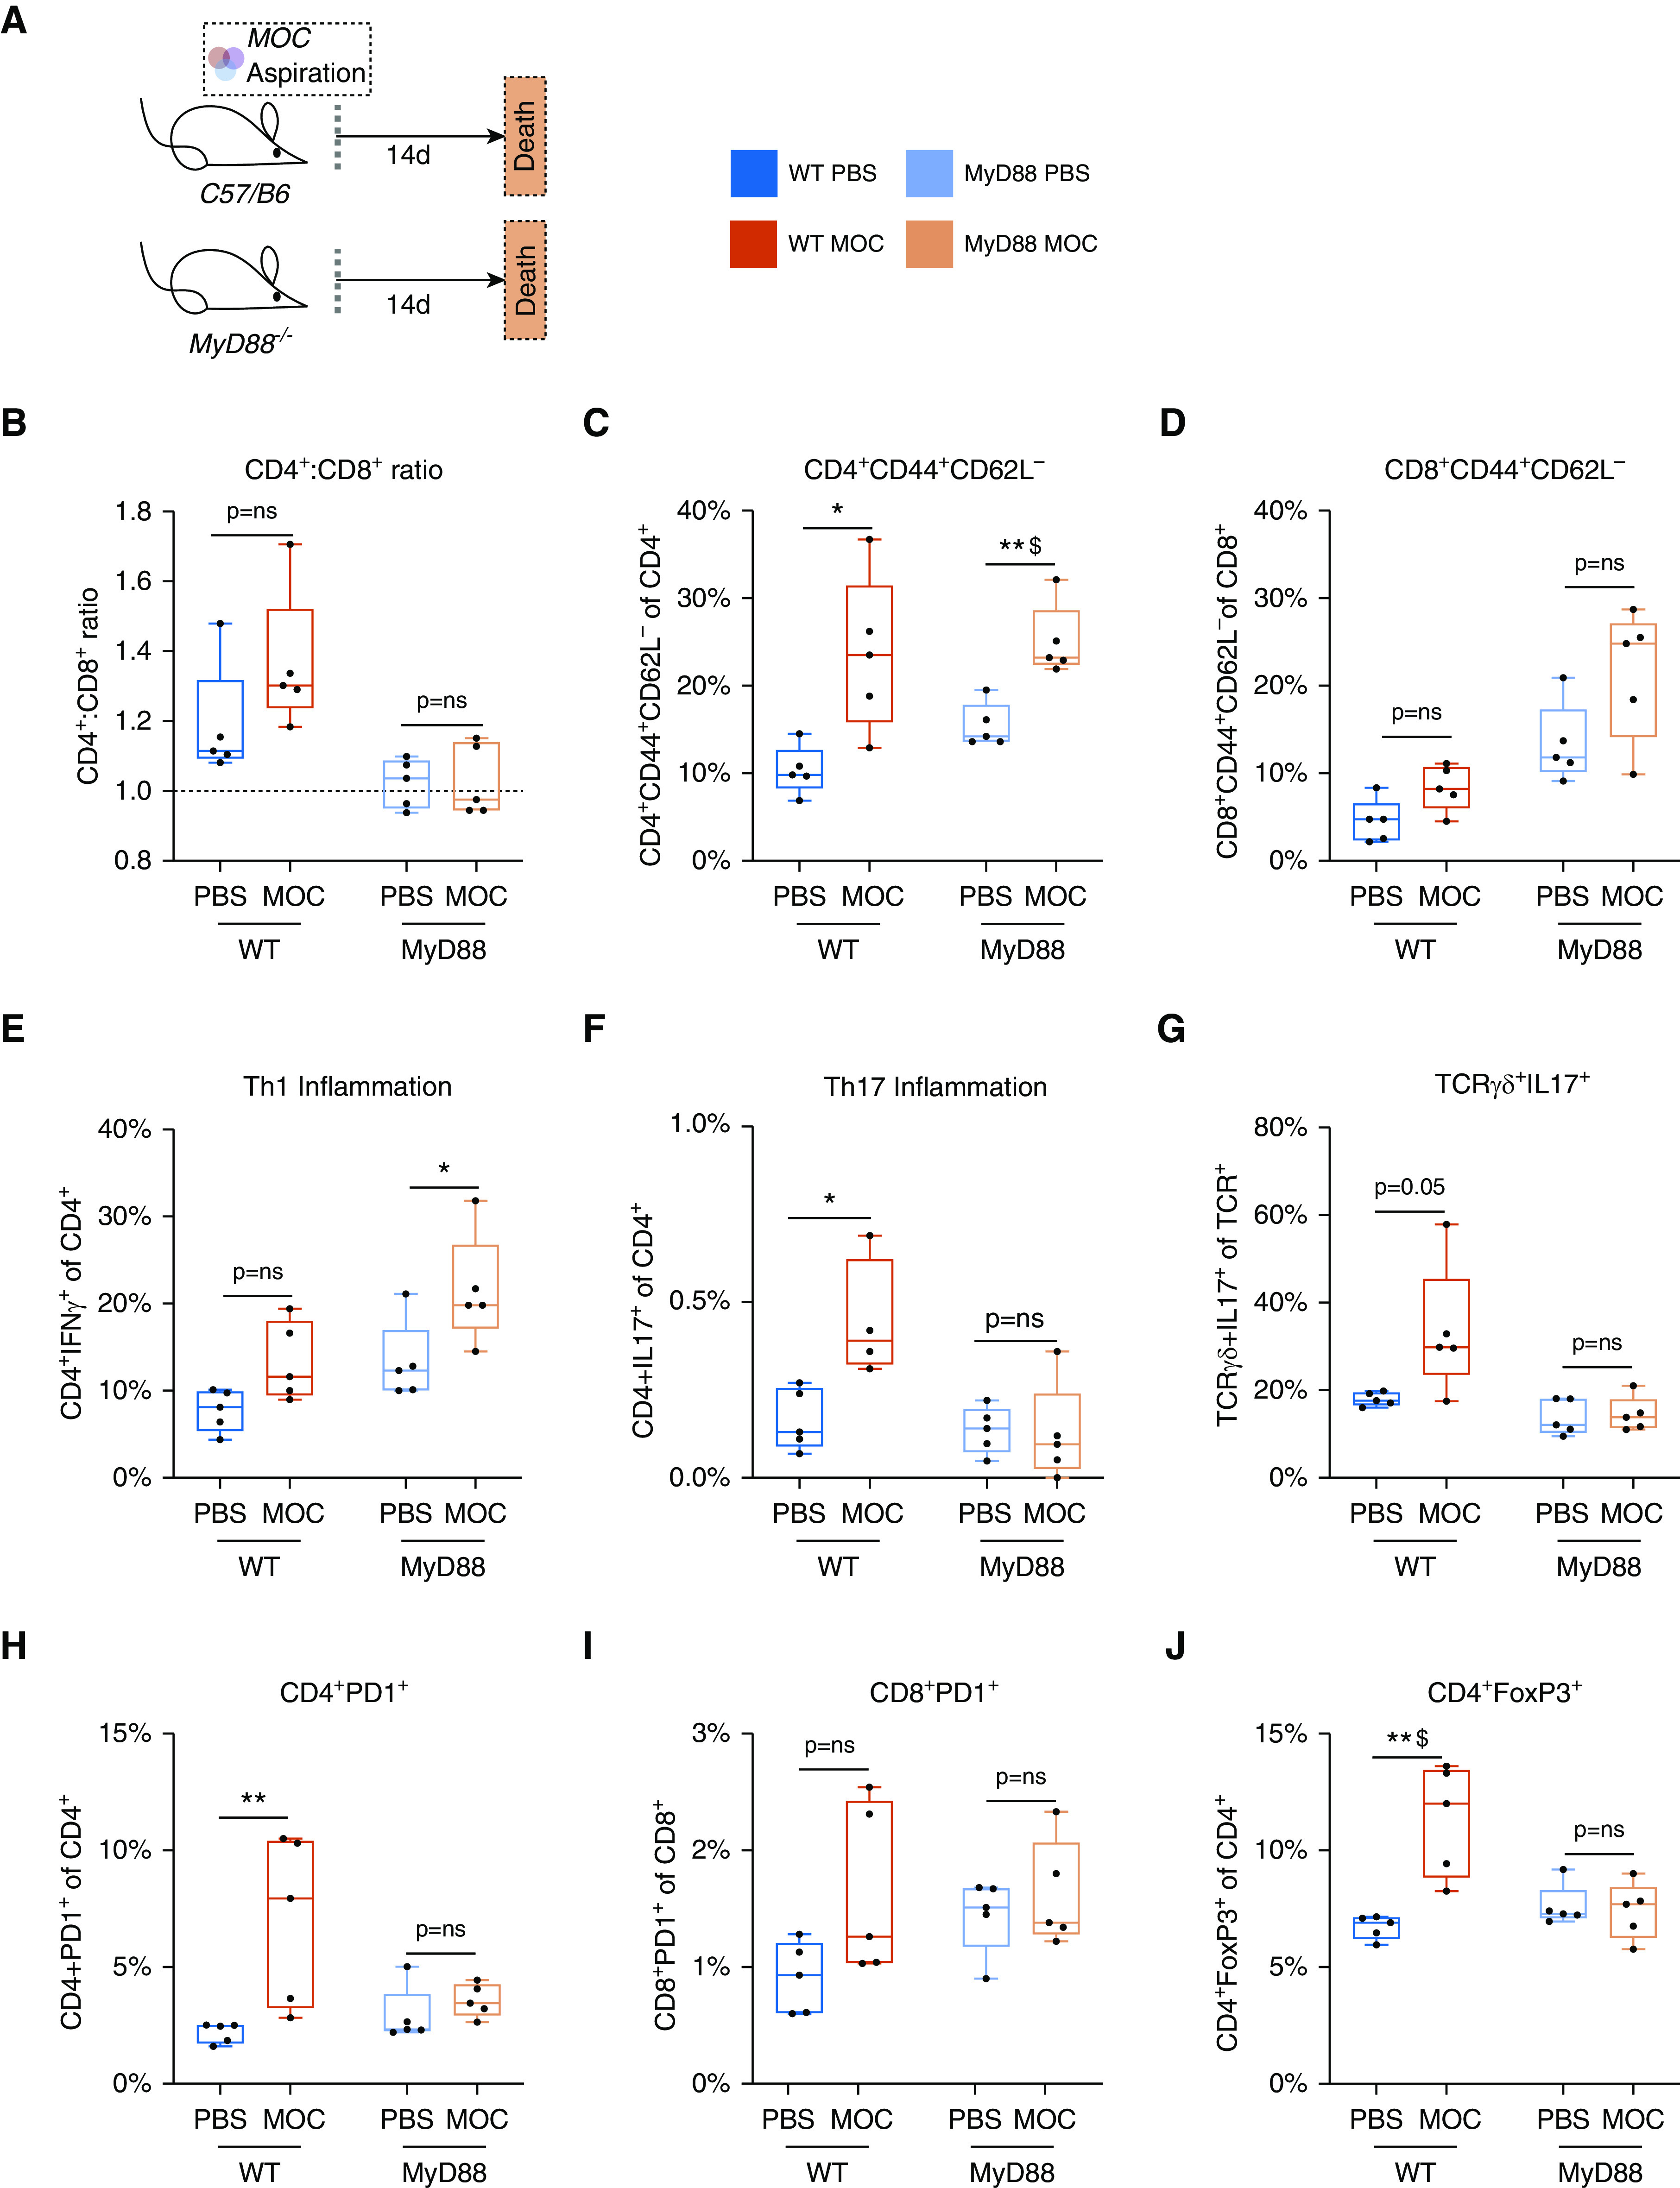
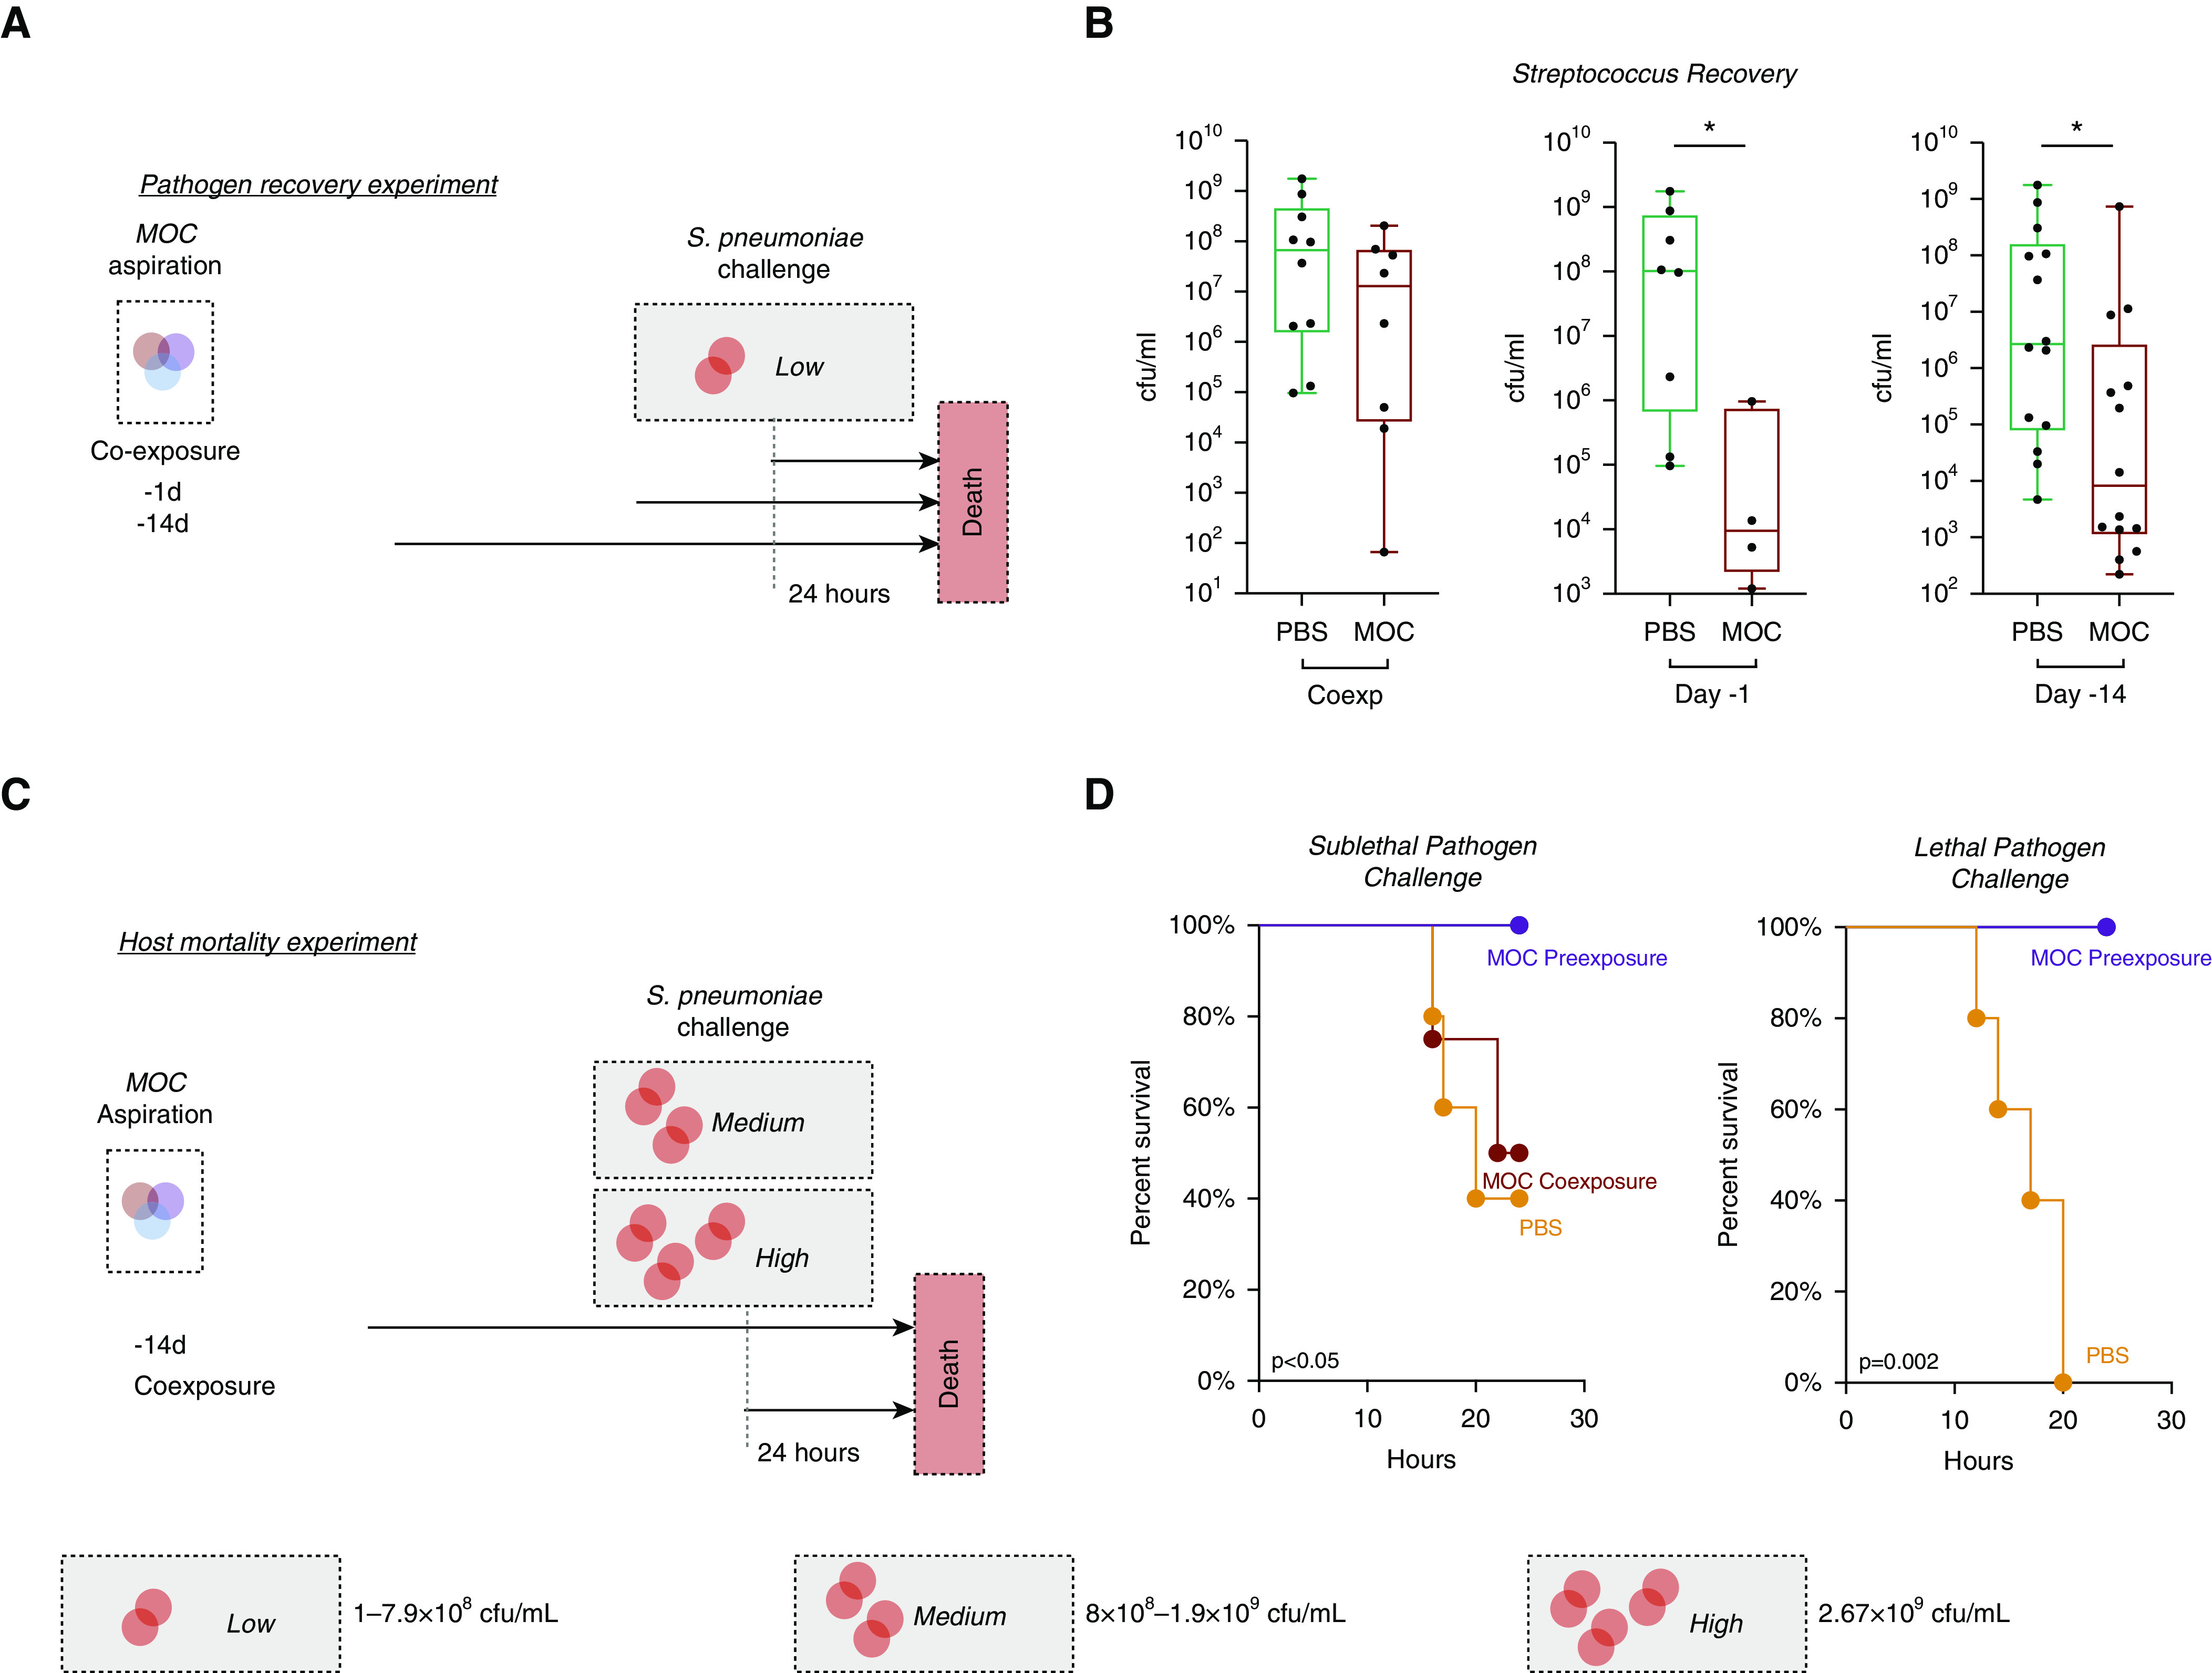
Rationale: Cross-sectional human data suggest that enrichment of oral anaerobic bacteria in the lung is associated with an increased T-helper cell type 17 (Th17) inflammatory phenotype.Objectives: In this study, we evaluated the microbial and host immune-response dynamics after aspiration with oral commensals using a preclinical mouse model.Methods: Aspiration with a mixture of human oral commensals (MOC; Prevotella melaninogenica, Veillonella parvula, and Streptococcus mitis) was modeled in mice followed by variable time of killing. The genetic backgrounds of mice included wild-type, MyD88-knockout, and STAT3C backgrounds.Measurements and Main Results: 16S-rRNA gene sequencing characterized changes in microbiota. Flow cytometry, cytokine measurement via Luminex and RNA host-transcriptome sequencing was used to characterize the host immune phenotype. Although MOC aspiration correlated with lower-airway dysbiosis that resolved within 5 days, it induced an extended inflammatory response associated with IL-17-producing T cells lasting at least 14 days. MyD88 expression was required for the IL-17 response to MOC aspiration, but not for T-cell activation or IFN-γ expression. MOC aspiration before a respiratory challenge with S. pneumoniae led to a decrease in hosts' susceptibility to this pathogen.Conclusions: Thus, in otherwise healthy mice, a single aspiration event with oral commensals is rapidly cleared from the lower airways but induces a prolonged Th17 response that secondarily decreases susceptibility to S. pneumoniae. Translationally, these data implicate an immunoprotective role of episodic microaspiration of oral microbes in the regulation of the lung immune phenotype and mitigation of host susceptibility to infection with lower-airway pathogens.

Keywords: inflammation; microbiome; pathogen susceptibility; transcriptomics.


Figures

Figure 1.
Figure 1.
Lower-airway aspiration with human oral commensals leads to transient lower-airway dysbiosis. (A) Schematic experiment design of aspiration with a mixture of human oral commensals (MOC). Mice exposed to MOC challenge and subsequent killing on Day 1 (D1) (n = 12), D2 (n = 13), D3 (n = 14), D5 (n = 5), and D14 (n = 4) and mice exposed to phosphate-buffered saline (PBS) (n = 29). (B) PC analysis plot showing β diversity based on weighted unique fraction distance on lung samples. Differential clustering occurs early on after exposure to MOC versus PBS (permutational multivariate ANOVA P < 0.001). By D5, all of the samples exposed to MOC overlapped with PBS samples (PBS = dark green cluster, D5 = blue cluster, and D14 = light blue cluster). (C) Dissimilarity between MOC aspiration versus PBS samples by mucosal surface (****P < 0.0001 and $Q < 0.05 for all comparisons). Box and whisker plots demonstrate median (interquartile range) with whiskers set at minimum to maximum. (D) Relative abundance levels of S., V., and P. by day, with significant clearance over time and disappearance by D5 (P < 0.01 for all comparisons). D1 = Day 1 after MOC aspiration; D2 = Day 2 after MOC aspiration; D3 = Day 3 after MOC aspiration; D5 = Day 5 after MOC aspiration; D14 = Day 14 after MOC aspiration; P. = Prevotella; PC = principal coordinate; S. = Streptococcus; V. = Veillonella.
Figure 2.
Figure 2.
Differential gene expression demonstrates inflammation up to 14 days after aspiration with a mixture of human oral commensals (MOC). (A) PC analysis of gene expression based on the Bray-Curtis dissimilarity index (permutational multivariate ANOVA P = 0.003). (B and C) Ingenuity pathway analysis network analysis for transcriptomic changes after MOC aspiration on Day 1 (D1) and D14, respectively. (D) Ingenuity pathway analysis on differentially expressed genes between MOC versus PBS for D1 and D14 (false discovery rate < 0.1). NK = natural killer cell; P = phosphorylation/dephosphorylation; PBS = phosphate-buffered saline; PC = principal coordinate; ROS = reactive oxygen species; Th = T-helper cell; Ub = Ubiquitination.
Figure 3.
Figure 3.
Lower-airway aspiration with oral commensals leads to a prolonged inflammatory response. (A) Schematic experimental design with killing on Days 1 (n = 5), 2 (n = 5), 3 (n = 5), 5 (n = 5), and 14 (n = 5). (BJ) Values for CD4/CD8 ratio, activation of T cells (CD4+CD44+CD62L and CD8+CD44+CD62L), T-helper cell type 1 (Th1) cells, Th17 cells, IL-17+ γδ T cells, checkpoint-inhibited T cells (CD4+PD1+ and CD8+PD1+), and Tregs over 14 days after MOC aspiration as compared with PBS control animals. *P < 0.05, **P < 0.01, ***P < 0.001, ****P < 0.0001, and $Q < 0.05. Box and whisker plots demonstrate median (interquartile range) with minimum to maximum values. MOC = mixture of human oral commensals; PBS = phosphate-buffered saline; Treg = regulatory T cell.
Figure 4.
Figure 4.
Histological changes after aspiration with a mixture of human oral commensals (MOC). (A) Heatmap for cytokine measurements on lung homogenates using Luminex with unsupervised hierarchical clustering (based on Bray-Curtis dissimilarity index). MOC aspiration was associated with greater levels of IL-17 (P = 0.007). (B) Histological evaluation on low-power multispectral immunohistochemistry from Vectral Imaging with immune histochemistry staining for Mac (F4/80), CD3+, Neut (myeloperoxidase), club cells (CC10), CD4+, and CD8+ between MOC aspiration and phosphate-buffered saline (PBS) at Day 14. (C) Comparison of quantification of the cells per multispectral immunohistochemistry between MOC aspiration and PBS at Day 14. N = 3 for each condition; each dot represents different fields analyzed; lines represent the median value for each group. (D) Comparisons of macrophage and neutrophil percentages between MOC aspiration and PBS at Day 14. N = 3 for each condition; each dot represents different fields analyzed. ****P < 0.0001 and $Q < 0.05. Mac = macrophages; Neut = neutrophils.
Figure 5.
Figure 5.
MyD88 adaptor protein is necessary for lung recruitment of IL-17 inflammation and markers of exhaustion but is not necessary for activation and T-helper cell type 1 (Th1) inflammation after aspiration with a mixture of human oral commensals (MOC). (A) Schematic experimental design with killing at Day 14 after MOC/phosphate-buffered saline (PBS) exposure in both WT (PBS n = 5, MOC n = 5) and MyD88KO (PBS n = 5, MOC n = 5) mice. (BJ) Values for CD4/CD8 ratio, activation T cells (CD4+CD44+CD62L and CD8+CD44+CD62L), Th1 cells, Th17 cells, IL-17+ γδ T cells, checkpoint-inhibited T cells (CD4+PD1+ and CD8+PD1+), and Tregs at 14 days after MOC aspiration as compared with PBS. *P < 0.05, **P < 0.01, and $Q < 0.05. Box and whisker plots demonstrate median (interquartile range) with minimum to maximum values. ns = not significant; TCR = T-cell receptor; Treg = regulatory T cell; WT = wild type.
Figure 6.
Figure 6.
Modulation of host susceptibility to Streptococcus pneumoniae after aspiration with a mixture of human oral commensals (MOC). (A) Schematic of experiment with MOC exposure and pathogen challenge with low dose of S. pneumoniae. (B) Recovery of S. pneumoniae at 24 hours after pathogen challenge. Box and whisker plots demonstrate median (interquartile range) with minimum to maximum values. *P < 0.05. (C) Schematic of experiment with MOC exposure and pathogen challenge with a medium (6.5 × 108 cfu/ml) and high dose (2.67 × 109 cfu/ml) of S. pneumoniae (phosphate-buffered saline [PBS] n = 5, MOC coexposure n = 5, and MOC preexposure n = 5). (D) Survival curves of mice after pathogen challenge (P value based on Mantel-Cox; PBS n = 5, MOC preexposure n = 5). Coexp = coexposure.

Comment in

References

    1. Bassis CM, Erb-Downward JR, Dickson RP, Freeman CM, Schmidt TM, Young VB, et al. Analysis of the upper respiratory tract microbiotas as the source of the lung and gastric microbiotas in healthy individuals. mBio. 2015;6:e00037. - PMC - PubMed
    1. Dickson RP, Erb-Downward JR, Freeman CM, McCloskey L, Falkowski NR, Huffnagle GB, et al. Bacterial topography of the healthy human lower respiratory tract. mBio. 2017;8:e02287-16. - PMC - PubMed
    1. Segal LN, Alekseyenko AV, Clemente JC, Kulkarni R, Wu B, Gao Z, et al. Enrichment of lung microbiome with supraglottic taxa is associated with increased pulmonary inflammation Microbiome 2013119[Published erratum appears in Microbiome 2:21.] - PMC - PubMed
    1. Huang YJ, Nariya S, Harris JM, Lynch SV, Choy DF, Arron JR, et al. The airway microbiome in patients with severe asthma: associations with disease features and severity. J Allergy Clin Immunol. 2015;136:874–884. - PMC - PubMed
    1. Huang YJ, Nelson CE, Brodie EL, Desantis TZ, Baek MS, Liu J, et al. NHLBI’s Asthma Clinical Research Network. Airway microbiota and bronchial hyperresponsiveness in patients with suboptimally controlled asthma. J Allergy Clin Immunol. 2011;127:372–381, e1–e3. - PMC - PubMed

Publication types

Substances

Supplementary concepts