. 2021 Jan;589(7843):603-607.
doi: 10.1038/s41586-020-2943-z. Epub 2020 Nov 9.

COVID-19 treatments and pathogenesis including anosmia in K18-hACE2 mice

Affiliations

COVID-19 treatments and pathogenesis including anosmia in K18-hACE2 mice

Jian Zheng et al. Nature. 2021 Jan.

Abstract

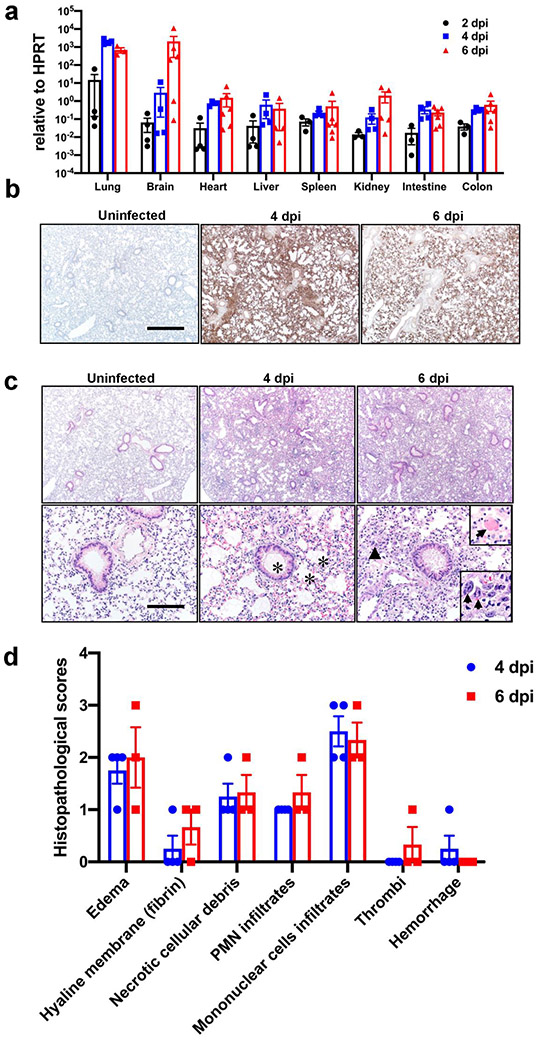
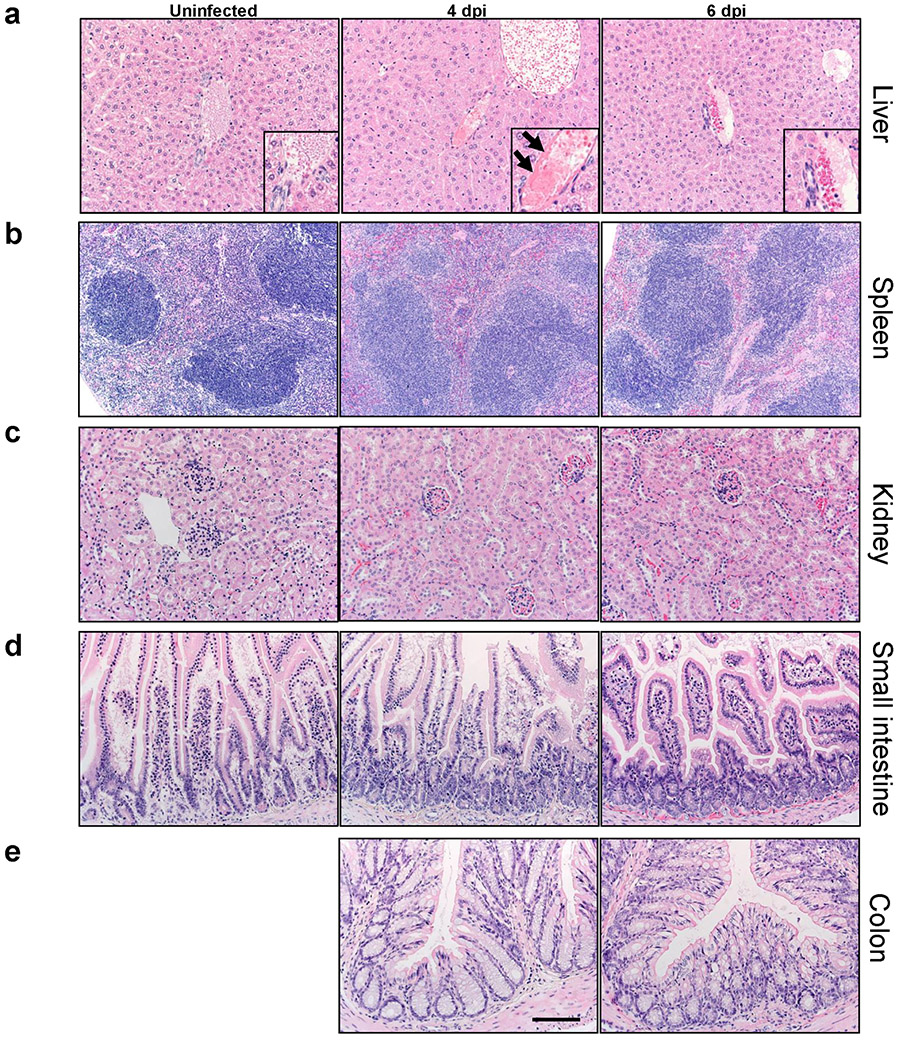
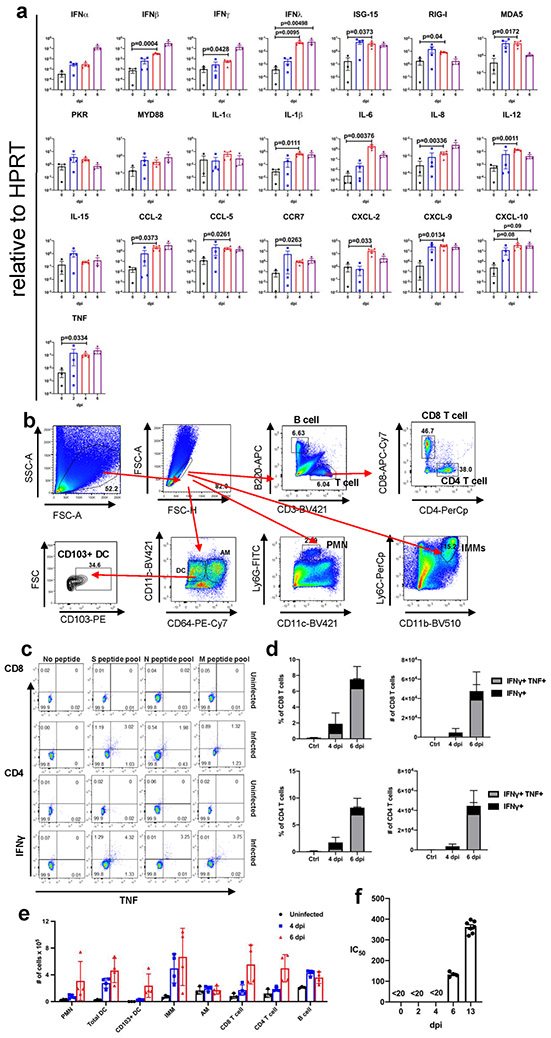
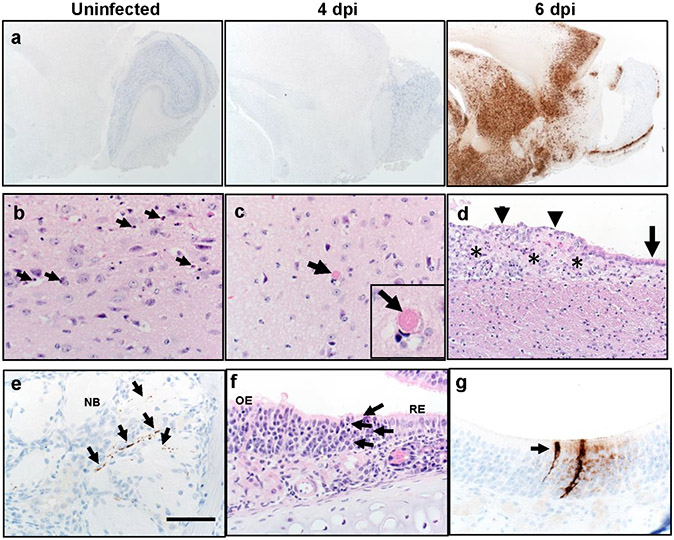
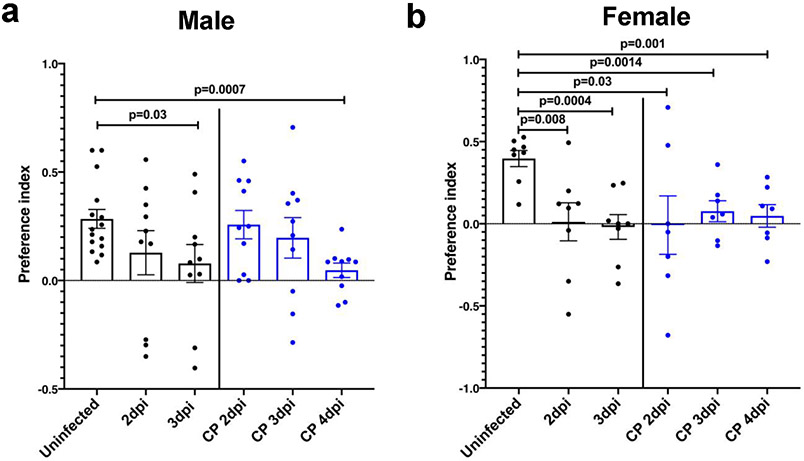
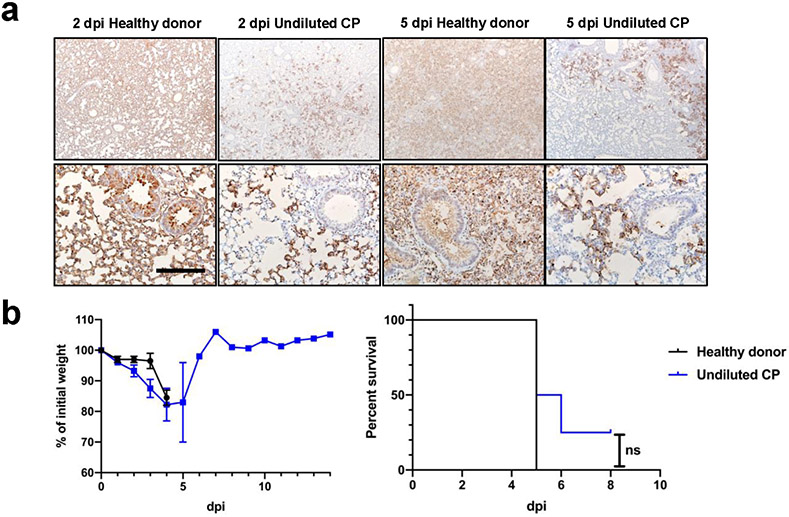
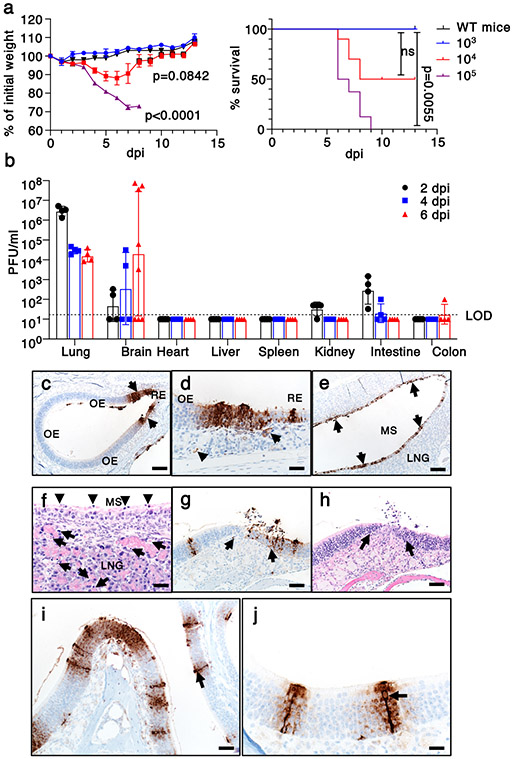
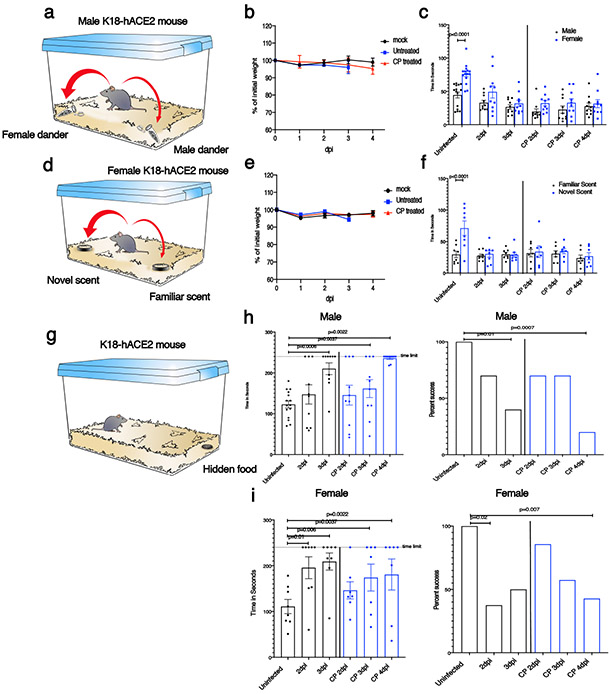
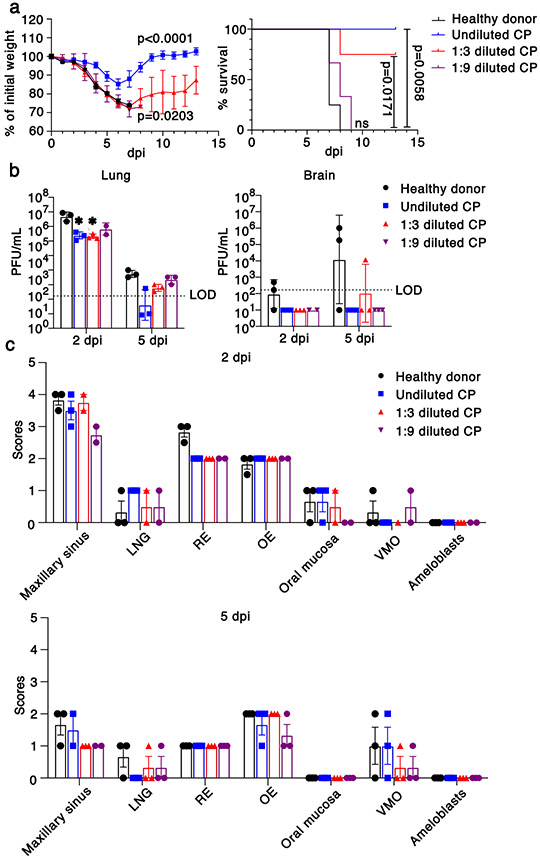
The ongoing coronavirus disease 2019 (COVID-19) pandemic is associated with substantial morbidity and mortality. Although much has been learned in the first few months of the pandemic, many features of COVID-19 pathogenesis remain to be determined. For example, anosmia is a common presentation, and many patients with anosmia show no or only minor respiratory symptoms1. Studies in animals infected experimentally with severe acute respiratory syndrome coronavirus 2 (SARS-CoV-2), the cause of COVID-19, provide opportunities to study aspects of the disease that are not easily investigated in human patients. Although the severity of COVID-19 ranges from asymptomatic to lethal2, most experimental infections provide insights into mild disease3. Here, using K18-hACE2 transgenic mice that were originally developed for SARS studies4, we show that infection with SARS-CoV-2 causes severe disease in the lung and, in some mice, the brain. Evidence of thrombosis and vasculitis was detected in mice with severe pneumonia. Furthermore, we show that infusion of convalescent plasma from a recovered patient with COVID-19 protected against lethal disease. Mice developed anosmia at early time points after infection. Notably, although pre-treatment with convalescent plasma prevented most signs of clinical disease, it did not prevent anosmia. Thus, K18-hACE2 mice provide a useful model for studying the pathological basis of both mild and lethal COVID-19 and for assessing therapeutic interventions.


Figures

Extended Data Fig. 1.
Extended Data Fig. 1.. Clinical and pathological disease in SARS-CoV-2-infected K18-hACE2 mice.
Mice were infected intranasally with 105 PFU SARS-CoV-2. a. Viral RNA detected by qPCR targeting viral N gene with normalization to HPRT for the indicated organs at 2, 4, and 6 dpi (103, n=4; 104, n=4; 105, n=6, each organ was collected from an individual mouse). b. Lungs from uninfected (n=3), and infected (day 4 (n=4) and day 6 (n=3) p.i.) mice were immunostained to detect SARS-CoV-2 N protein. Bar = 701 μm. c. Infected lungs exhibited evidence of airway edema (asterisks, bottom middle panel), alveolar hyaline membranes, vascular thrombosis (upper inset and arrow, bottom right panel), dying cells with pyknotic to karyorrhectic nuclei, and proliferative alveolar epithelium (arrowhead and lower inset, bottom right panel, arrows) Bar = 701 and 70 μm (top and bottom, respectively), H&E stain. d. Summary of lung lesion scoring, as described in Methods (uninfected, n=3; day 4, n=4; day 6, n=3, each brain was collected from an individual mouse). Two sections of each lung from 3-4 mice per group were evaluated. These data are representative of 3 independent experiments. (a, d). Data are shown as mean±SEM.
Extended Data Fig. 2.
Extended Data Fig. 2.. Histological analysis of extrapulmonary tissue.
Mice were sacrificed at days 0, 4 and 6 p.i. with 105 PFU SARS-CoV-2 and tissues prepared for histological examination. Liver (a), spleen (b), kidney (c), small intestine (d), and colon (e) were studied. Pathological changes were minor and only observed in the liver. In the liver, all mice had some blood vessels filled with clear space or aggregates variably composed of erythrocytes / platelets (insets). Rare vessels had evidence of eosinophilic fibrillar material adherent along the vascular wall consistent with fibrin thrombi (a, arrows, inset, middle panel) adherent along the vascular wall. Bar = 110 (a,c-e) and 221 μm (b), H&E stain. Two sections of each organ from 3-4 mice per group were evaluated.
Extended Data Fig. 3.
Extended Data Fig. 3.. Inflammatory mediators and immune effector cells in infected lungs.
a. Cytokine and chemokine transcripts were measured by qPCR following reverse transcription of RNA isolated from the lungs of K18-hACE2 mice infected with 105 PFU SARS-CoV-2 (mock and 6 dpi, n=3; 2 and 4 dpi, n=4, each lung was collected from an individual mouse), one independent experiment. Statistical significance compared to results obtained at 0 dpi. Data were analyzed using 2-tailed Student’s t tests without adjustments. b. Gating strategy for identification of immune cells in lungs is shown. c. Representative FACS plot of IFNγ+TNF+ CD8 and CD4 T cells (as gated in panel b) after stimulation with indicated peptide pools in the lungs of 105 PFU SARS-CoV-2 infected K18-hACE2 mice. d. Summary data are shown (n=3 mice/time point). Data are representative of two independent experiments e. Quantification of immune cells (as gated in panel b) in the lungs (n=3 for uninfected group; n=4 for 4 and 6 dpi, each lung was collected from an individual mouse). Data are representative of two independent experiments. f. Sera were collected from infected mice at the indicated time points and IC50 values determined by neutralization of SARS-CoV-2 pseudoviruses expressing luciferase (n=4, days 0,2,4,6; n=7, day 13, 2 independent experiments). (a, d-f) Data are shown as mean±SEM.
Extended Data Fig. 4.
Extended Data Fig. 4.. Brain and nasal cavity infection in SARS-CoV-2 infected K18-hACE2 mice.
a. Brains from uninfected and infected (105 PFU SARS-CoV-2) mice were immunostained to detect SARS-CoV-2 N protein b, c. Multiple sites were characterized by cellular and karyorrhectic nuclear debris (b, arrows). Thrombi were detected, seen here in thalamus (c, arrow and inset). Bar = 17 μm. d. Ependyma (arrow) at day 6 p.i. had focal denudation and degeneration of ependymal cells (arrowheads) overlying focal region of cellular and karyorrhectic nuclei debris (asterisks). e. Nerve bundles (NB) subjacent to OE had evidence of punctate to linear immunostaining (brown, arrows). f. Sites of N protein localization at interface of OE and RE at day 2 p.i. (see Fig. 1d) had evidence of cell death and cellular debris (arrows). g. OE with sustentacular cell immunostaining for N protein. Bar = 1.3 mm (a), 65 μm (b,c,e-g) and 130 μm (d). Two sections of each tissue from 3-4 mice per group were evaluated.
Extended Data Fig. 5.
Extended Data Fig. 5.. Preference indices for social scent discrimination assays.
Preferences indices were calculated as described in Methods for each mouse shown in Figure 2. The preference index was calculated as time spent with preferred or nonpreferred scent: (preferred - nonpreferred) / (preferred + non preferred). a. For male mice, preferred scent = female dander; non preferred = male dander; (uninfected: n=15 mice, other groups: n=10 mice). b. For female mice, preferred scent = novel scent; nonpreferred = familiar scent; (uninfected and infected alone groups: n=8 mice each; infected/CP-treated groups: n=7 mice). Data were analyzed for statistical significance using 2-tailed Mann-Whitney U-tests and shown as mean±SEM.
Extended Data Fig. 6.
Extended Data Fig. 6.. Effects of Convalescent plasma delivered 6 hours before or 24 hours after infection.
a. N protein immunostaining in the lungs of control (healthy donor) plasma or convalescent plasma (CP)-treated mice at 2 and 5 days p.i. with 105 PFU SARS-CoV-2. Bar = 800 μm (top) and 160 μm (bottom). Two sections of each lung from 3 mice per group evaluated. Representative images are shown. b. Percentage of initial weight (left panel), and survival (right panel) of K18-hACE2 mice receiving control plasma (n=2) or undiluted CP (n=4) at 24 hours after challenge with 105 PFU SARS-CoV-2. Data are shown as mean±SEM and are representative of one independent experiment. ANOVA and 2-tailed Student’s t tests without adjustments (weights) and log-rank (Mantel-Cox) tests (survival) were used to analyze these data.
Fig. 1.
Fig. 1.. Clinical and pathological disease in SARS-CoV-2-infected K18-hACE2 mice.
a. Percentage of initial weight and survival of wild type (n=1 mouse) and K18-hACE2 mice infected with 103 (n=3 mice), 104 (n=10 mice), or 105 (n=8 mice) PFU SARS-CoV-2/mouse (2 independent experiments). ANOVA and 2-tailed Student’s t tests without adjustments (weight change) and log-rank (Mantel-Cox) tests (survival) were used to analyze these data. Left panel, P<0.0001 103 vs 105 PFU inoculum; p=0.0842 for 104 vs 105 PFU inoculum. b. Infectious virus titers detected by plaque assay in different organs at 2, 4, and 6 dpi with 105 PFU SARS-CoV-2 (day 2, 4 n=4 mice; day 6, n=8 mice (brain) and n=4 (other organs). 3 independent experiments). LOD=limit of detection. c-j. Nasal and sinus tissue were examined at days 2 (c-f) and 5 (g-j). N protein immunostaining (c,d,e,g,i,j) and H&E stain (f,h). (a,b) Data are shown as mean±SEM. c. N protein immunostaining in olfactory epithelium (OE). d. N protein immunostaining (brown) localized near interface of OE and respiratory epithelium (RE). Subjacent to epithelium, N protein was occasionally detected in endothelial lining of vessels (left arrow) and Bowman’s glands (right arrow) were occasionally detected. e-f. Maxillary sinus (MS) lining epithelium had extensive immunostaining for N protein (e, brown, arrows) with common sloughing and cellular debris (f, arrowheads). The lateral nasal glands (LNG) also had multifocal cellular and karyorrhectic debris (f, arrows). g-h. OE at day 5 with N protein immunostaining (g, arrows) localized near interface with respiratory epithelium. At these sites, cellular sloughing and loss of cellularity (h, arrows) were seen. i-j. Strong N protein immunostaining (arrows) was seen in tall OE cells with “classic” morphology of sustentacular cells along with immunostain expanding to adjacent cells. Bars = 128 (c,e), 63 (g,h), 31 (d,f), 42 (i), and 21 (j) μm, respectively. Two sections of each tissue from 3-4 mice per group were evaluated.
Fig. 2.
Fig. 2.. SARS-CoV-2 infection causes anosmia in K18-hACE2 mice.
Male and female mice were treated with PBS (uninfected) or 105 PFU SARS-CoV-2 intranasally. a,d. Schematic showing social scent discrimination tests. b,e. Weights were recorded daily. c. Each male mouse was allowed 5 minutes in the cage with male and female scent (bedding from male or female cages) placed at two corners of the cage. The time that male mice spent sniffing male or female scent was recorded. Data were analyzed by 2-way ANOVA. f. Female mice were exposed to their own bedding (‘familiar’) or bedding from another cage (‘novel’). The time that female mice spent exploring each bedding was recorded. Data were analyzed by 2-way ANOVA. In some experiments, mice were pretreated with undiluted convalescent plasma (results on right of vertical line (c,f)). g-i. Buried food test (schematic shown in g). Food was buried under the bedding and each mouse was allowed 4 minutes in the cage to search for the food. h. The dotted line denotes the time limit of 4 minutes. Data were analyzed by 2-tailed Mann-Whitney U-tests. i. The percentage of mice that found the buried food within 4 minutes is shown. Data were analyzed by χ2 Fisher’s exact test. In some experiments, mice were pretreated with undiluted convalescent plasma (denoted by blue bars in h,i). Male mice: uninfected: n=15 mice; infected: n=10 mice. Female mice: uninfected and infected: n=8 mice each; infected/CP-treated: n=7 mice. analyzed in 4 independent experiments. (b,c,e,f,h,i) Data are shown as mean±SEM. Preferences indices for the social scent discrimination assays are shown in Extended Data 5.
Fig. 3.
Fig. 3.. Effects of convalescent plasma (CP) on outcomes.
a. Percentage of initial weight (left panel) and survival (right panel) of K18-hACE2 mice receiving control serum (n=4 mice, black), undiluted (n=4 mice, blue), 1:3 dilution (n=4 mice, red) and 1:9 dilution (n=3 mice, purple) human CP at 24 hours prior to challenge with 105 PFU SARS-CoV-2. Data are from two independent experiments. ANOVA and 2-tailed Student’s t tests without adjustments (weight change) and log-rank (Mantel-Cox) tests (survival) were used to analyze these data. b. Viral titers of CP-treated mice in the lungs (left panel) and brains (right panel) at 2 and 5 dpi. n=3 except for 2 dpi, 1:9 dilution (n=2) mice, 1 independent experiment. LOD=limit of detection. 2-tailed Student’s t tests without adjustments were used to analyze these data. * P=0.0455, control vs. undiluted CP; P=0.0443 control vs. 1:3 diluted CP. c. Scores of N protein immunostaining in CP-treated mice in the nasal cavity at 2 (upper panel) and 5 (lower panel) dpi. 0 – none; 1 - rare <1%; 2 - multifocal or localized <33% cells; 3 - multifocal, coalescing, 33-66%; 4 - extensive >67%. Two sections of each sinonasal cavity from three mice per group were evaluated. Data are shown as mean±SEM. LNG-lateral nasal gland, RE-respiratory epithelium, OE-olfactory epithelium, VMO-vomeronasal organ.

Update of

Similar articles

Cited by

References

    1. Spinato G et al. Alterations in Smell or Taste in Mildly Symptomatic Outpatients With SARS-CoV-2 Infection. JAMA, doi:10.1001/jama.2020.6771 (2020). - DOI - PMC - PubMed
    1. Williamson EJ et al. Factors associated with COVID-19-related death using OpenSAFELY. Nature 584, 430–436, doi:10.1038/s41586-020-2521-4 (2020). - DOI - PMC - PubMed
    1. Munoz-Fontela C et al. Animal models for COVID-19. Nature, doi:10.1038/s41586-020-2787-6 (2020). - DOI - PMC - PubMed
    1. McCray PB Jr. et al. Lethal infection in K18-hACE2 mice infected with SARS-CoV. J Virol 81, 813–821 (2006). - PMC - PubMed
    1. Zhou P et al. A pneumonia outbreak associated with a new coronavirus of probable bat origin. Nature 579, 270–273, doi:10.1038/s41586-020-2012-7 (2020). - DOI - PMC - PubMed

Extended data references

    1. Chow YH et al. Targeting transgene expression to airway epithelia and submucosal glands, prominent sites of human CFTR expression. Mol Ther 2, 359–367, doi:10.1006/mthe.2000.0135 (2000). - DOI - PubMed
    1. Meyerholz DK & Beck AP Principles and approaches for reproducible scoring of tissue stains in research. Lab Invest 98, 844–855, doi:10.1038/s41374-018-0057-0 (2018). - DOI - PubMed
    1. Li K et al. Middle East Respiratory Syndrome Coronavirus Causes Multiple Organ Damage and Lethal Disease in Mice Transgenic for Human Dipeptidyl Peptidase 4. J Infect Dis 213, 712–722, doi:10.1093/infdis/jiv499 (2016). - DOI - PMC - PubMed
    1. Yang M & Crawley JN Simple behavioral assessment of mouse olfaction. Curr Protoc Neurosci Chapter 8, Unit 8 24, doi:10.1002/0471142301.ns0824s48 (2009) - DOI - PMC - PubMed

Publication types

MeSH terms