. 2020 Dec 16;48(22):12436-12452.
doi: 10.1093/nar/gkaa1053.

Genome-wide mapping of SARS-CoV-2 RNA structures identifies therapeutically-relevant elements

Affiliations

Genome-wide mapping of SARS-CoV-2 RNA structures identifies therapeutically-relevant elements

Ilaria Manfredonia et al. Nucleic Acids Res. .

Abstract

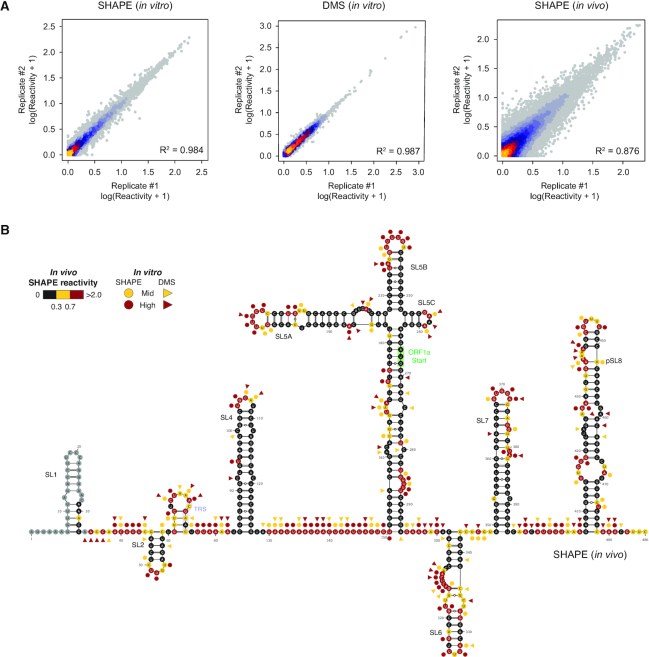
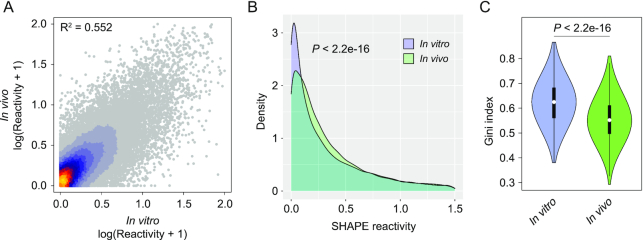
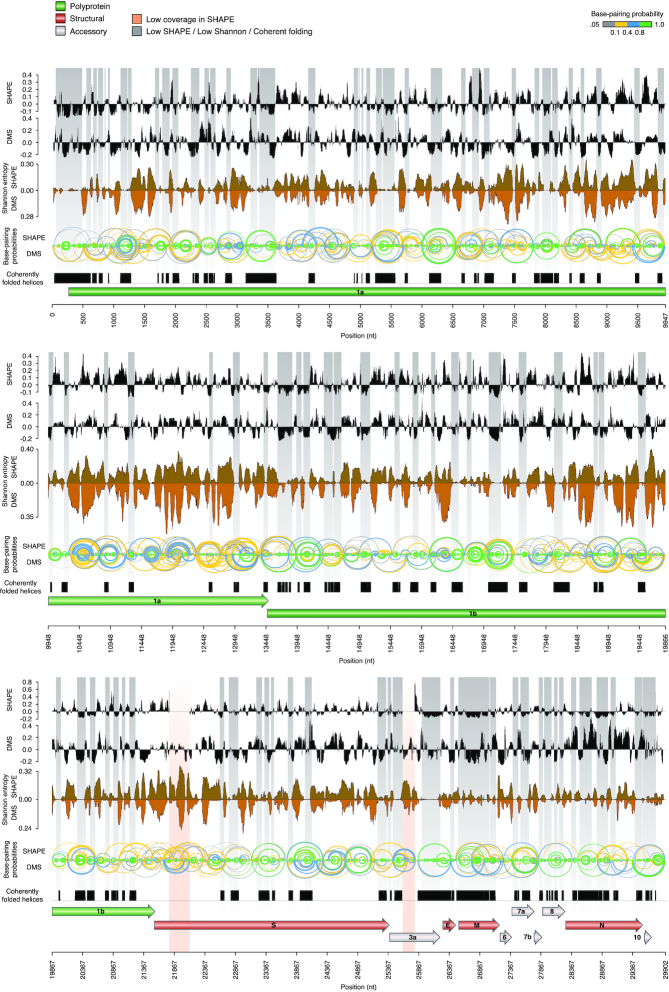
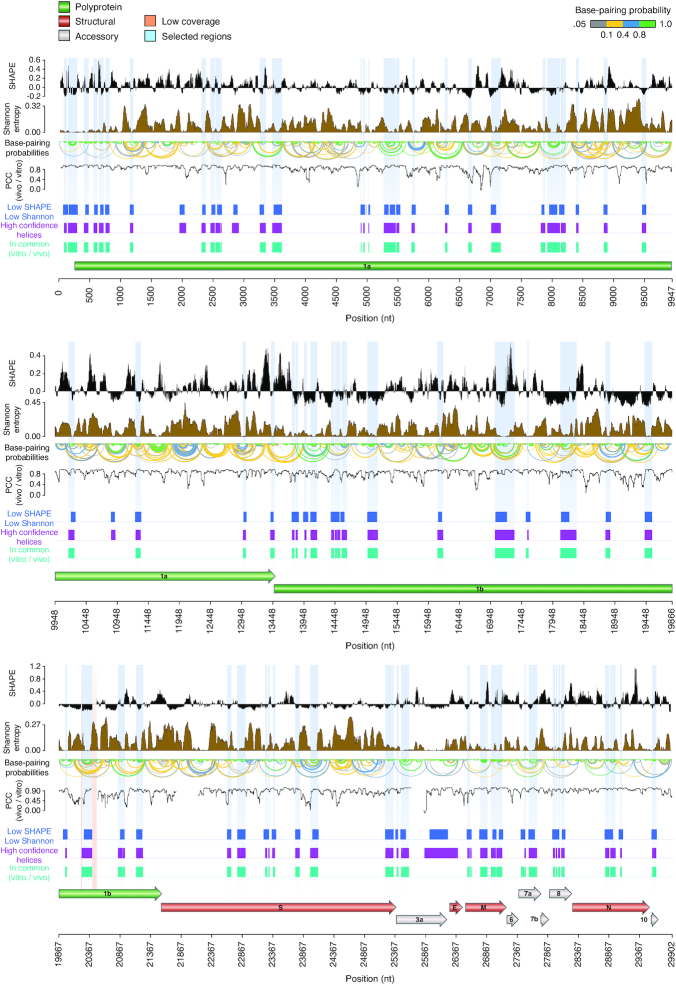
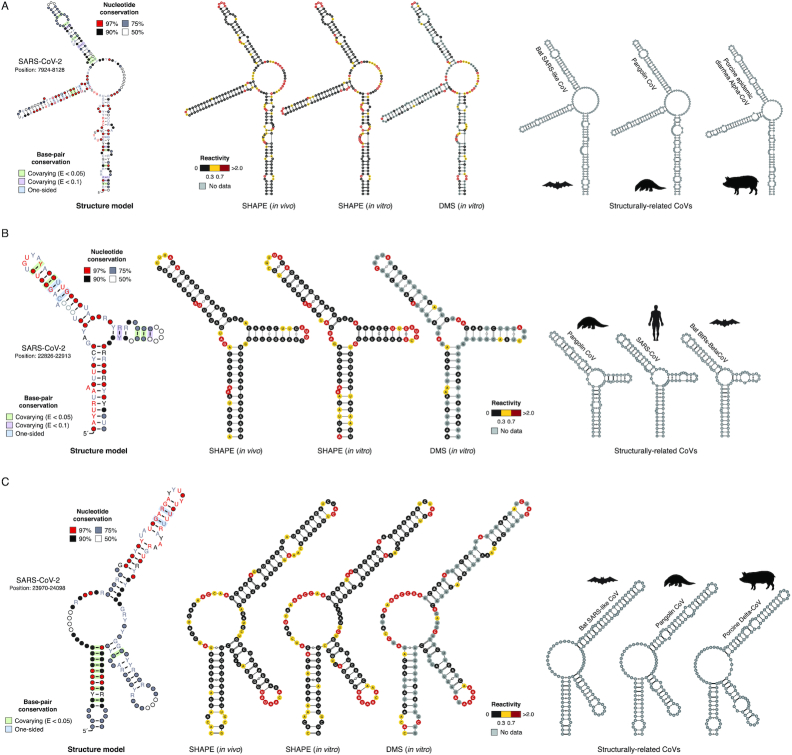
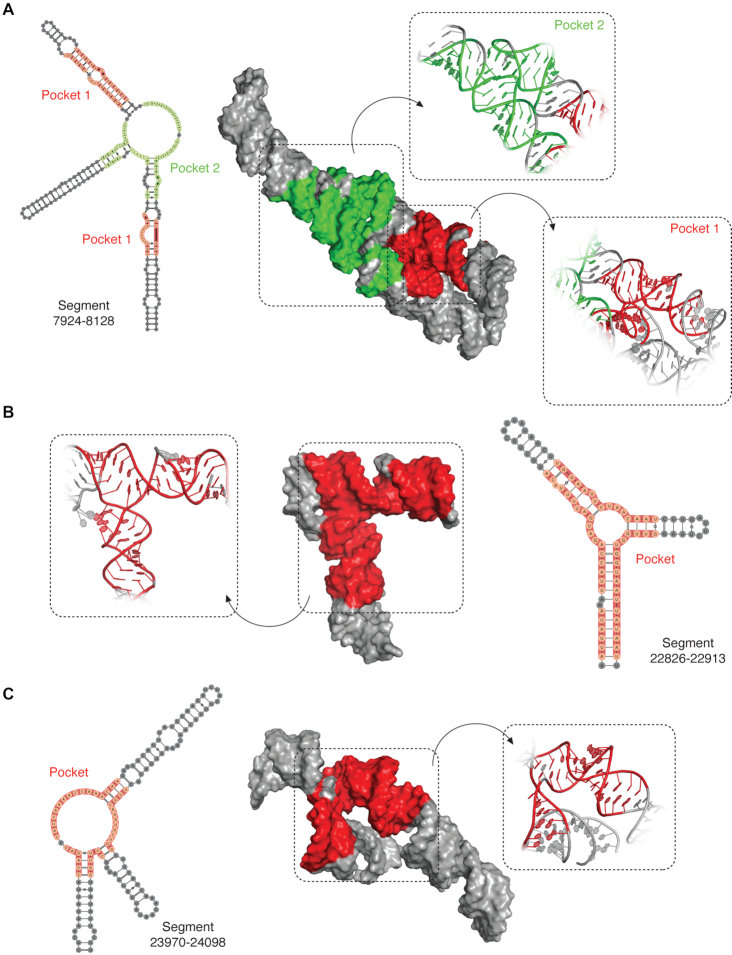
SARS-CoV-2 is a betacoronavirus with a linear single-stranded, positive-sense RNA genome, whose outbreak caused the ongoing COVID-19 pandemic. The ability of coronaviruses to rapidly evolve, adapt, and cross species barriers makes the development of effective and durable therapeutic strategies a challenging and urgent need. As for other RNA viruses, genomic RNA structures are expected to play crucial roles in several steps of the coronavirus replication cycle. Despite this, only a handful of functionally-conserved coronavirus structural RNA elements have been identified to date. Here, we performed RNA structure probing to obtain single-base resolution secondary structure maps of the full SARS-CoV-2 coronavirus genome both in vitro and in living infected cells. Probing data recapitulate the previously described coronavirus RNA elements (5' UTR and s2m), and reveal new structures. Of these, ∼10.2% show significant covariation among SARS-CoV-2 and other coronaviruses, hinting at their functionally-conserved role. Secondary structure-restrained 3D modeling of these segments further allowed for the identification of putative druggable pockets. In addition, we identify a set of single-stranded segments in vivo, showing high sequence conservation, suitable for the development of antisense oligonucleotide therapeutics. Collectively, our work lays the foundation for the development of innovative RNA-targeted therapeutic strategies to fight SARS-related infections.


Figures

Figure 1.
Figure 1.
Genome-wide SHAPE-MaP analysis of SARS-CoV-2. (A) Heat scatter plot of normalized reactivities across two biological replicates for the in vitro SHAPE (left) and DMS (center) datasets, and the in vivo SHAPE dataset (right). (B) Normalized in vivo SHAPE reactivities superimposed on the 5′ UTR structure. Highly (red) and moderately (yellow) reactive residues from in vitro SHAPE (circles) and DMS (triangles) experiments are also indicated. A novel putative stem-loop 8 (pSL8), coherently predicted in all our datasets is also reported.
Figure 2.
Figure 2.
Comparison between in vitro and in vivo structure of the SARS-CoV-2 genome. (A) Heat scatter plot of normalized SHAPE reactivities for the in vitro refolded SARS-CoV-2 genome versus the in vivo-probed one. (B) Distribution of SHAPE reactivities for the in vitro refolded SARS-CoV-2 genome, versus the in vivo-probed one. (C) Violin plot depicting the distribution of Gini indexes calculated in 50 nt windows slid along the SARS-CoV-2 genome for the in vitro refolded sample versus the in vivo-probed one (sliding offset: 25 nt).
Figure 3.
Figure 3.
Structure map of the full SARS-CoV-2 genome in vitro. Map of the SARS-CoV-2 genome depicting (top to bottom): median SHAPE reactivity (in 50 nt centered windows, with respect to the median reactivity across the whole genome), median DMS reactivity (in 50 nt centered widows, with respect to the median reactivity across the whole genome), Shannon entropy and base-pairing probabilities for both the SHAPE (up) and DMS (down) samples, set of low SHAPE – low Shannon helices coherently predicted in both datasets. Regions with both low Shannon and low SHAPE, likely identifying RNA segments with well-defined foldings, are marked in grey. Two regions of low sequencing coverage are marked in red.
Figure 4.
Figure 4.
Structure map of the full SARS-CoV-2 genome in vivo. Map of the SARS-CoV-2 genome depicting (top to bottom): median SHAPE reactivity (in 50 nt centered widows, with respect to the median reactivity across the whole genome), Shannon entropy, base-pairing probabilities, Pearson correlation coefficient (in 50 nt centered windows; PCC) between in vitro and in vivo SHAPE data, set of low SHAPE – low Shannon under both in vitro and in vivo conditions (blue), set of helices coherently predicted independently of the window size employed (3000, 5000 or 10 000 nt; magenta), set of helices coherently predicted under both in vitro and in vivo conditions (aqua green). Selected structure elements are marked in light blue. Two short regions of low sequencing coverage are marked in red.
Figure 5.
Figure 5.
Structure of conserved elements in SARS-CoV-2 RNA. Structure models for segments 7924–8128 (A), 22 826–22 913 (B) and 23 970–24 098 (C). All three segments consist of conserved three-way junction structures. Structure models have been generated using the R2R software. Base-pairs showing significant covariation (as determined by R-scape) are boxed in green (E-value < 0.05) and violet (E-value < 0.1) respectively. Alongside, the structure of each segment in SARS-CoV-2 (as inferred from in vitro SHAPE-MaP data) with superimposed in vitro SHAPE-MaP (left) or DMS-MaPseq (center) reactivities, or in vivo SHAPE-MaP reactivities (right) is shown, together with the putative conserved structure in other CoV as derived from the alignment (manually optimized with the ViennaRNA package).
Figure 6.
Figure 6.
3D modeling of SARS-CoV-2 RNA structured segments and identification of druggable pockets. 3D structure of the most abundant cluster for segments 7924–8128 (A), 22826–22913 (B) and 23970–24098 (C), as derived from the 1000 lowest energy 3D structure structures modeled by SimRNA (using the consensus MEA secondary structure, inferred from in vitro and in vivo SHAPE-MaP analyses, as a restraint). Residues composing the identified druggable pockets are shaded.

References

    1. Boerneke M.A., Ehrhardt J.E., Weeks K.M.. Physical and functional analysis of viral RNA genomes by SHAPE. Ann. Rev. Virol. 2019; 6:93–117. - PMC - PubMed
    1. Sanju′n R., Nebot M.R., Chirico N., Mansky L.M., Belshaw R.. Viral mutation rates. J. Virol. 2010; 84:9733–9748. - PMC - PubMed
    1. Irwin K.K., Renzette N., Kowalik T.F., Jensen J.D.. Antiviral drug resistance as an adaptive process. Virus Evol. 2016; 2:vew014. - PMC - PubMed
    1. Cui J., Li F., Shi Z.-L.. Origin and evolution of pathogenic coronaviruses. Nat. Rev. Microbiol. 2018; 17:181–192. - PMC - PubMed
    1. de Wit E., van Doremalen N., Falzarano D., Munster V.J.. SARS and MERS: recent insights into emerging coronaviruses. Nat. Rev. Microbiol. 2016; 14:523–534. - PMC - PubMed

Publication types

MeSH terms