. 2020 Dec 16;48(22):12415-12435.
doi: 10.1093/nar/gkaa1013.

Secondary structure determination of conserved SARS-CoV-2 RNA elements by NMR spectroscopy

Affiliations

Secondary structure determination of conserved SARS-CoV-2 RNA elements by NMR spectroscopy

Anna Wacker et al. Nucleic Acids Res. .

Erratum in

  • Correction to 'Secondary structure determination of conserved SARS-CoV-2 RNA elements by NMR spectroscopy'.
    Wacker A, Weigand JE, Akabayov SR, Altincekic N, Bains JK, Banijamali E, Binas O, Castillo-Martinez J, Cetiner E, Ceylan B, Chiu LY, Davila-Calderon J, Dhamotharan K, Duchardt-Ferner E, Ferner J, Frydman L, Fürtig B, Gallego J, Grün JT, Hacker C, Haddad C, Hähnke M, Hengesbach M, Hiller F, Hohmann KF, Hymon D, de Jesus V, Jonker H, Keller H, Knezic B, Landgraf T, Löhr F, Luo L, Mertinkus KR, Muhs C, Novakovic M, Oxenfarth A, Palomino-Schätzlein M, Petzold K, Peter SA, Pyper DJ, Qureshi NS, Riad M, Richter C, Saxena K, Schamber T, Scherf T, Schlagnitweit J, Schlundt A, Schnieders R, Schwalbe H, Simba-Lahuasi A, Sreeramulu S, Stirnal E, Sudakov A, Tants JN, Tolbert BS, Vögele J, Weiß L, Wirmer-Bartoschek J, Wirtz Martin MA, Wöhnert J, Zetzsche H. Wacker A, et al. Nucleic Acids Res. 2021 Jul 9;49(12):7204-7205. doi: 10.1093/nar/gkab568. Nucleic Acids Res. 2021. PMID: 34161581 Free PMC article. No abstract available.

Abstract

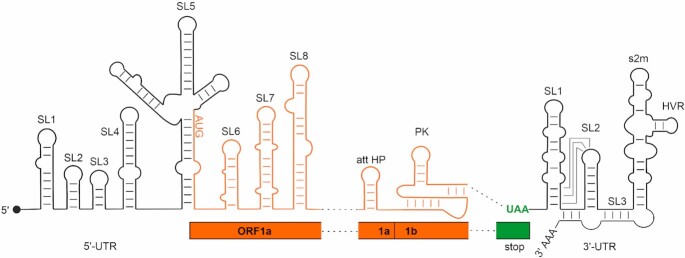
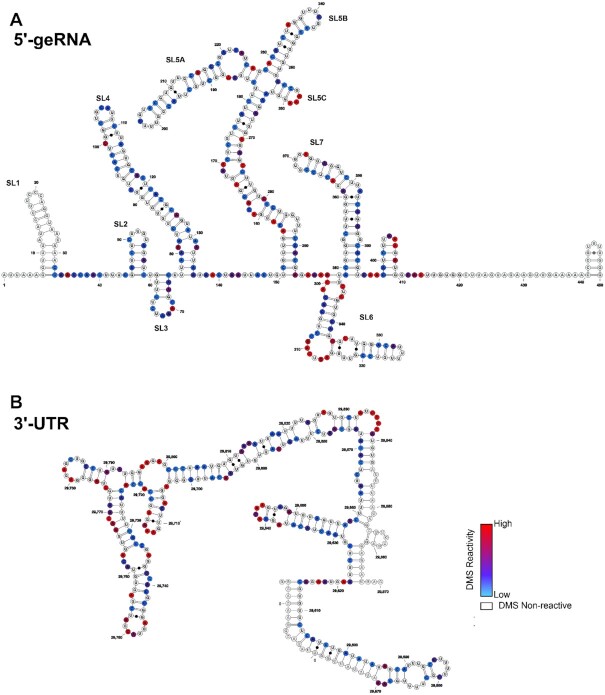
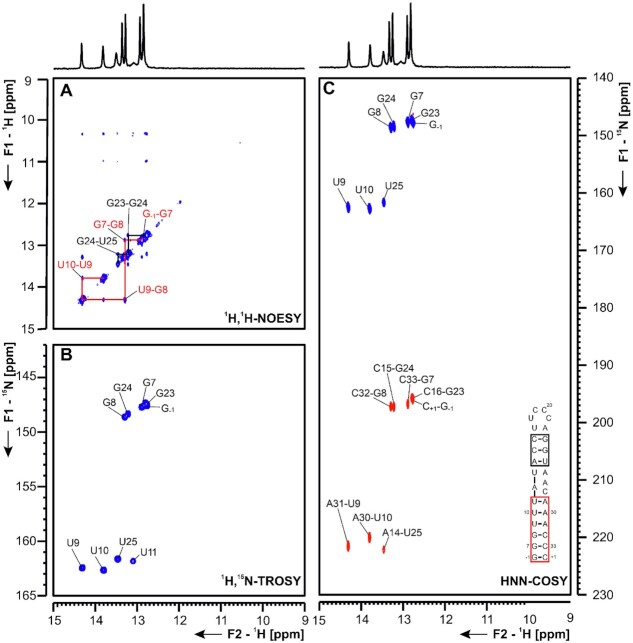
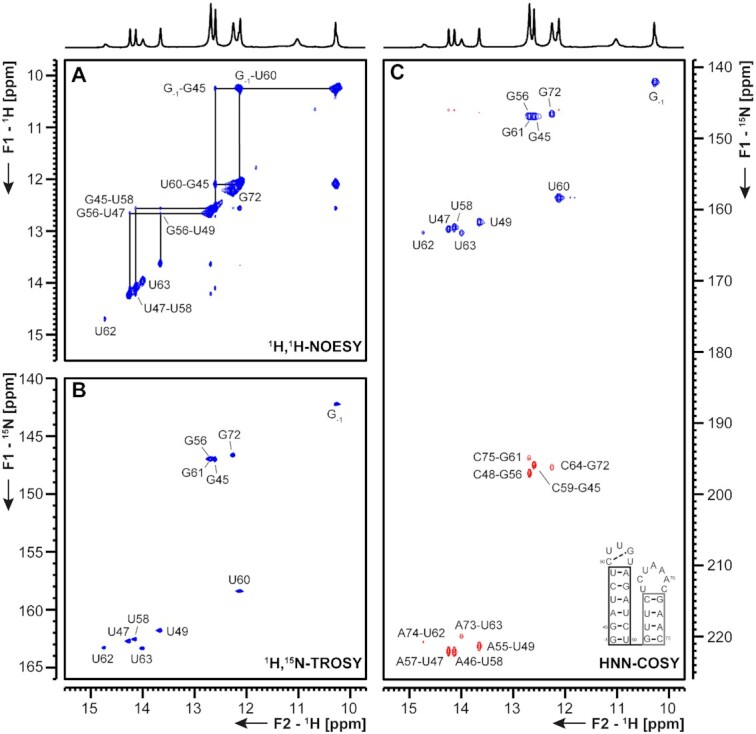
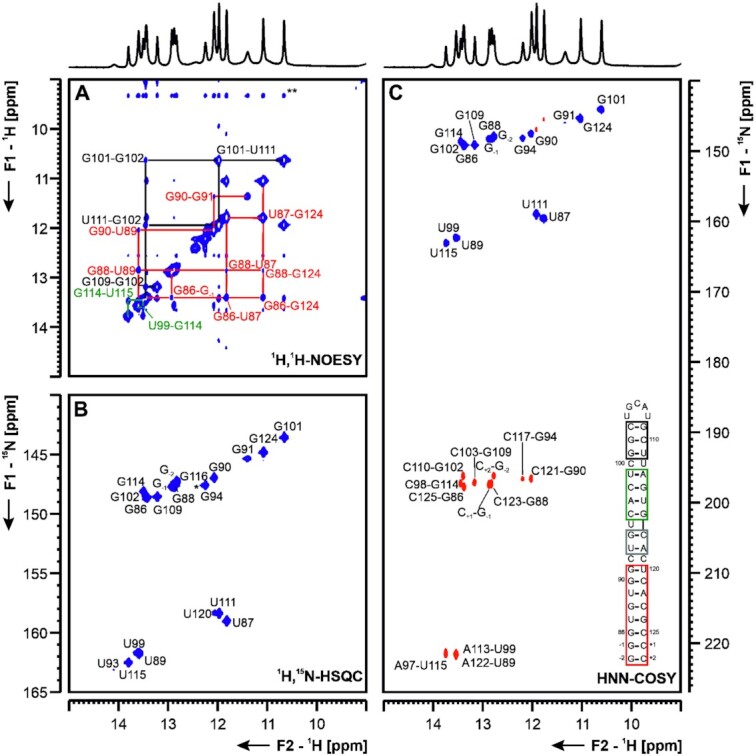
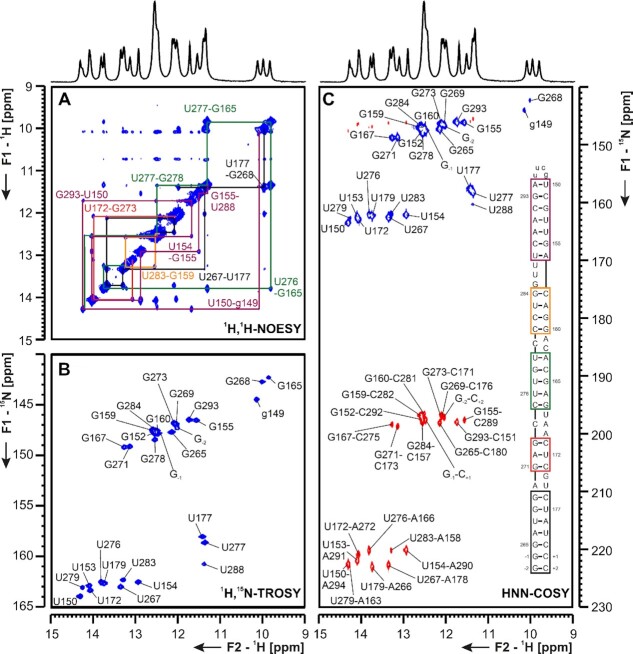
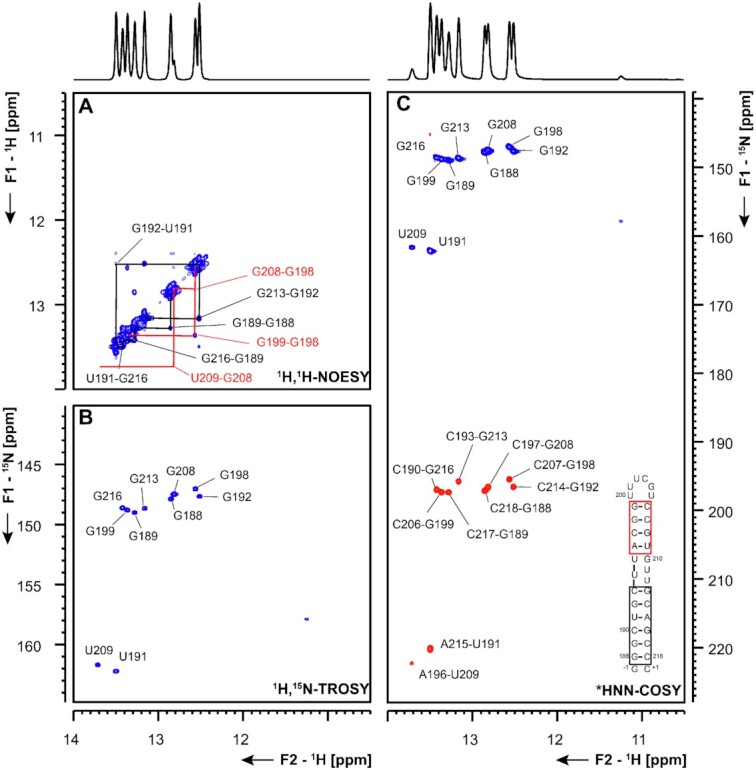
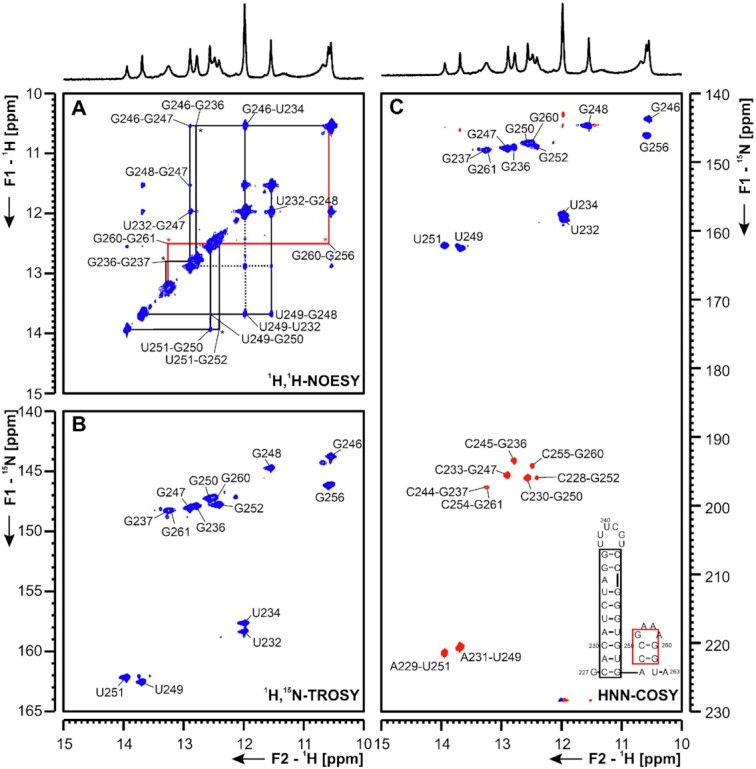
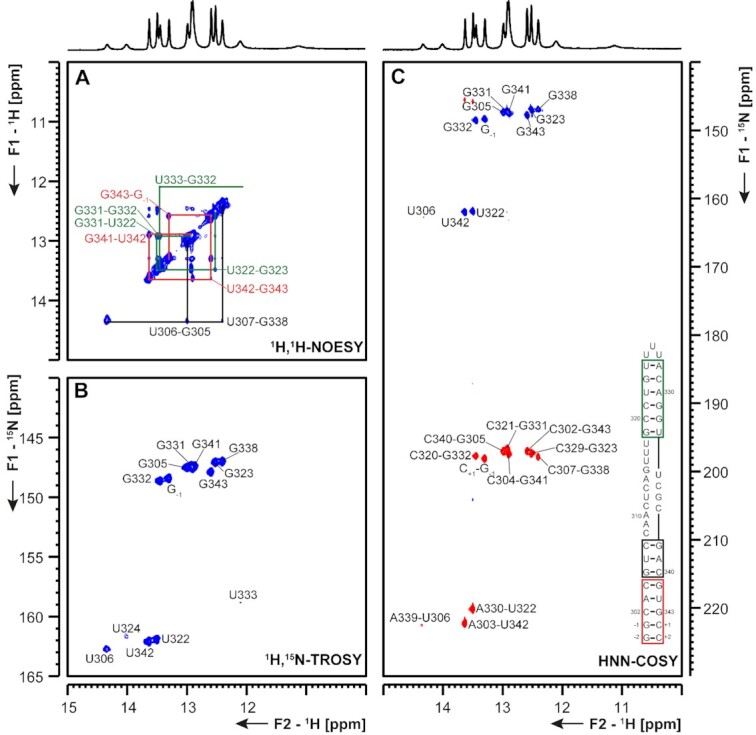
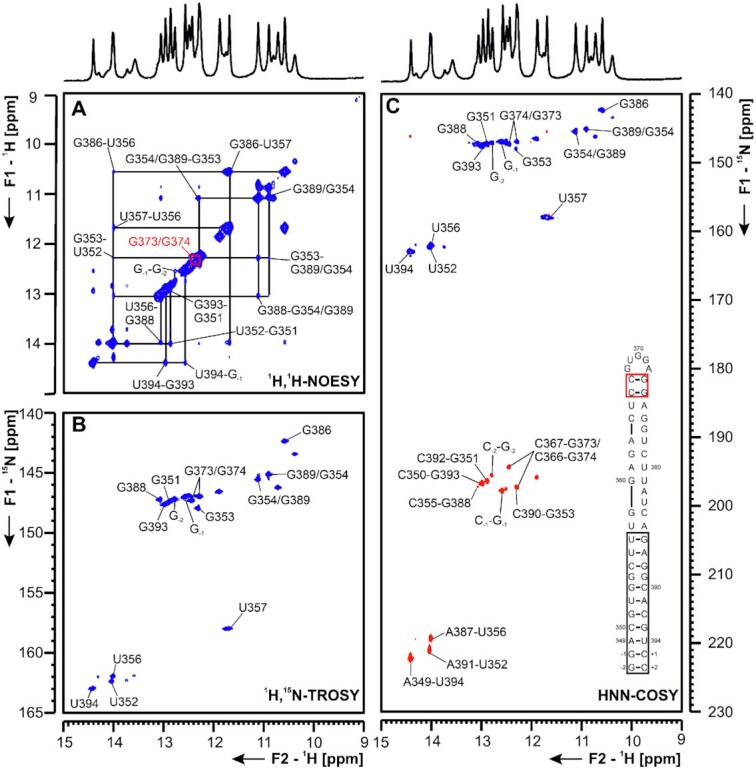
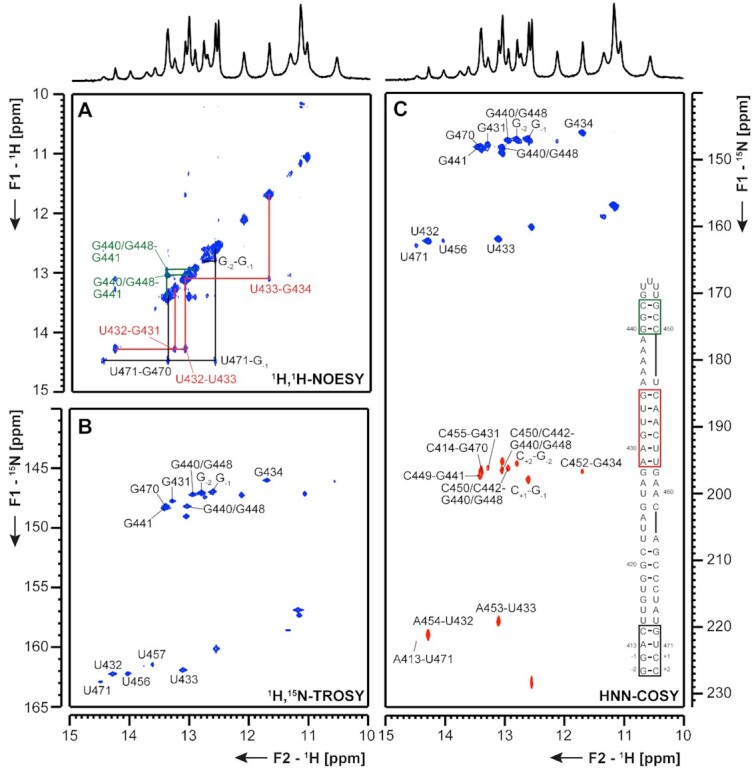
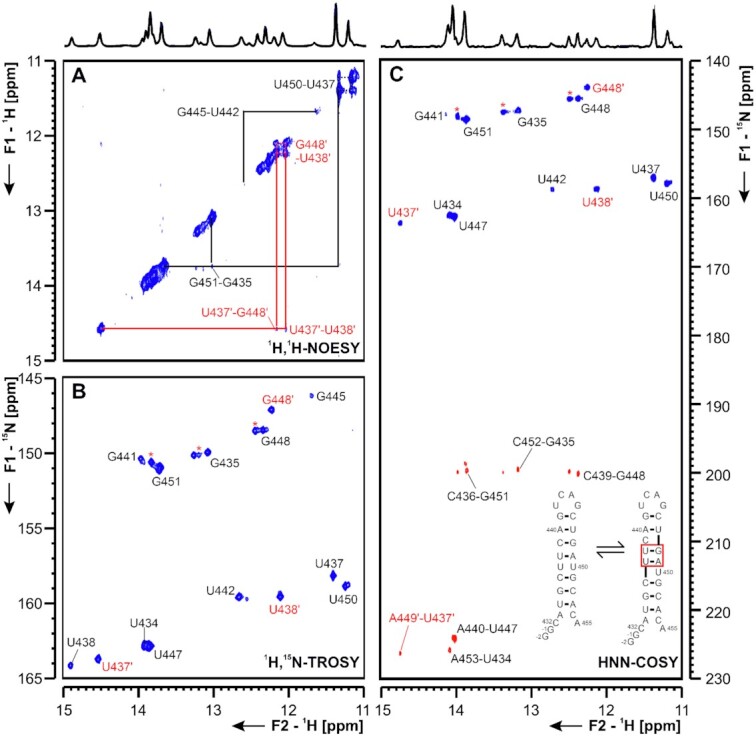
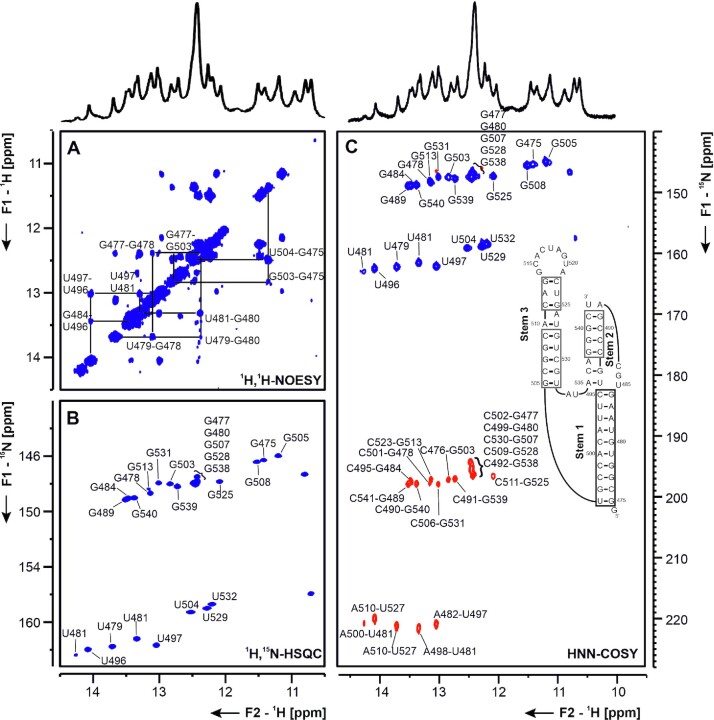
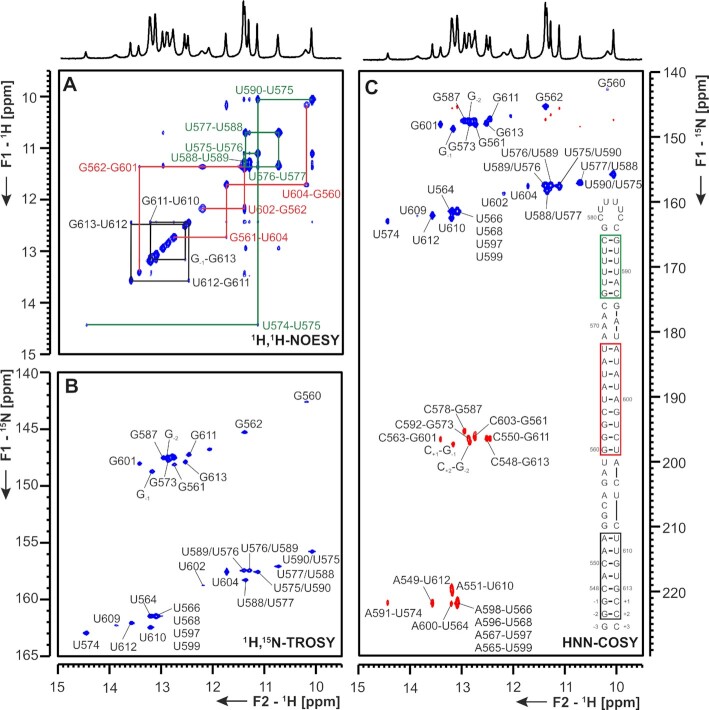
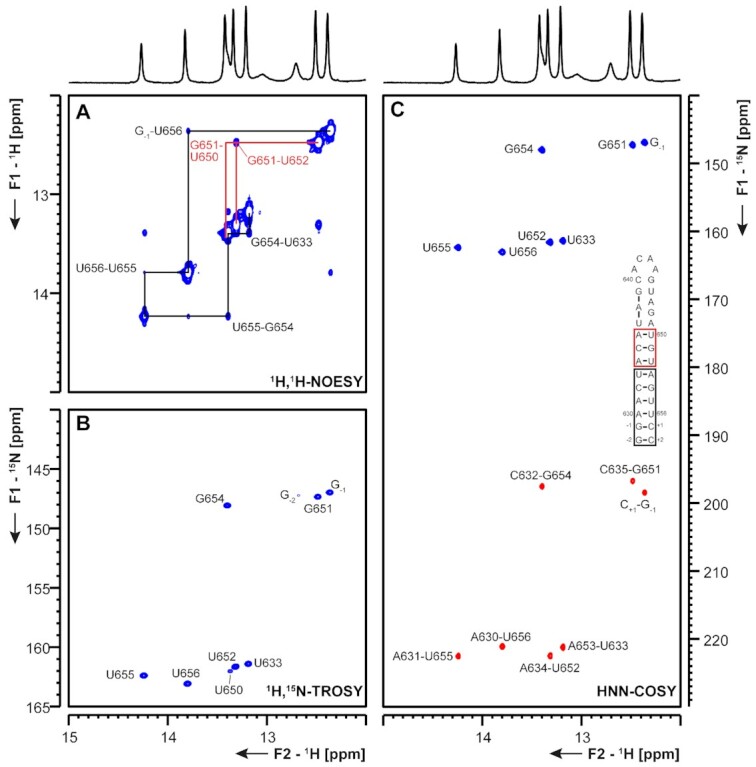
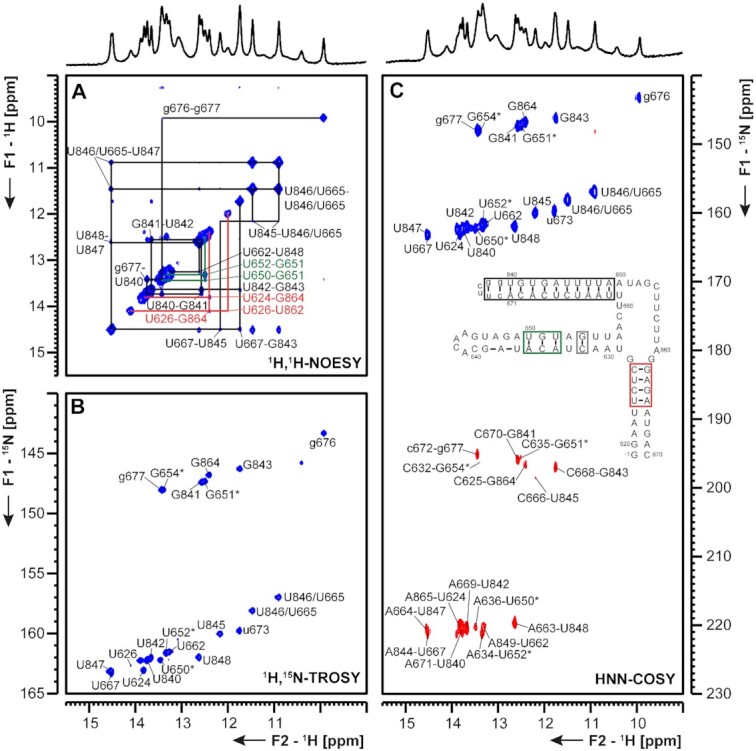
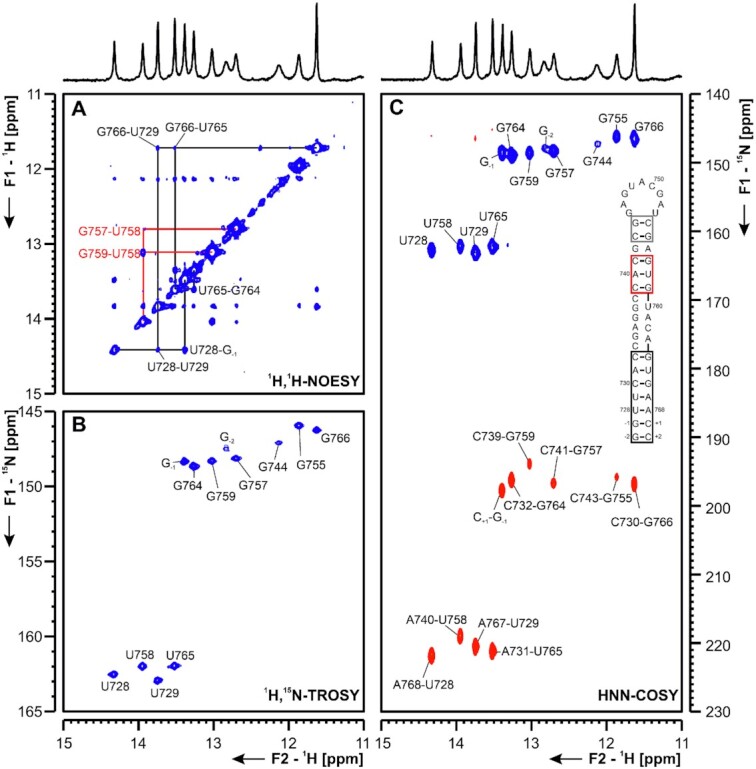
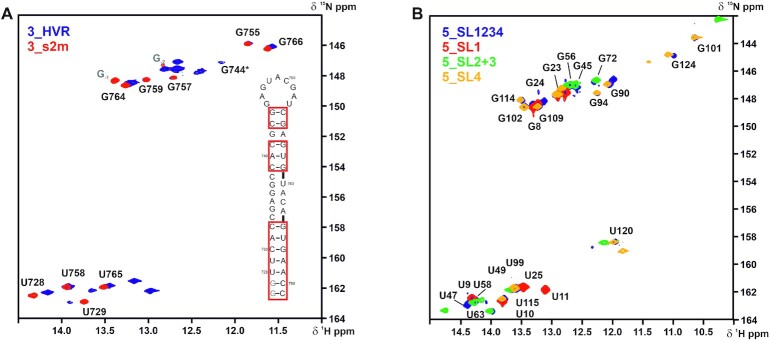
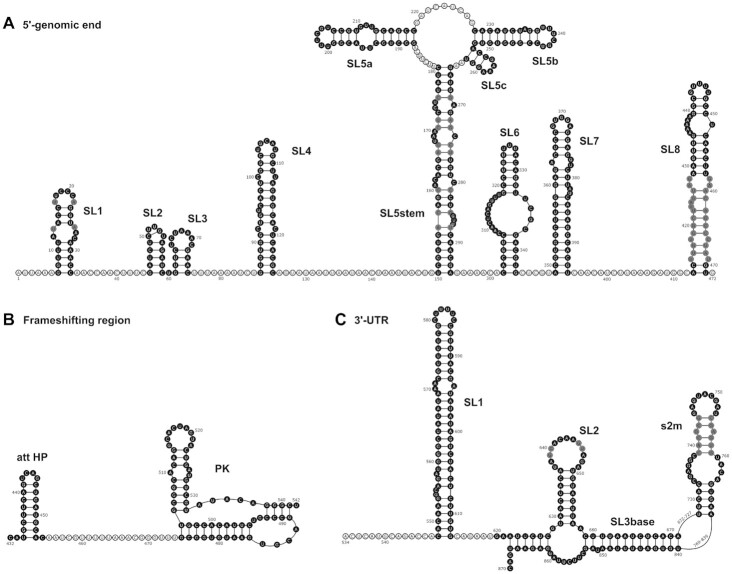
The current pandemic situation caused by the Betacoronavirus SARS-CoV-2 (SCoV2) highlights the need for coordinated research to combat COVID-19. A particularly important aspect is the development of medication. In addition to viral proteins, structured RNA elements represent a potent alternative as drug targets. The search for drugs that target RNA requires their high-resolution structural characterization. Using nuclear magnetic resonance (NMR) spectroscopy, a worldwide consortium of NMR researchers aims to characterize potential RNA drug targets of SCoV2. Here, we report the characterization of 15 conserved RNA elements located at the 5' end, the ribosomal frameshift segment and the 3'-untranslated region (3'-UTR) of the SCoV2 genome, their large-scale production and NMR-based secondary structure determination. The NMR data are corroborated with secondary structure probing by DMS footprinting experiments. The close agreement of NMR secondary structure determination of isolated RNA elements with DMS footprinting and NMR performed on larger RNA regions shows that the secondary structure elements fold independently. The NMR data reported here provide the basis for NMR investigations of RNA function, RNA interactions with viral and host proteins and screening campaigns to identify potential RNA binders for pharmaceutical intervention.


Figures

Figure 1.
Figure 1.
Overview of cis-acting RNA elements of the SCoV2 genome. Black: untranslated regions; orange: coding regions. The SL structures investigated in this study and their relative positions within the SCoV2 genome are shown schematically. ‘stop’ represents the end of ORF9 coding for the Nucleocapsid protein.
Figure 2.
Figure 2.
Secondary structures of the SCoV2 5′-genomic end and 3′-UTR as determined by DMS-MaPseq. Normalized DMS reactivity indices used to fold the secondary structures of (A) SCoV2 5′-genomic end and (B) SCoV2 3′-UTR are superimposed with color codes scaled from the highest reactivity set to 1 (red) to the lowest set to 0 (blue). G and U nucleotides are rendered as white and sites that overlap with sequencing primers are rendered transparent.
Figure 3.
Figure 3.
(A) 1H,1H-NOESY, (B) 1H,15N-TROSY and (C) HNN-COSY spectra for imino-proton correlation of the 5′-genomic end construct 5_SL1 encompassing nts 7–33. Positive contours are given in blue, negative contours in red. The imino-proton correlations are annotated using the genomic numbering. Imino-proton correlations in (A) between consecutive base pairs are shown in different colors. Included in (C) is the experimentally observed secondary structures of 5_SL1 with genomic numbering. Additional closing base pairs are annotated with ‘±x’. Colors of boxes are according to the correlations in (A).
Figure 4.
Figure 4.
(A) 1H,1H-NOESY, (B) 1H,15N-TROSY and (C) HNN-COSY spectra for imino-proton correlation of the 5′-genomic end construct 5_SL2+3 encompassing nts 45–75. Positive contours are given in blue, negative contours in red. The imino-proton correlations are annotated using genomic numbering. Imino-proton correlations in (A) between consecutive base pairs are shown in black. Included in (C) is the experimentally observed secondary structure of 5_SL2+3 with genomic numbering. Additional closing base pairs are annotated with ‘±x’. The black box represents the correlations in (A). The gray boxes marks base pairs which were not assigned based on imino-to-imino correlations.
Figure 5.
Figure 5.
(A) 1H,1H-NOESY, (B) 1H,15N-TROSY and (C) HNN-COSY spectra for imino-proton correlation of the 5′-genomic end construct 5_SL4 encompassing nts 86–125. Positive contours are given in blue, negative contours in red. The imino-proton correlations are annotated using the genomic numbering. Imino-proton correlations in (A) between consecutive base pairs are shown in different colors. Included in (C) is the experimentally observed secondary structure of 5_SL4 with genomic numbering. Additional closing base pairs are annotated with ‘±x’. Colors of boxes are according to the correlations in (A). Gray boxes mark base pairs, which were not assigned based on imino-to-imino correlations. The asterisk in (B) marks a signal which is visible at lower contour levels.
Figure 6.
Figure 6.
(A) 1H,1H-NOESY, (B) 1H,15N-TROSY and (C) HNN-COSY spectra for imino-proton correlations of the 5′-genomic end construct 5_SL5stem encompassing nts 150–180 and 265–294. Positive contours are given in blue, negative contours in red. The imino-proton correlations are annotated using the genomic numbering. Sequential imino-proton correlations in (A) between neighboring base pairs are shown in colors according to the experimentally determined 5_SL5stem RNA secondary structure schematized as an inset in panel (C). NMR resonances arising from the tetraloop nucleotides are annotated with small letters and the two additional GC closing base pairs at the 5′- and 3′-termini are numbered with ±x, respectively. Colors of boxes are according to the correlations in (A). Note that the stem is depicted upside down with respect to its orientation as presented in the overall scheme of Figure 1.
Figure 7.
Figure 7.
(A) 1H,1H-NOESY, (B) 1H,15N-TROSY and (C) HNN-COSY spectra for imino-proton correlations of the 5′-genomic end construct 5_SL5a encompassing nts 188–218. Positive contours are given in blue, negative contours in red. The imino-proton correlations are annotated using the genomic numbering. Imino-proton correlations in (A) between consecutive base pairs are shown in different colors. Included in (C) is the experimentally observed secondary structure of 5_SL5a with genomic numbering. The HNN-COSY spectrum in (C) was recorded at 298 K. Additional closing base pairs are annotated with ‘±x’. Colors of boxes are according to the correlations in (A).
Figure 8.
Figure 8.
(A) 1H,1H-NOESY, (B) 1H,15N-TROSY and (C) HNN-COSY spectra for imino-proton correlation of the 5′-genomic end construct 5_SL5b+c encompassing nucleotides 227 to 263 at 283K. Positive contours are given in blue, negative contours in red. The imino-proton correlations are annotated using the genomic numbering. Imino-proton correlations in (A) between consecutive base pairs are shown in different colors, * denote crosspeaks visible at 275K, but not at 283K. Included in (C) is the experimentally observed secondary structure of 5_SL5b+c with genomic numbering. Additional closing base pairs are annotated with ‘±x’. The boxes are according to the correlations in (A).
Figure 9.
Figure 9.
(A) 1H,1H-NOESY, (B) 1H,15N-TROSY and (C) HNN-COSY spectra for imino-proton correlation of the 5′-genomic end construct 5_SL6 encompassing nts 302–343. Positive contours are given in blue, negative contours in red. The imino-proton correlations are annotated using the genomic numbering. Imino-proton correlations in (A) between consecutive base pairs are shown in different colors. Included in (C) is the experimentally observed secondary structure of 5_SL6 with genomic numbering. Additional closing base pairs are annotated with ‘±x’. Colors of boxes are according to the correlations in (A).
Figure 10.
Figure 10.
(A) 1H,1H-NOESY, (B) 1H,15N-TROSY and (C) HNN-COSY spectra for imino-proton correlation of the 5′-genomic end construct 5_SL7 encompassing nts 349–394. Positive contours are given in blue, negative contours in red. The imino-proton correlations are annotated using the genomic numbering. Imino-proton correlations in (A) between consecutive base pairs are shown in different colors. Included in (C) is the experimentally observed secondary structure of 5_SL7 with genomic numbering. Additional closing base pairs are annotated with ‘±x’. Colors of boxes are according to the correlations in (A).
Figure 11.
Figure 11.
(A) 1H,1H-NOESY, (B) 1H,15N-TROSY and (C) HNN-COSY spectra for imino-proton correlation of the 5′-genomic end construct 5_SL8 encompassing nts 413–471. Positive contours are given in blue, negative contours in red. The imino-proton correlations are annotated using the genomic numbering. Imino-proton correlations in (A) between consecutive base pairs are shown in different colors. Included in (C) is the experimentally observed secondary structures of 5_SL8 with genomic numbering. Additional closing base pairs are annotated with ‘±x’. Colors of boxes are according to the correlations in (A).
Figure 12.
Figure 12.
(A) 1H,1H-NOESY, (B) 1H,15N-TROSY and (C) HNN-COSY spectrum of the SARS-CoV-2 attenuator hairpin encompassing nts 13 432 to 13 455. Positive contours are given in blue, negative contours in red. The imino-proton correlations are annotated using genomic numbering, shifted for convenience by 13k nts from 5′. Imino-proton correlations in (A) between consecutive base pairs are shown in black and red for the two present exchanging conformations. Included in (A) is the experimentally observed equilibrium between secondary structures of the attenuator. Additional closing basepairs are annotated with ‘±x’. Colors boxes are according to the correlations in (A). Asterisks indicate secondary shifts due to conformational exchange.
Figure 13.
Figure 13.
(A) 1H,1H-NOESY, (B) 1H,15N-TROSY and (C) HNN-COSY spectra for imino-proton correlation of the genomic-central located PK construct encompassing nts 13 475–13 542. Positive contours are given in blue, negative contours in red. The imino-proton correlations are annotated using the genomic numbering, shifted for convenience by 13 000 nts from 5′. Imino-proton correlations in (A) between consecutive base pairs are shown in different colors. Included in (C) is the experimentally observed secondary structures of PK with genomic numbering, shortened by 13k nts from 5′. The secondary structure according to (C) is shown with genomic numbering from SCov2. Colors of boxes are according to the correlations in (A). Gray boxes mark base pairs, which were not assigned based on imino-to-imino correlations.
Figure 14.
Figure 14.
(A) 1H,1H-NOESY, (B) 1H,15N-TROSY and (C) HNN-COSY spectra for imino-proton correlation of the 3′-genomic end construct 3_SL1 encompassing nts 29 548–29 613. Positive contours are given in blue, negative contours in red. The imino-proton correlations are annotated using the genomic numbering, shifted for convenience by 29 000 nts from 5′. Imino-proton correlations in (A) between consecutive base pairs are shown in different colors. Included in (C) is the experimentally observed secondary structure of 3_SL1 with genomic numbering, shortened by 29k nts from 5′. Additional closing base pairs are annotated with ‘±x’. Colors of boxes are according to the correlations in (A).
Figure 15.
Figure 15.
(A) 1H,1H-NOESY, (B) 1H,15N-TROSY and (C) HNN-COSY spectra for imino-proton correlation of the 3′-genomic end construct 3_SL2 encompassing nts 29 630–29 656. Positive contours are given in blue, negative contours in red. The imino-proton correlations are annotated using the genomic numbering, shifted for convenience by 29 000 nts from 5′. Imino-proton correlations in (A) between consecutive base pairs are shown in different colors. Included in (C) is the experimentally observed secondary structure of 3_SL2. Additional closing base pairs are annotated with ‘±x’. Colors of boxes are according to the correlations in (A).
Figure 16.
Figure 16.
(A) 1H,1H-NOESY, (B) 1H,15N-TROSY and (C) HNN-COSY spectra for imino-proton correlation of the 3′-genomic end construct 3_SL3base encompassing nts 29 620–29 671 and 29 840–29 870. Positive contours are given in blue, negative contours in red. The imino-proton correlations are annotated using the genomic numbering, shifted for convenience by 29 000 nts from 5′. Assignments that are marked with an asterisk are tentative and might be subject to change. Imino-proton correlations in (A) between consecutive base pairs are shown in different colors. Included in (C) is the experimentally observed secondary structure of 3_SL3base. Additional closing base pairs are annotated with ‘±x’. The colors of boxes are according to the correlations in (A). Gray boxes mark base pairs, which were not assigned based on imino-to-imino correlations.
Figure 17.
Figure 17.
(A) 1H,1H-NOESY, (B) 1H,15N-TROSY and (C) HNN-COSY spectra for imino-proton correlation of the 3′-genomic end construct 3_s2m encompassing nts 29 728–29 768. Positive contours are given in blue, negative contours in red. The imino-proton correlations are annotated using the genomic numbering, shifted for convenience by 29 000 nts from 5′. Imino proton correlations in (A) between consecutive base pairs are shown in different colors. Included in (C) is the experimentally observed secondary structure of 3_s2m. Assignments that are marked with an asterisk are tentative and might be subject to change. Additional closing base pairs are annotated with ‘±x’. Colors of boxes are according to the correlations in (A).
Figure 18.
Figure 18.
Overlay of 1H,15N-TROSY spectra for the imino-proton correlations of (A) 3_HVR (blue) and 3_s2m (red) and (B). 5_SL1-4 (blue), 5_SL1 (red), 5_SL2+3 (green) and 5_SL4 (yellow). 5_SL1-4 encompasses nts 7–125 and 3_HVR consists of nts 29 698–29 806. Given assignments were derived from the spectra of the single SLs (see Figures 4, 5 and 6 for (B) and Figure 18 for (A) with genomic numbering shifted for convenience by 29,000 nts from 5′. Spectra in (A) were recorded at 298 K and spectra in (B) were recorded at 283 K. In (A), the isolated 3_s2m is depicted for illustration of assignments. The additional nucleotides G-1 and G-2 are colored in gray. The asterisk denotes a signal which shows up at lower contour levels for 3_s2m. In (B), only resonances which are present both in 5_SL1234 and the respective isolated RNA are annotated. Secondary structures are omitted for clarity.
Figure 19.
Figure 19.
Overview of the experimentally derived structures for the cis-elements of the 5′-genomic end (A), the frameshifting region (B) and the 3′-UTR (C). Genomic numbering is shifted for convenience by 13 000 from 5′ for the frameshifting region and 29 000 for the 3′-UTR. Cis-elements analyzed by NMR spectroscopy are highlighted in black. Regions with unclear base pairing patterns or high reactivity in structural probing data are shown in gray and discussed in the main text.

References

    1. Rangan R., Zheludev I.N., Hagey R.J., Pham E.A., Wayment-Steele H.K., Glenn J.S., Das R.. RNA genome conservation and secondary structure in SARS-CoV-2 and SARS-related viruses: a first look. RNA. 2020; 26:937–959. - PMC - PubMed
    1. Chan J.F.W., Kok K.H., Zhu Z., Chu H., To K.K.W., Yuan S., Yuen K.Y.. Genomic characterization of the 2019 novel human-pathogenic coronavirus isolated from a patient with atypical pneumonia after visiting Wuhan. Emerg. Microbes Infect. 2020; 9:221–236. - PMC - PubMed
    1. Ishimaru D., Plant E.P., Sims A.C., Yount B.L., Roth B.M., Eldho N. V., Pérez-Alvarado G.C., Armbruster D.W., Baric R.S., Dinman J.D.et al. .. RNA dimerization plays a role in ribosomal frameshifting of the SARS coronavirus. Nucleic Acids Res. 2013; 41:2594–2608. - PMC - PubMed
    1. Yang D., Leibowitz J.L.. The structure and functions of coronavirus genomic 3′ and 5′ ends. Virus Res. 2015; 206:120–133. - PMC - PubMed
    1. Madhugiri R., Fricke M., Marz M., Ziebuhr J.. Coronavirus cis-acting RNA elements. Adv. Virus Res. 2016; 96:127–163. - PMC - PubMed

Publication types