. 2020 Nov 5;9(11):2419.
doi: 10.3390/cells9112419.

Human Adipose Tissue-Derived Stromal Cells Suppress Human, but Not Murine Lymphocyte Proliferation, via Indoleamine 2,3-Dioxygenase Activity

Affiliations

Human Adipose Tissue-Derived Stromal Cells Suppress Human, but Not Murine Lymphocyte Proliferation, via Indoleamine 2,3-Dioxygenase Activity

Adriana Torres Crigna et al. Cells. .

Abstract

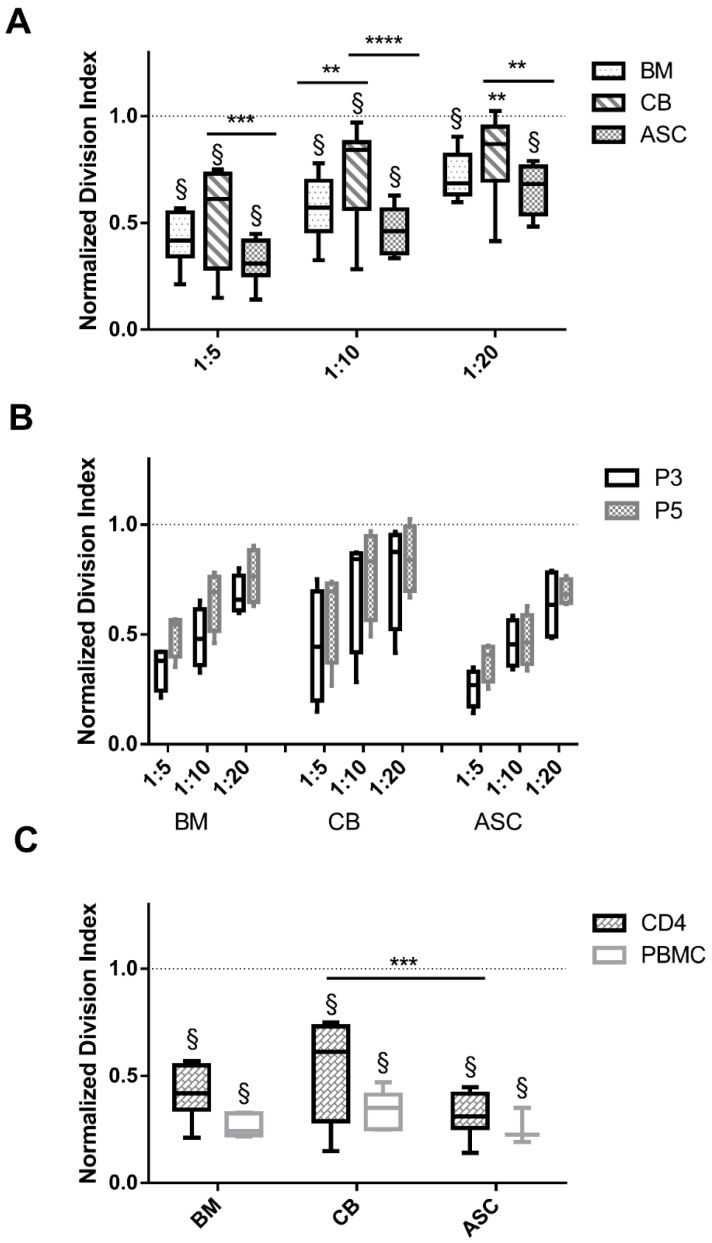
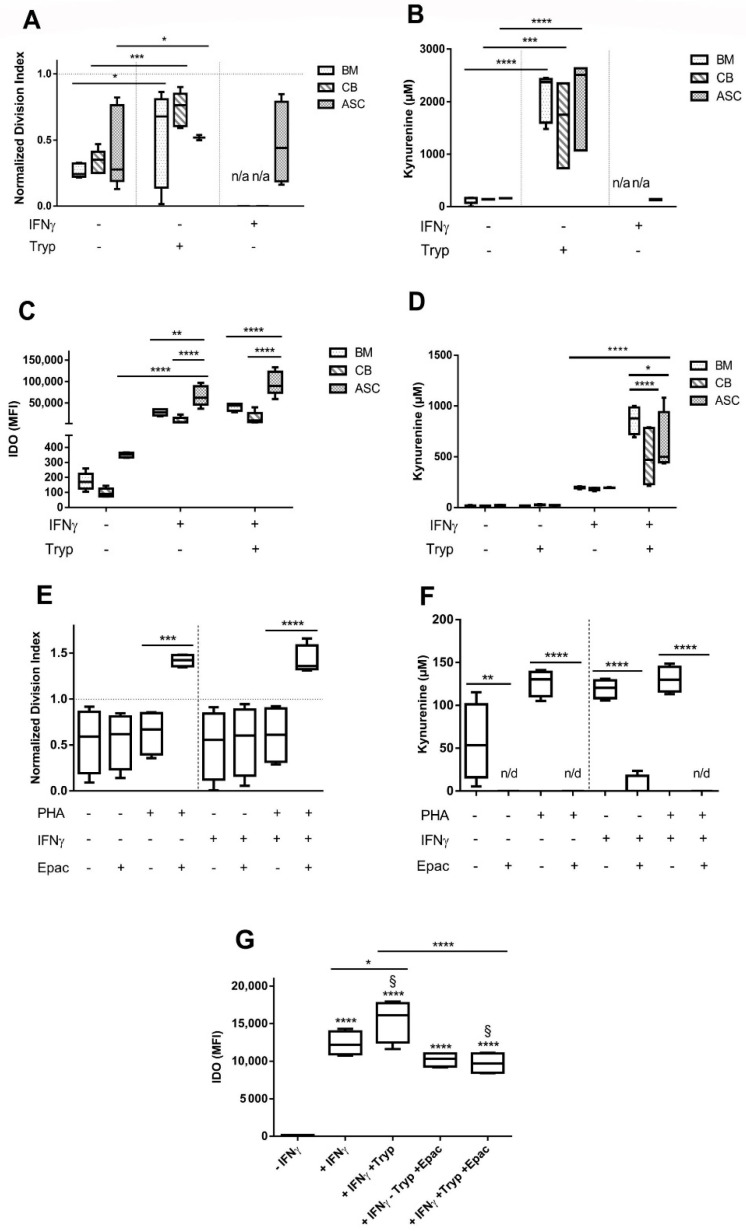
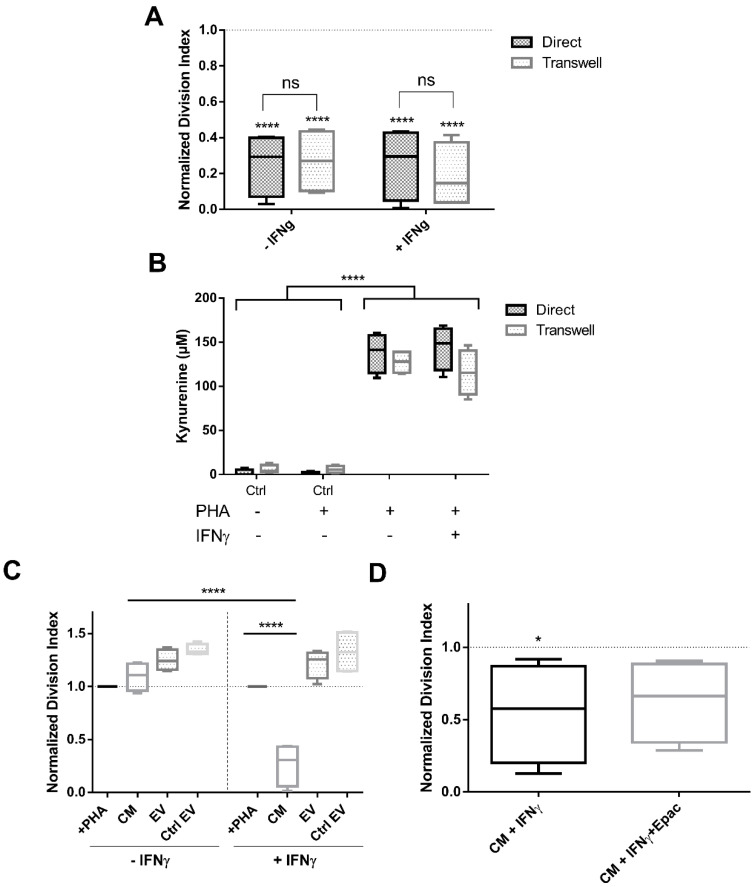
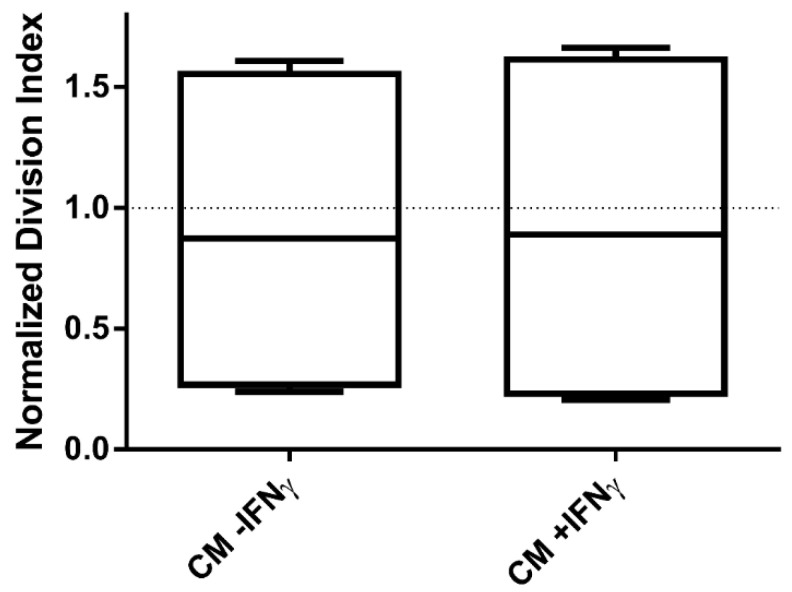
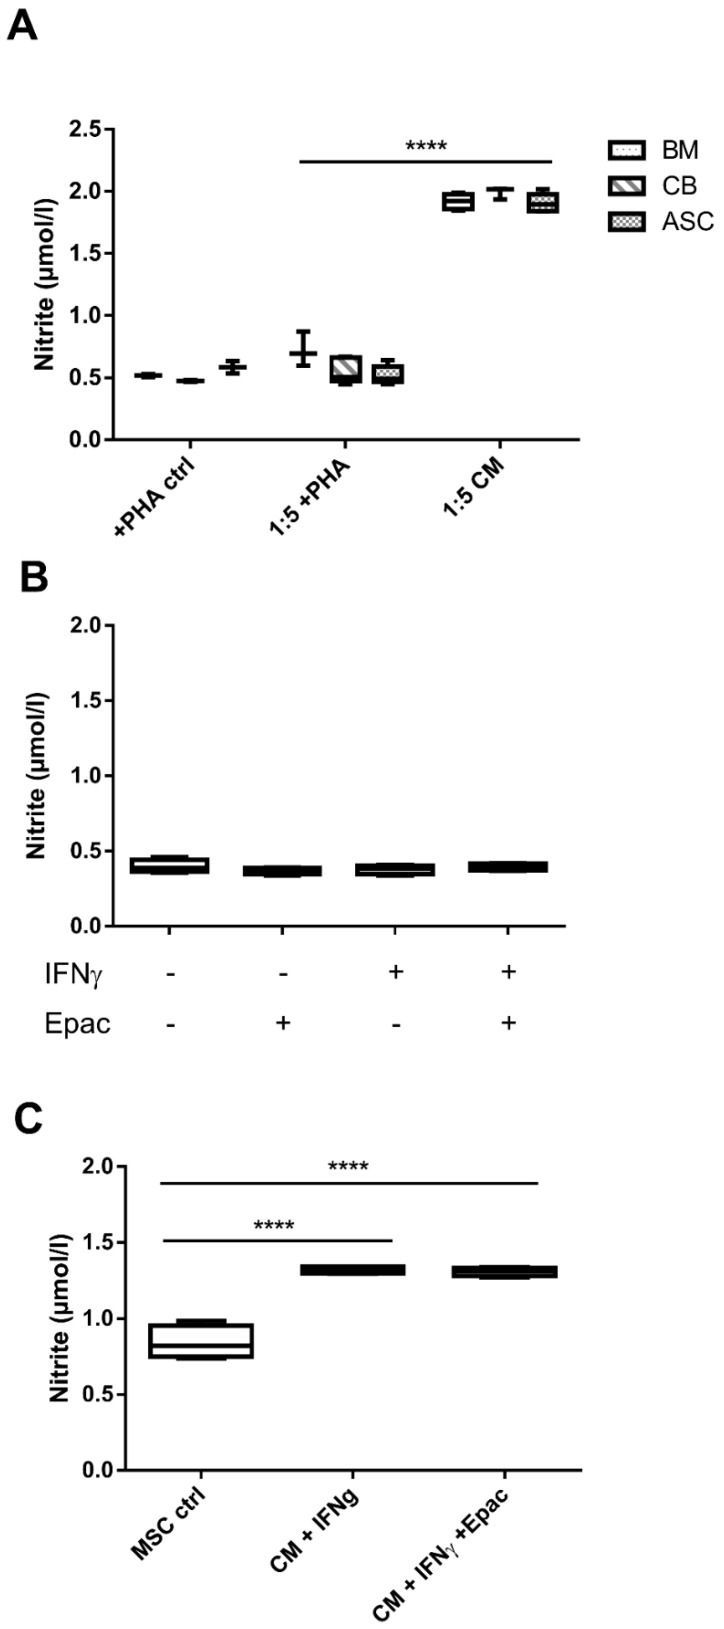
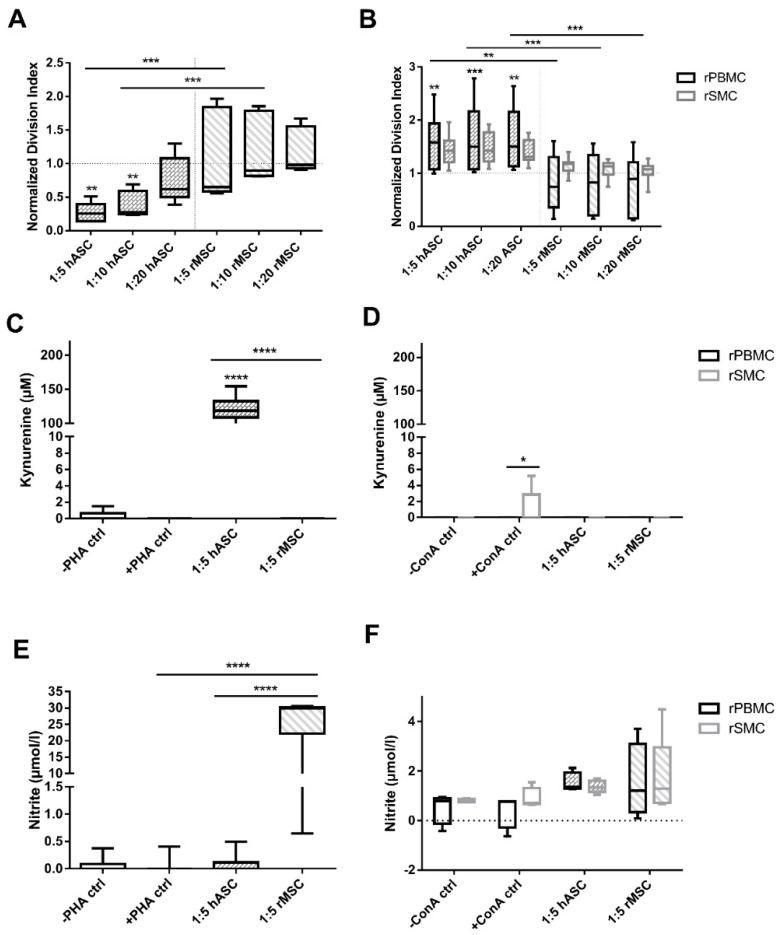
Over recent years, mesenchymal stromal cells (MSC) have gained immense attraction in immunotherapy, regenerative medicine and tissue engineering. MSC microenvironment modulation occurs through synergy of direct cell-cell contact, and secreted soluble factors and extracellular vesicles (EV). MSC-derived EV have been suggested as cell-free immunomodulatory alternative to MSC; however, previous findings have challenged this. Furthermore, recent data suggest that evaluating the mechanism of action of human MSC (hMSC) in animal models might promote adverse immune reactions or lack of functionality due to xeno-incompatibilities. In this study, we first assessed the immunomodulatory strength of different human MSC sources on in vitro stimulated T cells and compared this to interferon-gamma (IFNγ) primed MSC conditioned medium (CM) and EV. Second, we addressed the main molecular mechanisms, and third, we assessed the MSC in vitro immunosuppressive effect across interspecies barriers. We identified human adipose tissue-derived stromal cells (ASC) with strongest immunomodulatory strength, followed by bone marrow (BM) and cord blood-derived MSC (CB). Whilst CM from primed ASC managed to exert analogous effects as their cellular counterpart, EV derived thereof did not, reproducing previous findings. IFNγ-induced indoleamine 2,3-dioxygenase (IDO) activity was identified as key mechanism to suppress human lymphocyte proliferation, as in the presence of the IDO inhibitor epacadostat (Epac) a stimulation of proliferation was seen. In addition, we revealed MSC immunosuppressive effects to be species-specific, because human cells failed to suppress murine lymphocyte proliferation. In summary, ASC were the strongest immunomodulators with the IDO-kynurenine pathway being key within the human system. Importantly, the in vitro lack of interspecies immunomodulatory strength suggests that preclinical data need to be carefully interpreted especially when considering a possible translation to clinical field.

Keywords: IDO; allogeneic; extracellular vesicles; immunomodulation; mesenchymal stromal cells; xenogeneic.


Conflict of interest statement

The authors declare no conflict of interest.

Figures

Figure 1
Figure 1
ASC suppress PHA-induced T cell proliferation to a stronger extent than BM or CB-MSC, independent of passage number and CD4 or PBMC population. (A) PBMC division index in cocultures with BM, CB and ASC in three different ratios (1:5, 1:10 and 1:20), indicates ASC as stronger immunosuppressors. (B) MSC inhibitory potential in P3 and P5 does not differ (n.s., 2-way ANOVA). (C) CD4+ T cell and PBMC division index is not impacted (n.s., 2-way ANOVA). Dotted lines represent the normalized division index of the positive control (only PBMC stimulated with PHA: +PHA control). Box: interquartile range; whiskers: minimum to maximum; line: median. Asterisks depicted at the top of the lines represent the significance of the individual value with respect to their own condition control (** p < 0.01, *** p < 0.001, **** p < 0.0001) Symbol § represents the significance of the individual conditions with respect to their +PHA control (§: p < 0.0001, 2-way ANOVA). n = 4 to 8, different MSC isolates and different PBMC isolates.
Figure 2
Figure 2
IDO expression is induced by IFNγ stimulation and further increased with the addition of tryptophan, which in turn largely abrogates MSC inhibitory potential. (A) MSC:PBMC cocultures were set with BM, CB and ASC cells. Addition of IFNγ and Tryp were tested, n = 5 to 8. (B) Kynurenine coculture concentrations measured in presence of IFNγ and Tryp, n= 5 to 8. (C) IDO production is significantly increased when MSC are stimulated with IFNγ, n = 5. (D) Kynurenine concentrations measured in MSC monocultures after IFNγ addition are increased, n = 5. (E) ASC:PBMC cocultures were set with the addition of IDO inhibitor, Epacadostat, n = 4. (F) Kynurenine coculture concentrations completely abolished in presence of Epacadostat, n = 4. (G) IDO secretion in MSC monocultures is reduced when adding Epacadostat (p < 0.0001, 2-way ANOVA), n = 4. Box: interquartile range; whiskers: minimum to maximum; line: median. Dotted lines represent the normalisation referred to the positive control. Asterisks depicted at the top of the lines represent the significance of the individual value with respect to their own condition control (* p < 0.05, ** p < 0.01, *** p < 0.001, **** p < 0.0001). Symbol § represents the significance of the individual conditions with respect to their positive control (§: p < 0.0001, 2-way ANOVA). Lines with asterisks depict the significance between two conditions.
Figure 3
Figure 3
PBMC were equally inhibited in direct and transwell cocultures, although EV failed to suppress their proliferation regardless of IFNγ pre-stimulation. (A) PBMC division index evaluation in direct and transwell culture conditions, n = 4. (B) Kynurenine concentrations measured in direct and transwell coculture supernatants, n = 4. (C) Cocultures with CM and EV isolated from stimulated and not stimulated ASC, n = 4. (D) Cultures with CM +IFNγ together with the addition of IDO inhibitor Epacadostat, n = 4. Box: interquartile range; whiskers: minimum to maximum; line: median. Dotted lines represent the normalisation referred to the positive control. Asterisks depicted at the top of the lines represent the significance of the individual value with respect to their own control. Lines with asterisks depict the significance between two conditions (n.s. p ≥ 0.05, * p < 0.05, **** p < 0.0001).
Figure 4
Figure 4
CM transferred from a previous coculture was ineffective in exerting PBMC inhibition. PBMC division index after transferring CM from a 5 day ASC:PBMC coculture (−/+ IFNγ), was analysed. n = 4. Box: interquartile range; whiskers: minimum to maximum; line: median.
Figure 5
Figure 5
Nitrite concentrations were detectable only in MSC-CM. (A) Nitrite concentration levels measured in BM, CB and ASC coculture supernatants. All MSC sources have comparable nitrite production concentration levels, n = 3 to 5. (B) Nitrite concentration in coculture supernatants with IFNγ and Epacadostat addition, n = 4. (C) Nitrite levels measured in CM +IFNγ after addition of IDO inhibitor Epacadostat, n = 4. Box: interquartile range; whiskers: minimum to maximum; line: median. Lines with asterisks depict the significance between two conditions (**** p < 0.0001).
Figure 6
Figure 6
ASC are able to inhibit hPBMC proliferation, but not rPBMC, however, rMSC slightly suppress hPBMC and inhibit blood-derived rPBMC to a higher extent than rSMC. (A) Cocultures with hPBMC and hMSC (ASC) and rMSC. ASC inhibited hPBMC in a dose dependent manner, n = 5. (B) rPBMC and rSMC cocultures with hMSC and rMS, n = 8 to 10. (C) Kynurenine concentrations in hPBMC:ASC or rMSC coculture supernatants, n= 3 to 10. (D) Kynurenine concentrations in rPBMC or rSMC:ASC or rMSC coculture supernatants, n = 5 (E) Nitrite concentration measured in cocultures with hPBMC, n = 3 to 10. (F) Nitrite concentrations in rPBMC or rSMC:ASC or rMSC coculture supernatants, n = 4 to 6. Box: interquartile range; whiskers: minimum to maximum; line: median. Dotted lines represent the normalisation referred to the positive control. Asterisks depicted at the top of the bars represent the significance of the individual value with respect to their own control. Lines with asterisks depict the significance between two conditions. (* p < 0.05, ** p < 0.01; *** p < 0.005, **** p < 0.0001).

References

    1. Kern S., Eichler H., Stoeve J., Kluter H., Bieback K. Comparative analysis of mesenchymal stem cells from bone marrow, umbilical cord blood, or adipose tissue. Stem Cells. 2006;24:1294–1301. doi: 10.1634/stemcells.2005-0342. - DOI - PubMed
    1. Mattar P., Bieback K. Comparing the Immunomodulatory Properties of Bone Marrow, Adipose Tissue, and Birth-Associated Tissue Mesenchymal Stromal Cells. Front. Immunol. 2015;6:560. doi: 10.3389/fimmu.2015.00560. - DOI - PMC - PubMed
    1. Hass R., Kasper C., Bohm S., Jacobs R. Different populations and sources of human mesenchymal stem cells (MSC): A comparison of adult and neonatal tissue-derived MSC. Cell Commun Signal. 2011;9:12. doi: 10.1186/1478-811X-9-12. - DOI - PMC - PubMed
    1. Ketterl N., Brachtl G., Schuh C., Bieback K., Schallmoser K., Reinisch A., Strunk D. A robust potency assay highlights significant donor variation of human mesenchymal stem/progenitor cell immune modulatory capacity and extended radio-resistance. Stem Cell Res. Ther. 2015;6:236. doi: 10.1186/s13287-015-0233-8. - DOI - PMC - PubMed
    1. Gao F., Chiu S.M., Motan D.A., Zhang Z., Chen L., Ji H.L., Tse H.F., Fu Q.L., Lian Q. Mesenchymal stem cells and immunomodulation: Current status and future prospects. Cell Death Dis. 2016;7:e2062. doi: 10.1038/cddis.2015.327. - DOI - PMC - PubMed

Publication types

MeSH terms