. 2020 Nov 5;12(11):3270.
doi: 10.3390/cancers12113270.

Integration and Comparison of Transcriptomic and Proteomic Data for Meningioma

Affiliations

Integration and Comparison of Transcriptomic and Proteomic Data for Meningioma

Jemma Dunn et al. Cancers (Basel). .

Abstract

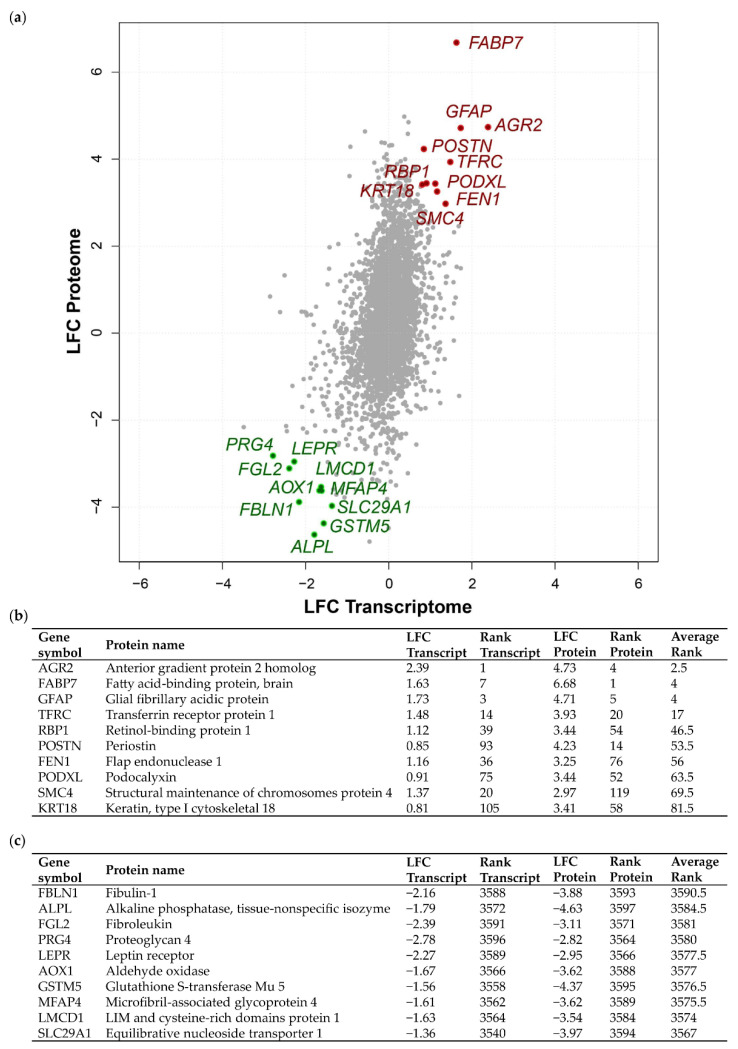
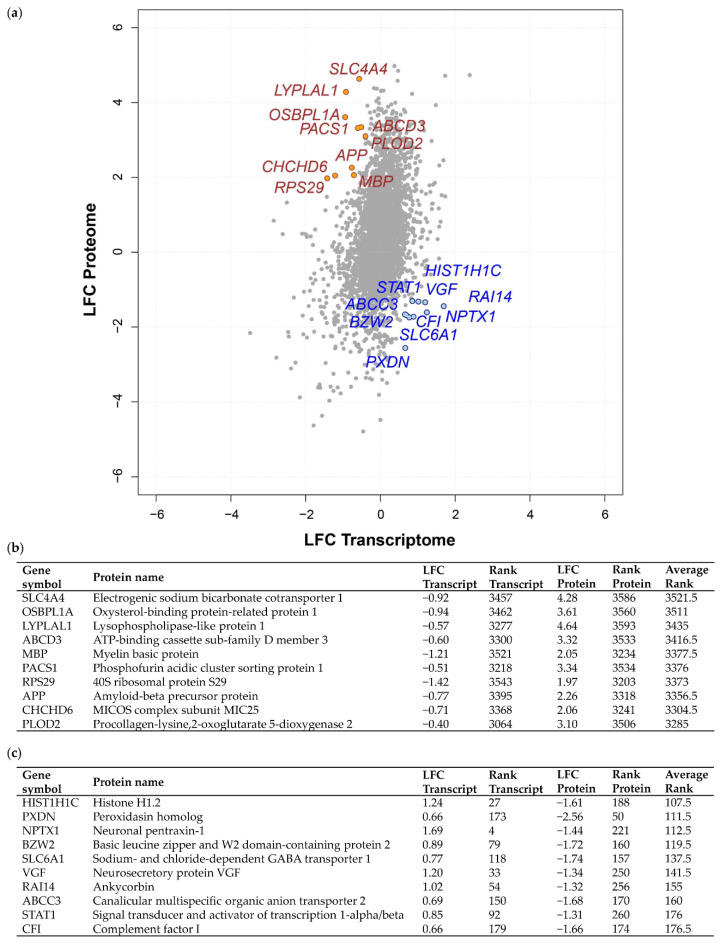
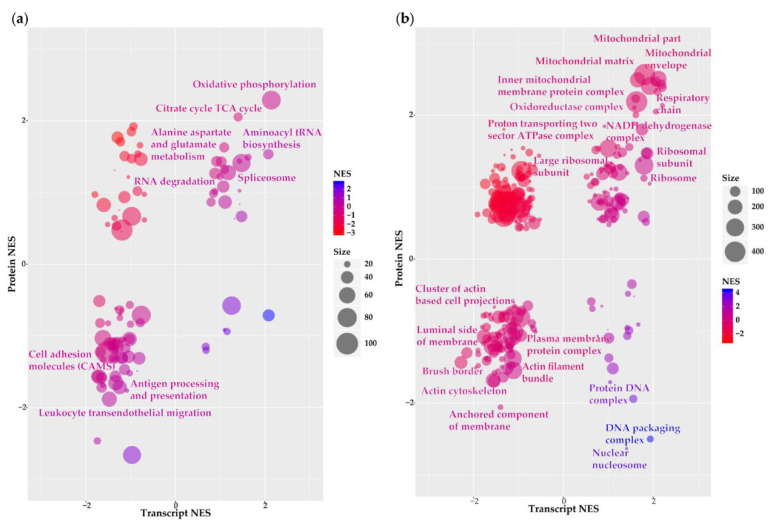
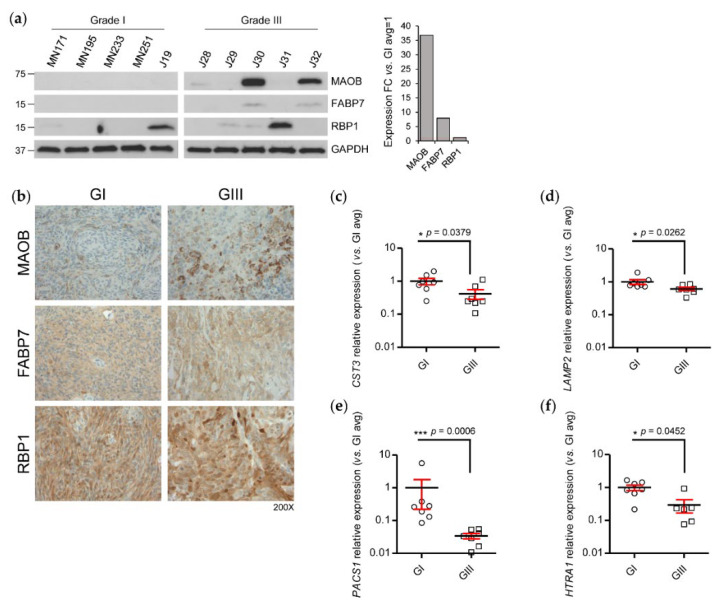
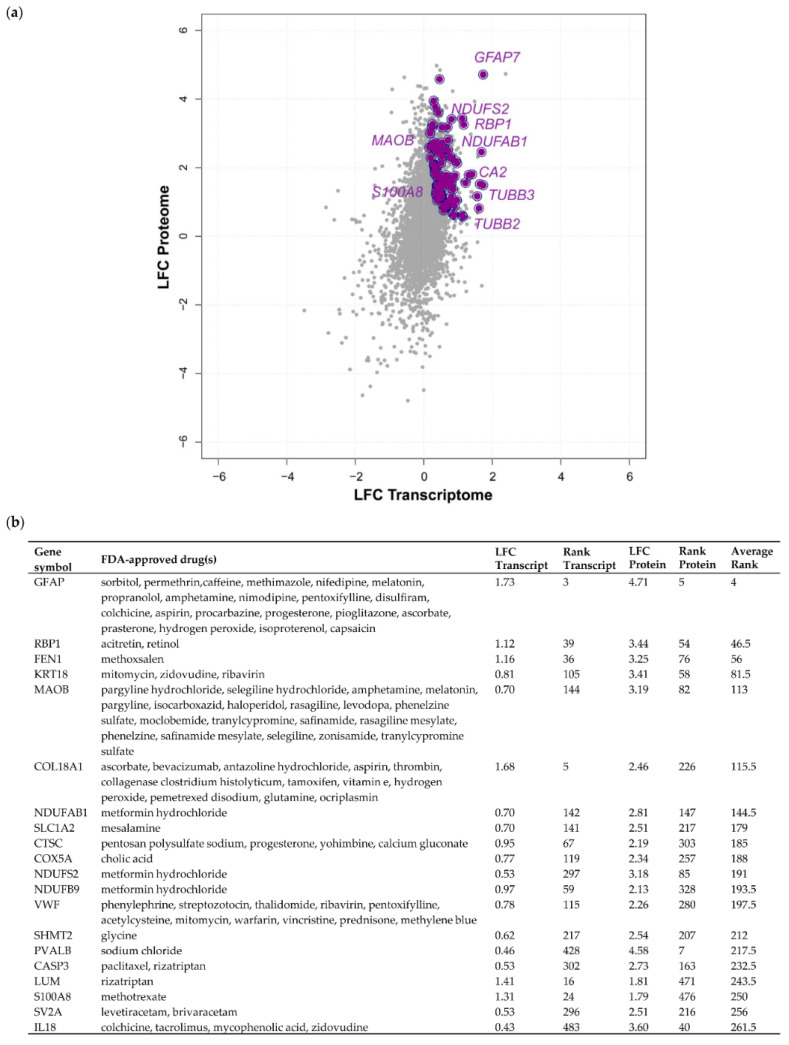
Meningioma are the most frequent primary intracranial tumour. Management of aggressive meningioma is complex, and development of effective biomarkers or pharmacological interventions is hampered by an incomplete knowledge of molecular landscape. Here, we present an integrated analysis of two complementary omics studies to investigate alterations in the "transcriptome-proteome" profile of high-grade (III) compared to low-grade (I) meningiomas. We identified 3598 common transcripts/proteins and revealed concordant up- and downregulation in grade III vs. grade I meningiomas. Concordantly upregulated genes included FABP7, a fatty acid binding protein and the monoamine oxidase MAOB, the latter of which we validated at the protein level and established an association with Food and Drug Administration (FDA)-approved drugs. Notably, we derived a plasma signature of 21 discordantly expressed genes showing positive changes in protein but negative in transcript levels of high-grade meningiomas, including the validated genes CST3, LAMP2, PACS1 and HTRA1, suggesting the acquisition of these proteins by tumour from plasma. Aggressive meningiomas were enriched in processes such as oxidative phosphorylation and RNA metabolism, whilst concordantly downregulated genes were related to reduced cellular adhesion. Overall, our study provides the first transcriptome-proteome characterisation of meningioma, identifying several novel and previously described transcripts/proteins with potential grade III biomarker and therapeutic significance.

Keywords: MAOB; biomarker; data integration; drug targets; meningioma; proteomics; transcriptomics.


Conflict of interest statement

The authors declare no conflict of interest. The funders had no role in the design of the study; in the collection, analyses, or interpretation of data; in the writing of the manuscript, or in the decision to publish the results.

Figures

Figure 1
Figure 1
Concordant transcriptome–proteome differential expression of grade III vs. grade I meningiomas. (a) Scatterplot displaying 3598 genes commonly identified in a transcriptomic microarray analysis including 13 non-recurrent grade I meningiomas and 20 malignant grade III meningiomas and a global proteomic analysis including eight grade I and six grade III meningiomas [12,19]. Pearson’s correlation coefficient revealed a modest, yet highly significant correlation of r = 0.35, p = 3.6 × 10−104. Log2 fold changes (LFC) at the transcript and protein level of overlapping genes are shown for grade III vs. grade I meningiomas. The top 10 genes based on average rank value exhibiting concordantly increased or decreased LFC between the two datasets are highlighted in red or green, respectively. (b,c) Top 10 genes showing concordantly increased (b) or decreased (c) LFC in grade III vs. grade I meningiomas are presented with respective LFC, rank and average rank values. Table S3A provides details of all 3598 genes common to both analyses, transcript/protein LFC, their rank and average rank.
Figure 2
Figure 2
Discordant transcriptome–proteome differential expression of grade III vs. grade I meningiomas. (a) Scatterplot displaying 3598 genes commonly identified in a transcriptomic microarray analysis including 13 non-recurrent grade I meningiomas and 28 malignant grade III meningiomas and a global proteomic analysis including eight grade I and six grade III meningiomas [12,19]. Log2 fold changes (LFC) at the transcript and protein level of overlapping genes are shown for grade III vs. grade I meningioma. The top 10 genes based on average rank value exhibiting either a negative transcript LFC and positive protein LFC (high average rank value) or a positive transcript LFC and negative protein LFC (low average rank value) are highlighted in yellow and blue, respectively. (b,c) Top 10 genes showing discordant differential expression with negative transcript LFC and positive protein LFC (b) or positive transcript LFC and negative protein LFC (c) in grade III vs. grade I meningiomas are presented with respective LFC, rank and average rank values. Table S3B provides details of all 3598 genes common to both analyses, transcript/protein LFC, their discordant rank value and average rank. Protein LFC values were ranked in ascending order (lowest LFC assigned rank of 1), transcript LFC values ranked in descending order and average rank calculated.
Figure 3
Figure 3
Functional annotation of grade III vs. grade I meningioma transcriptome–proteome. (a) Kyoto Encyclopaedia of Genes and Genomes (KEGG) pathway analysis and (b) gene ontology (GO) analysis of cellular component terms presenting enriched pathways/cellular components overlapping between transcript and protein datasets. Bubble plots show normalised enrichment scores (NES) of pathways/cellular components derived from Gene Set Enrichment Analysis (GSEA) of genes ranked by transcript and protein LFCs. Size and colour of each bubble represent the number of differentially expressed genes enriched in the pathway and the combined transcript and protein NES, respectively. Highlighted are pathways/cellular components with false discovery rate (FDR) < 0.2 for both transcript and protein NES. Table S4 details KEGG pathway and GO cellular component output.
Figure 4
Figure 4
Validation of concordantly and discordantly expressed differentially expressed proteins and transcripts in grade III vs. grade I meningiomas. (a) Western blot (WB) analysis of the proteins MAOB, FABP7 and RBP1 that demonstrated a concordant increase in expression following transcriptome–proteome integration in meningioma tissue lysates. WB quantification of average densities of MAOB, FABP7 and RBP1 in grade III meningioma compared to average densities in grade I is shown. GAPDH was used as loading control. Grade I n = 5, grade III n = 5. (b) Immunohistochemistry validation of MAOB, FABP7 and RBP1. Representative images show immunohistochemical staining in grade I and grade III meningioma. Table S5 details the full list of specimens and corresponding semi-quantitative assessment. Grade I n = 10, grade III n = 10. RT-qPCR validation of discordantly expressed transcripts (c) CST3 (d) LAMP2 (e) PACS1 and (f) HTRA1 that exhibited negative transcript but positive protein LFC in grade III meningioma compared to grade I following transcriptome–proteome integration. Grade I n = 7, grade III n = 7. Statistical significance was determined by Mann–Whitney test * p ≤ 0.05; *** p ≤ 0.001.
Figure 5
Figure 5
The druggable grade III meningioma proteome. (a) Proteins with increased concordant expression in grade III vs. grade I meningiomas also associated with Food and Drug Administration (FDA)-approved drugs are displayed. (b) Top 20 concordantly expressed proteins based on average rank value and their associated FDA-approved drugs following submission to the drug–gene interaction database (DGIdb, v3.0). Table S6 provides details of transcripts/proteins associated with FDA-approved drugs.

References

    1. Louis D.N., Ohgaki H., Wiestler O.D., Cavenee W.K. WHO Classification of Tumours of the Central Nervous System. 4th ed. Volume 1. International Agency for Research on Cancer; Lyon, France: 2016. p. 408.
    1. Marosi C., Hassler M., Roessler K., Reni M., Sant M., Mazza E., Vecht C. Meningioma. Crit. Rev. Oncol. Hematol. 2008;67:153–171. doi: 10.1016/j.critrevonc.2008.01.010. - DOI - PubMed
    1. Apra C., Peyre M., Kalamarides M. Current treatment options for meningioma. Expert Rev. Neurother. 2018;18:241–249. doi: 10.1080/14737175.2018.1429920. - DOI - PubMed
    1. Brodbelt A.R., Barclay M.E., Greenberg D., Williams M., Jenkinson M.D., Karabatsou K. The outcome of patients with surgically treated meningioma in England: 1999-2013. A cancer registry data analysis. Br. J. Neurosurg. 2019;33:641–647. doi: 10.1080/02688697.2019.1661965. - DOI - PubMed
    1. Peyre M., Gauchotte G., Giry M., Froehlich S., Pallud J., Graillon T., Bielle F., Cazals-Hatem D., Varlet P., Figarella-Branger D., et al. De novo and secondary anaplastic meningiomas: A study of clinical and histomolecular prognostic factors. Neuro. Oncol. 2018;20:1113–1121. doi: 10.1093/neuonc/nox231. - DOI - PMC - PubMed