. 2020 Nov 9;21(1):509.
doi: 10.1186/s12859-020-03809-7.

DeepCryoPicker: fully automated deep neural network for single protein particle picking in cryo-EM

Affiliations

DeepCryoPicker: fully automated deep neural network for single protein particle picking in cryo-EM

Adil Al-Azzawi et al. BMC Bioinformatics. .

Abstract

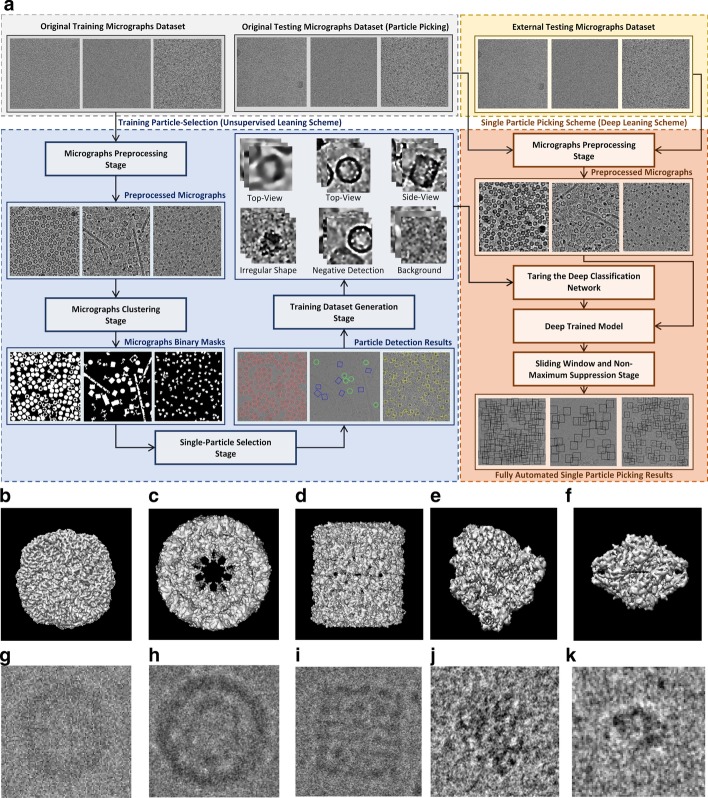
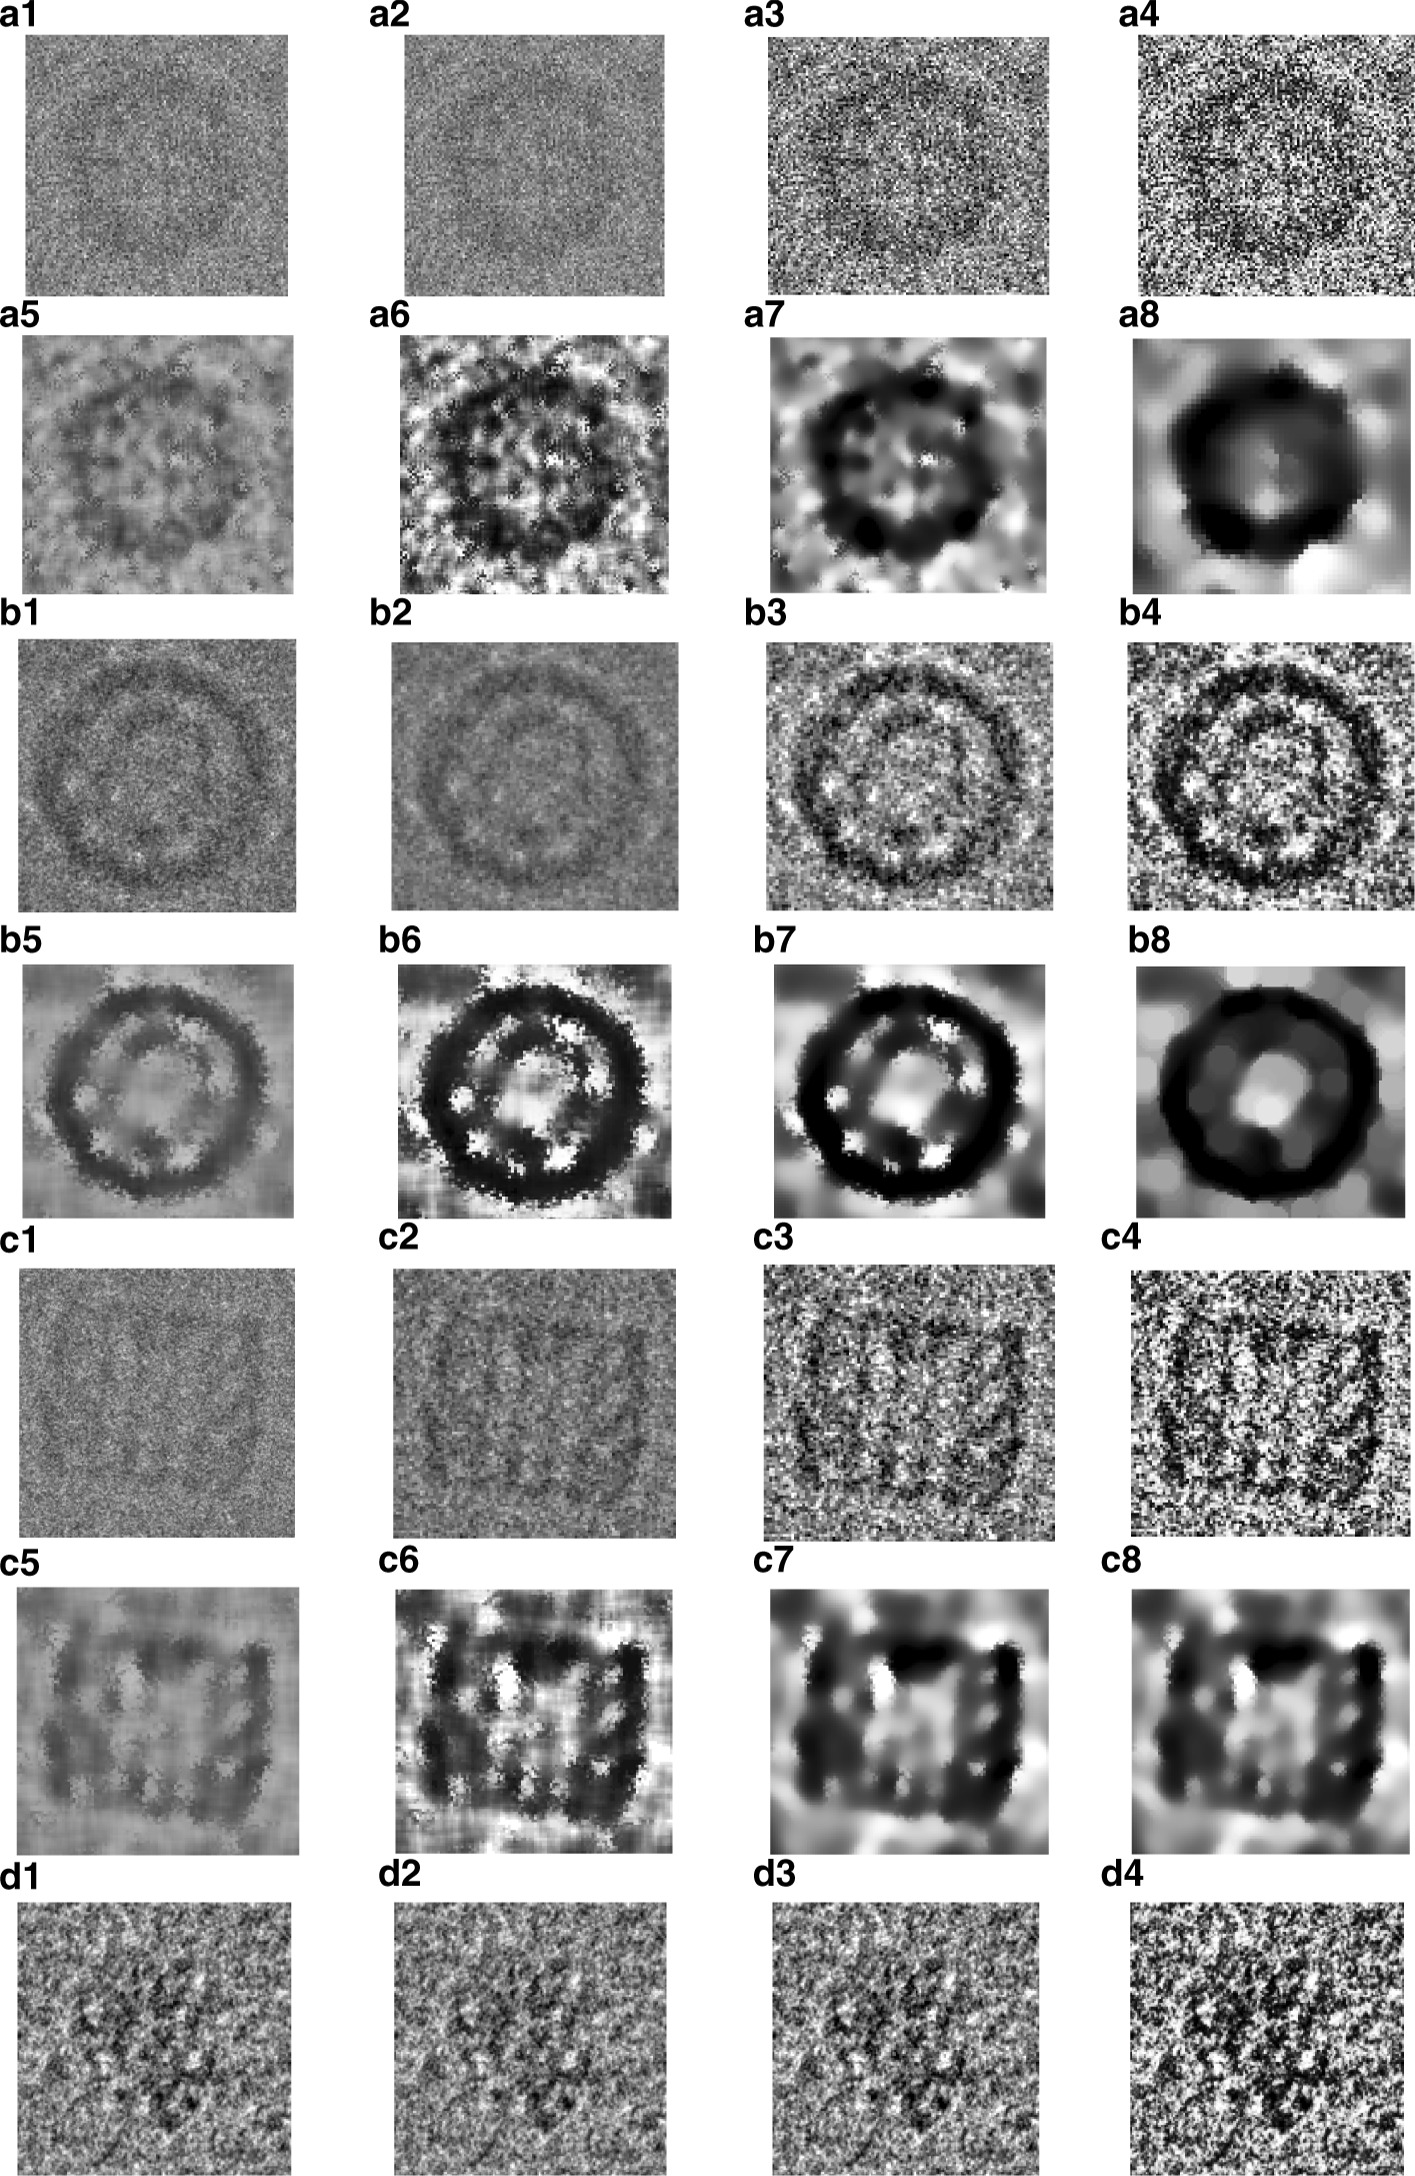
Background: Cryo-electron microscopy (Cryo-EM) is widely used in the determination of the three-dimensional (3D) structures of macromolecules. Particle picking from 2D micrographs remains a challenging early step in the Cryo-EM pipeline due to the diversity of particle shapes and the extremely low signal-to-noise ratio of micrographs. Because of these issues, significant human intervention is often required to generate a high-quality set of particles for input to the downstream structure determination steps.

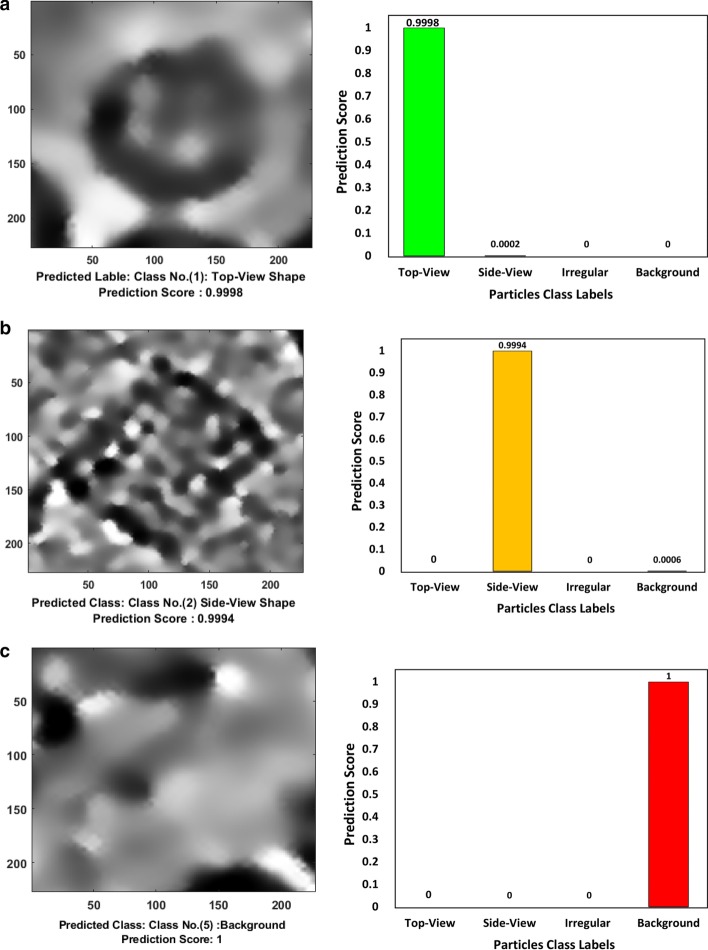
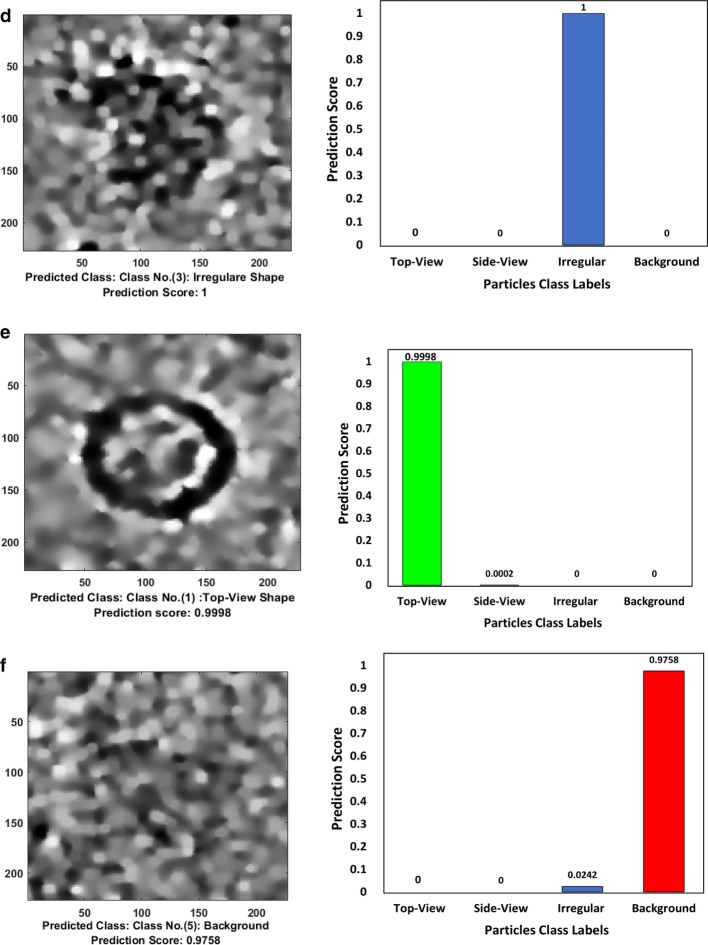
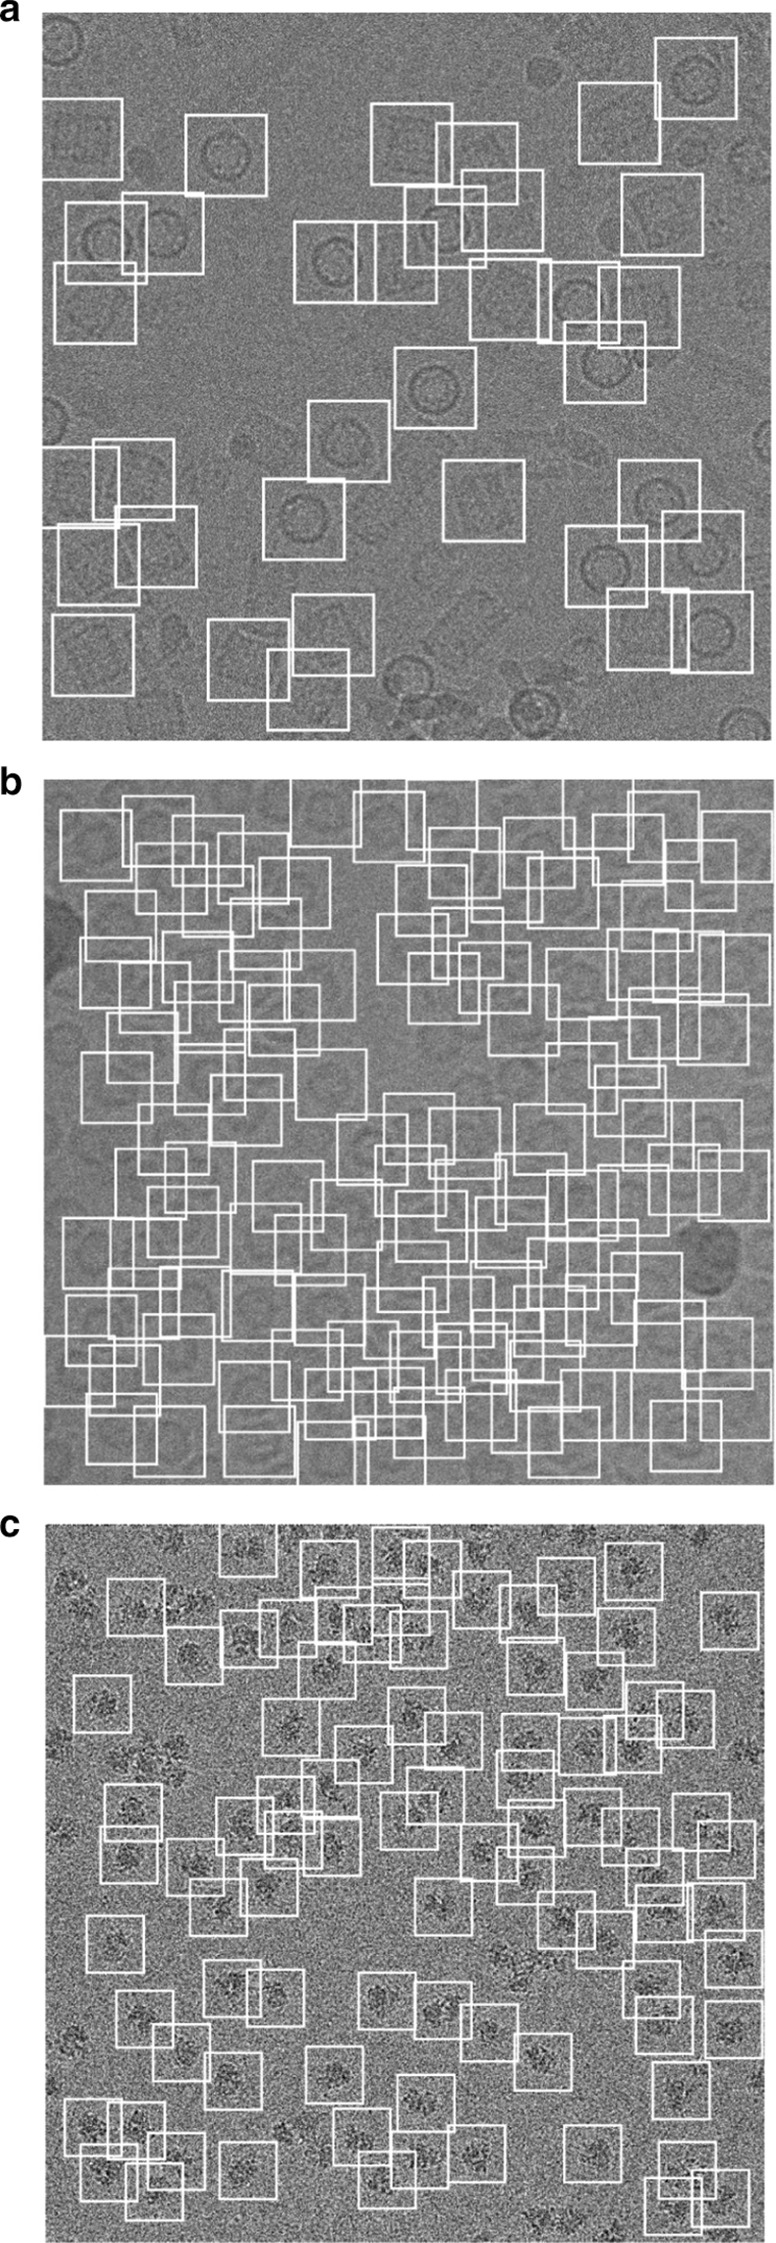
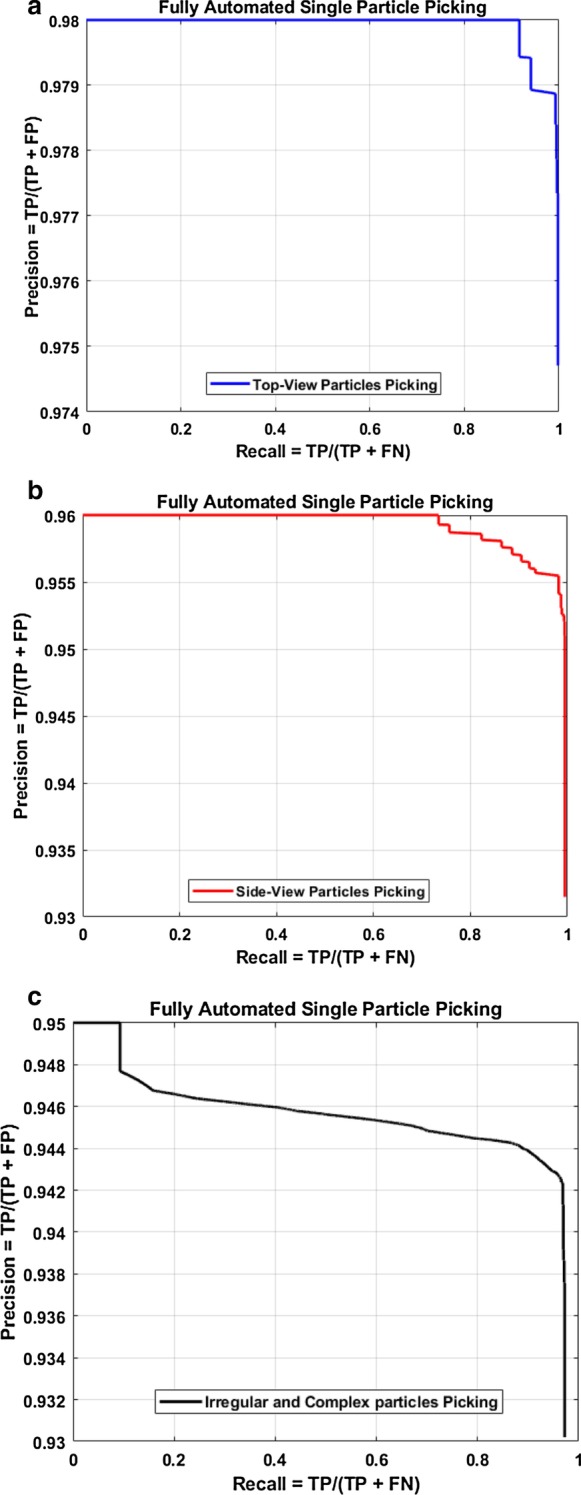
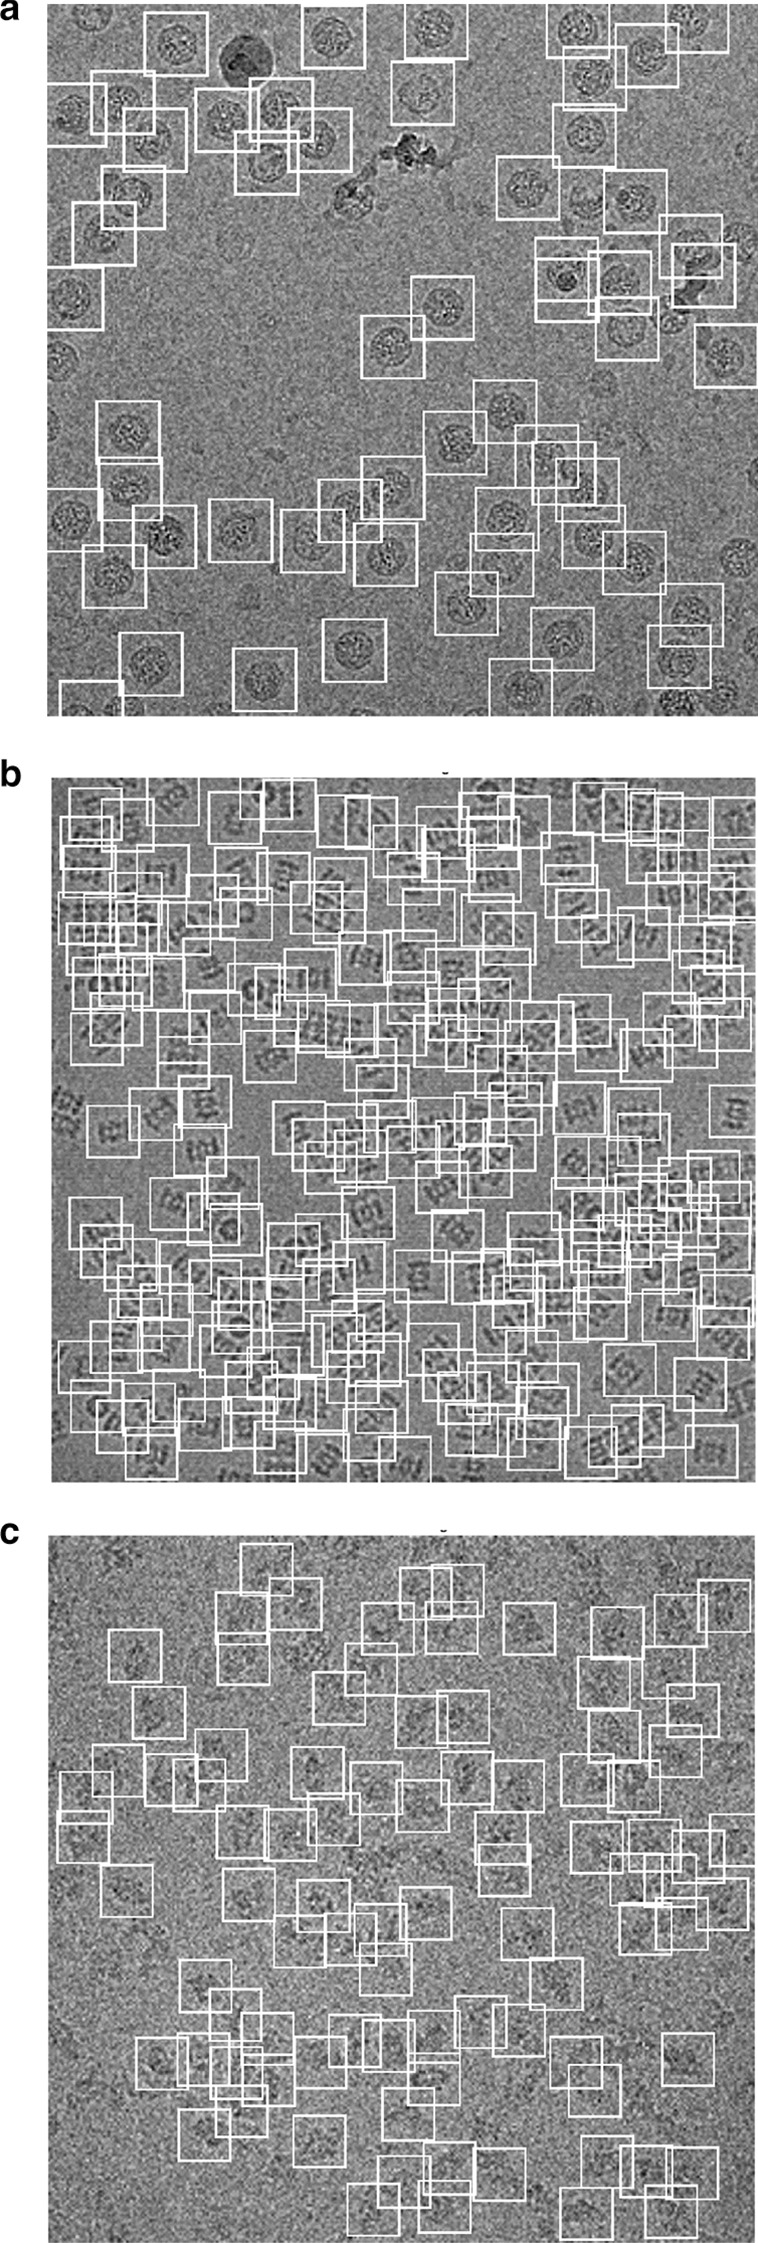
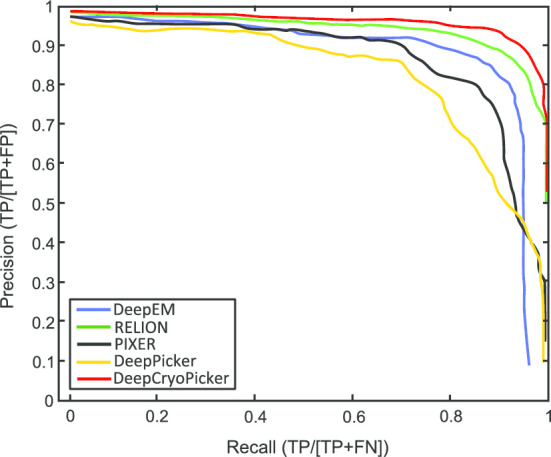
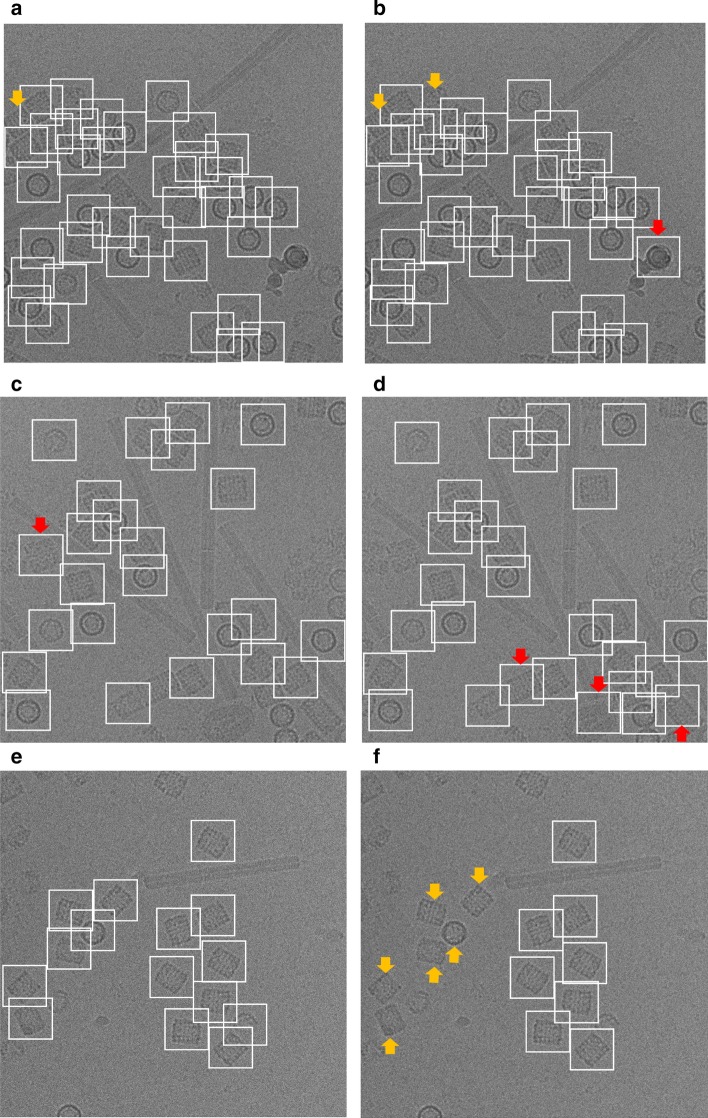
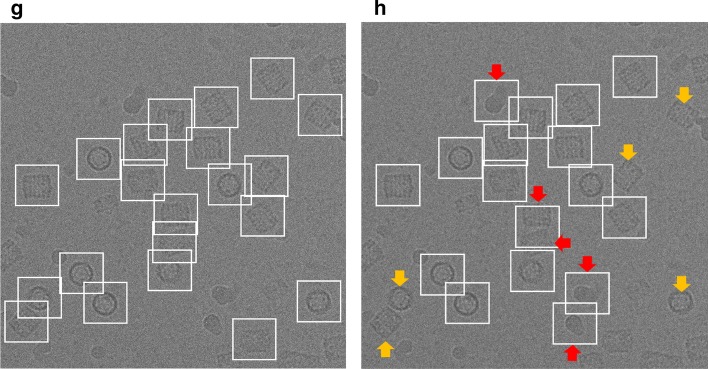
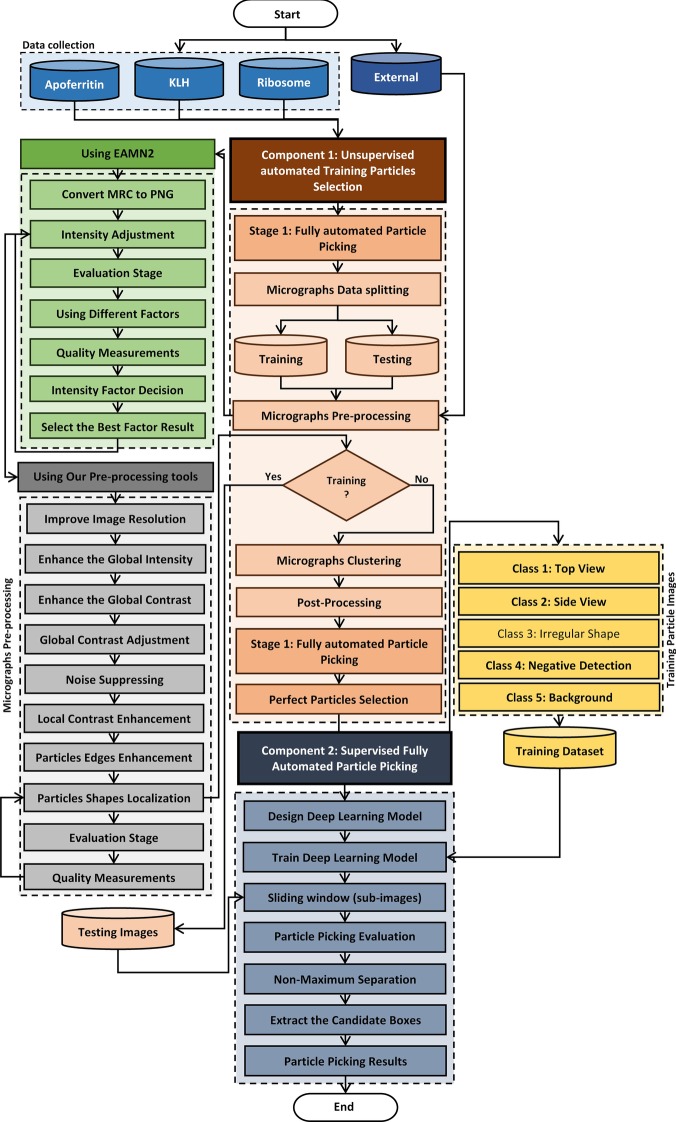
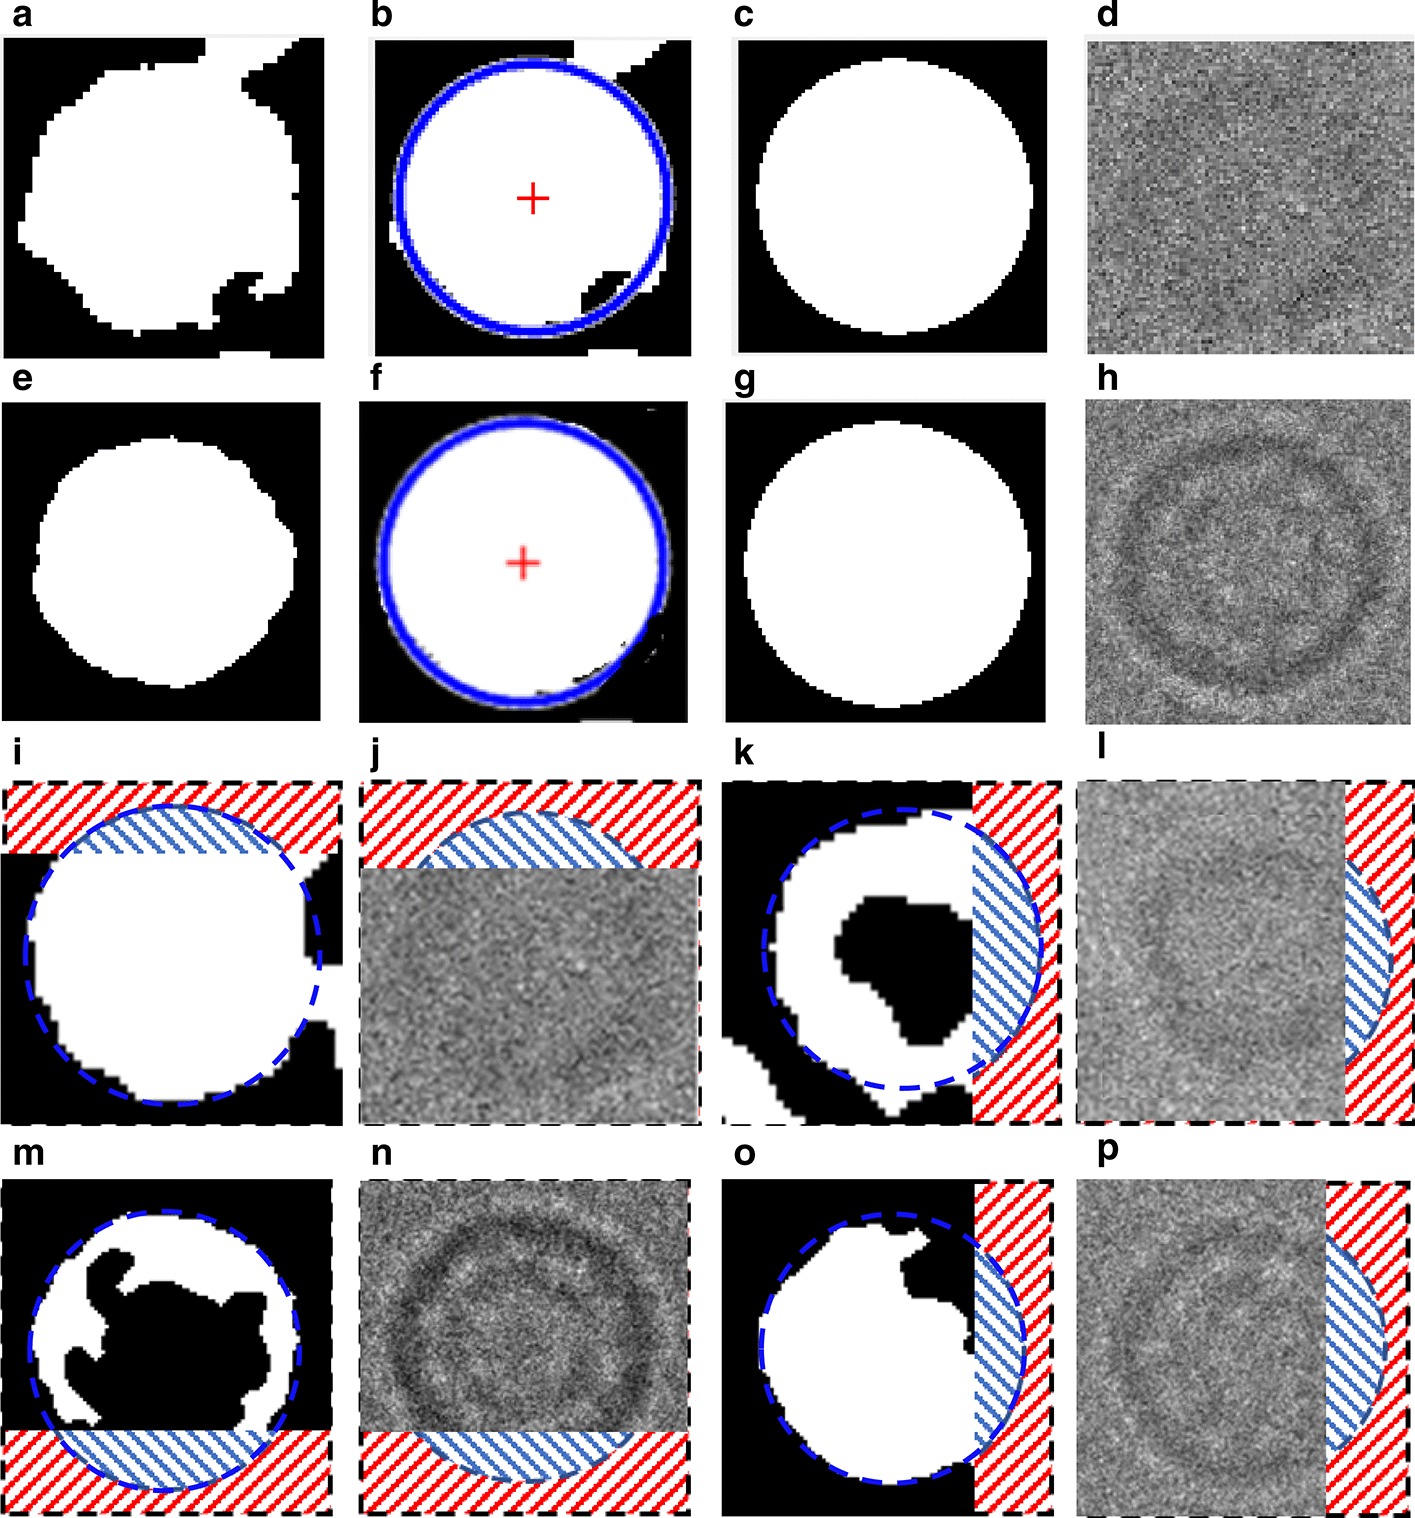
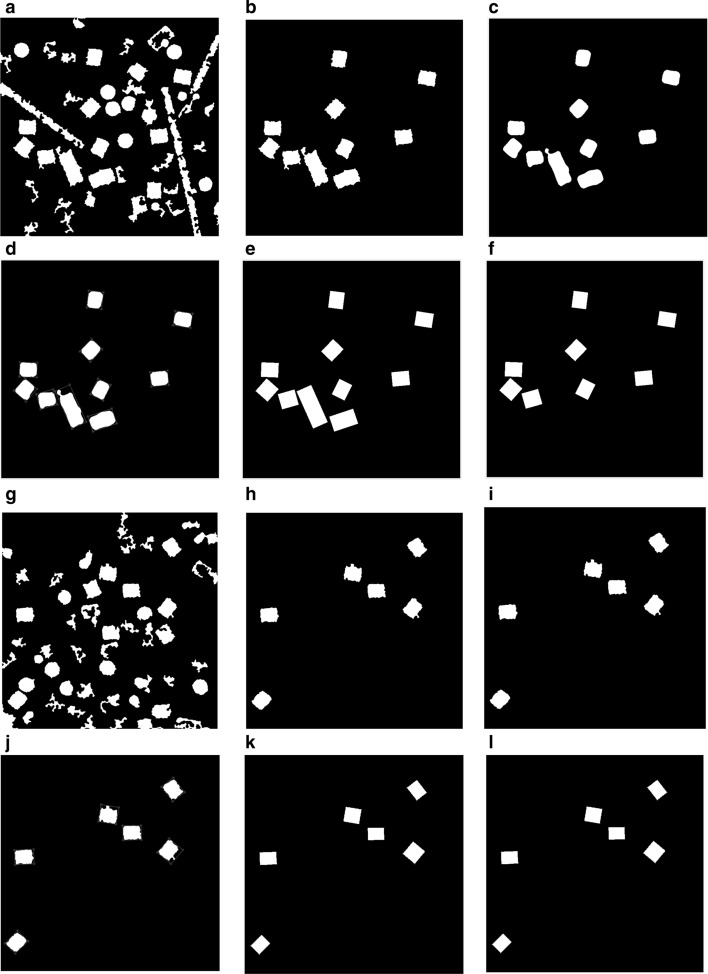
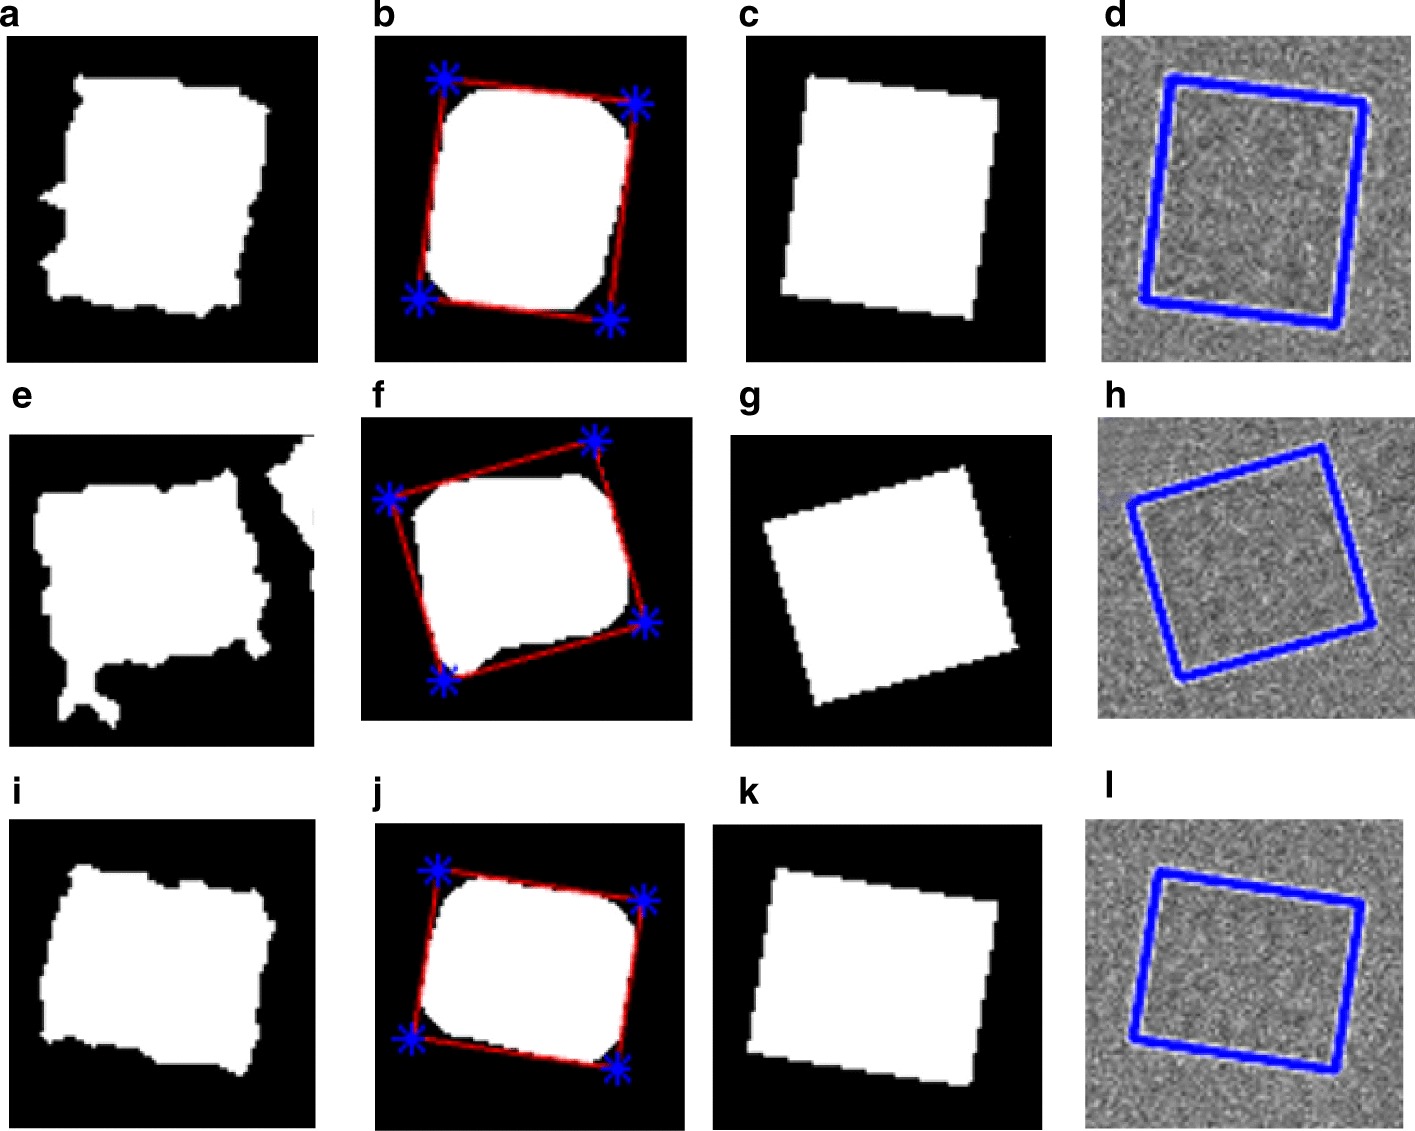
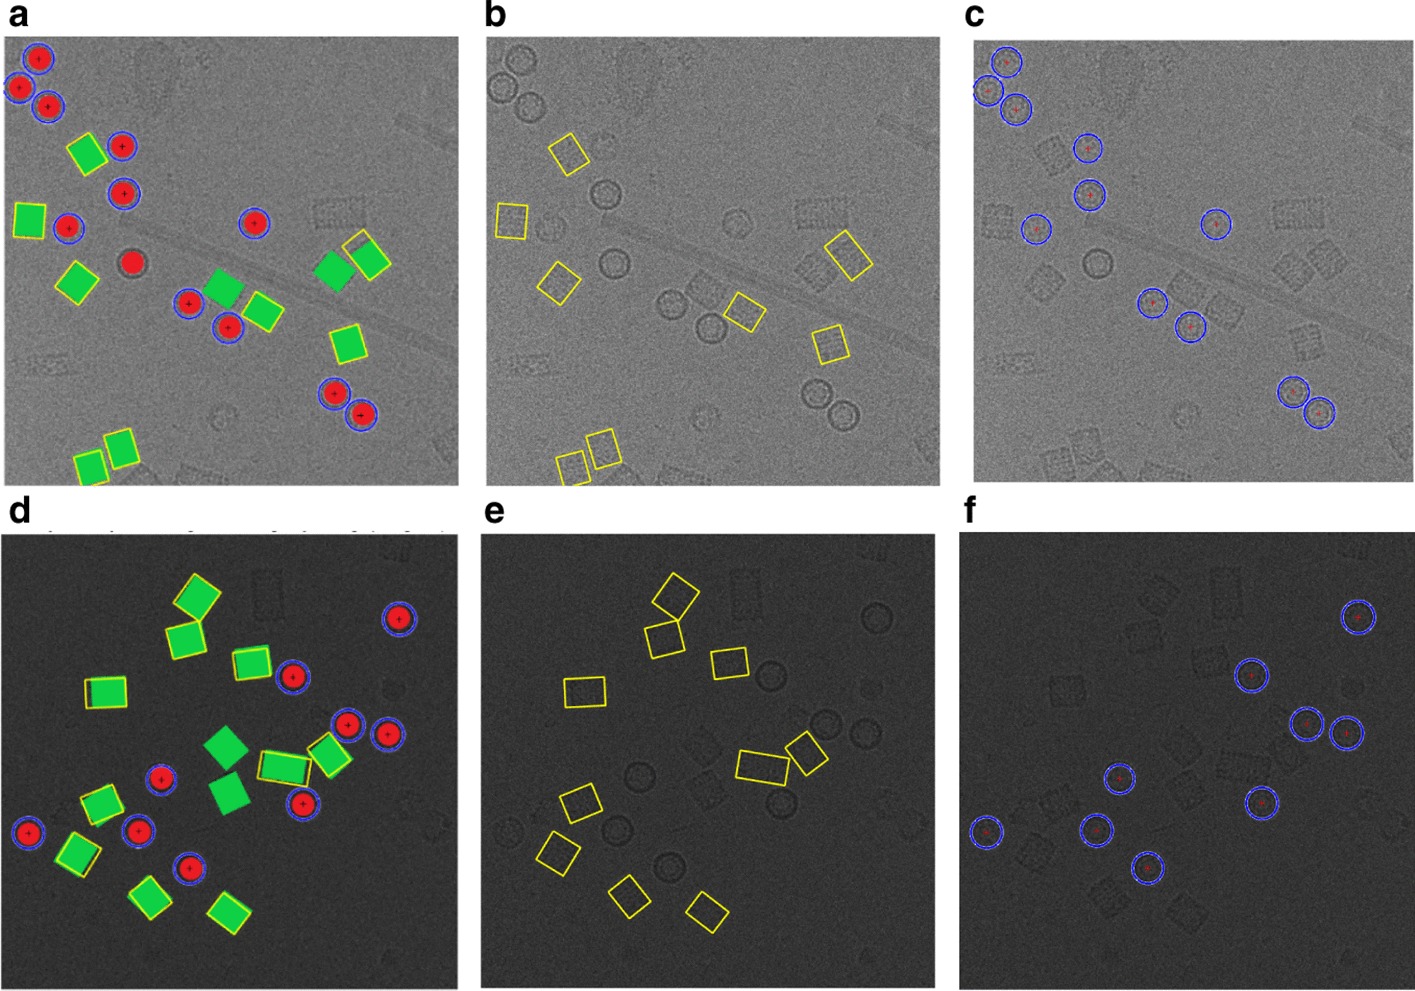
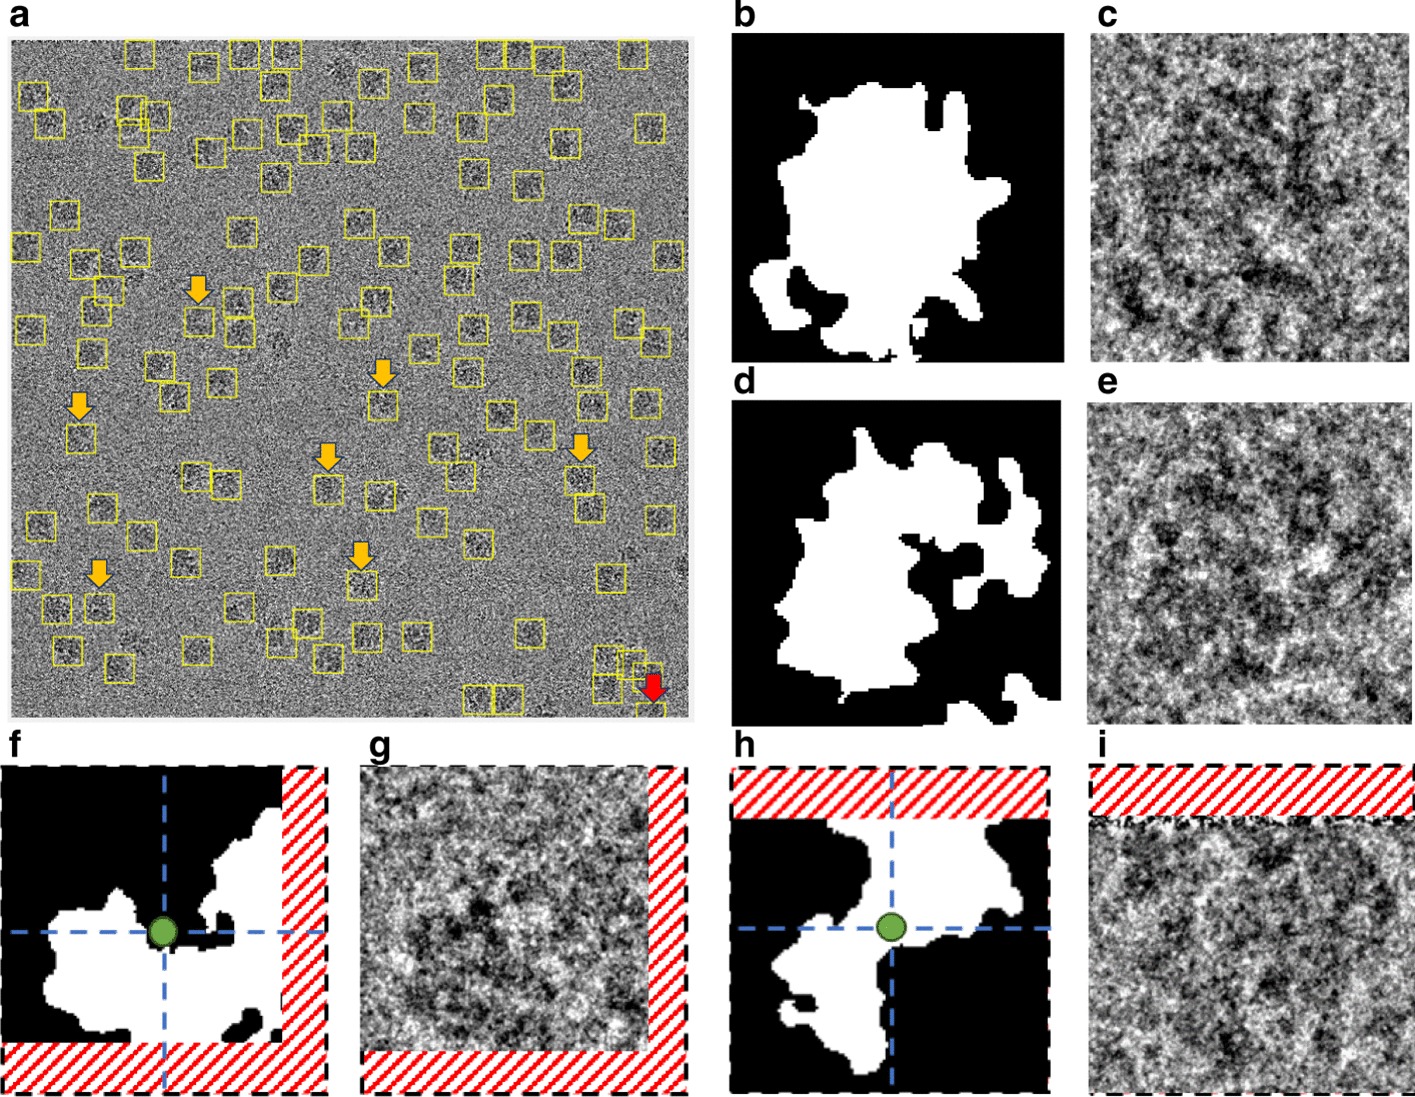
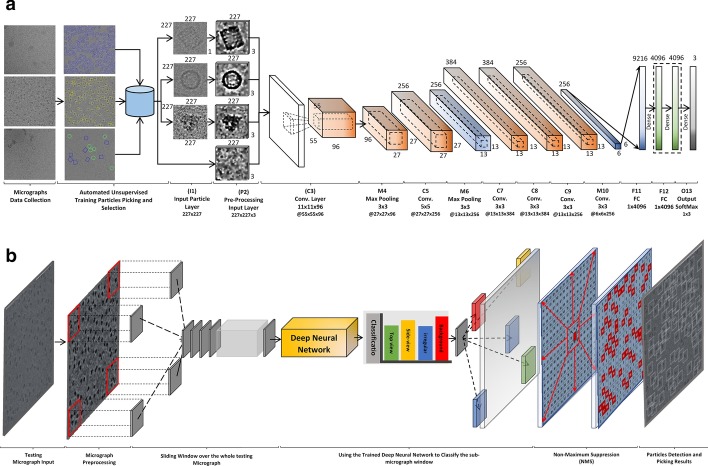
Results: Here we propose a fully automated approach (DeepCryoPicker) for single particle picking based on deep learning. It first uses automated unsupervised learning to generate particle training datasets. Then it trains a deep neural network to classify particles automatically. Results indicate that the DeepCryoPicker compares favorably with semi-automated methods such as DeepEM, DeepPicker, and RELION, with the significant advantage of not requiring human intervention.

Conclusions: Our framework combing supervised deep learning classification with automated un-supervised clustering for generating training data provides an effective approach to pick particles in cryo-EM images automatically and accurately.

Keywords: AutoCryoPicker; Cryo-EM; Deep learning; Intensity based clustering (IBC); Micrograph; Protein structure determination; Singe particle pickling; Super clustering; SuperCryoPicker.


Conflict of interest statement

The authors declare they have no conflict of interest.

Figures

Fig. 1
Fig. 1
Overview of the DeepCryoPicker procedure. a The general workflow of the training particle-selection based unsupervised scheme and single particle picking based on deep learning scheme. The gray part of the workflow shows the micrographs data collection. The blue part of the workflow shows the fully automated training particles-selection using clustering algorithms. The red part of the workflow shows the general flow of the single particle picking using a deep classification network. The yellow part of the workflow shows the external testing part of the DeepCryoPicker. b 3D Cryo-EM map of the Apoferritin. c Picked particle from an Apoferritin micrograph [27]. d 3D Cryo-EM map of KLH is viewed from the top. e Picked particle from a KLH micrograph [26] showing the top view (circular particle). f 3D Cryo-EM map of KLH is viewed from the side. g Picked particle from a KLH micrograph [26] showing the side-view (square particle). h 3D Cryo-EM map of the 80S ribosome. i Picked particle from a ribosome micrograph [28]. j 3D Cryo-EM map of β-galactosidase. k Picked particle from a β-galactosidase micrograph [29]
Fig. 2
Fig. 2
Different examples of the deep classification network results using preprocessed particle images. a A typical testing image example showing high-density top-view particle’s predicted label and prediction score of the Apoferritin micrograph dataset [27]. b A typical testing image example showing high-density side-view particle’s predicted label and prediction score of the KLH micrograph dataset [26]. c A typical testing image example showing high-density background predicted label and prediction score. d A typical testing image example showing high-density irregular particle’s predicted label and prediction score of the β-galactosidase dataset [29]. e A typical testing image example showing high-density top-view particle’s predicted label and prediction score of the KLH micrograph dataset [26]. f A typical testing image example showing high-density background predicted label and prediction score
Fig. 2
Fig. 2
Different examples of the deep classification network results using preprocessed particle images. a A typical testing image example showing high-density top-view particle’s predicted label and prediction score of the Apoferritin micrograph dataset [27]. b A typical testing image example showing high-density side-view particle’s predicted label and prediction score of the KLH micrograph dataset [26]. c A typical testing image example showing high-density background predicted label and prediction score. d A typical testing image example showing high-density irregular particle’s predicted label and prediction score of the β-galactosidase dataset [29]. e A typical testing image example showing high-density top-view particle’s predicted label and prediction score of the KLH micrograph dataset [26]. f A typical testing image example showing high-density background predicted label and prediction score
Fig. 3
Fig. 3
DeepCryoPicker results (different shapes of single particle picking) using three different micrographs. a Top and side-view particles picking results using the KLH dataset [26]. b Top-view particle picking results using the Apoferritin dataset [27]. c Irregular (complex) particle picking results using the Ribosome dataset [28]
Fig. 4
Fig. 4
Precision-recall cures of the fully automated different single particle shapes picking result using deep classification network and different micrographs datasets, a precision–recall cure of the top-view particle shapes picking. b precision–recall cure of the side-view particle shapes picking. c precision–recall cure of the irregular and complex particle shape picking
Fig. 5
Fig. 5
DeepCryoPicker testing results (different shapes of single particle picking) using different micrographs from different external testing datasets (unseen micrographs). a Typical external micrograph from the bacteriophage MS2 (EMPIAR-10075) [38] showing the Top-View particles picking. b Typical external micrograph from the T. acidophilum 20 (EMPIAR-10186) [39] showing the top and side-view particles picking. c Typical external micrograph from the β-galactosidase 2.2 A(EMPIAR-10061) [40] showing the irregular (complex) particles picking
Fig. 6
Fig. 6
The precision–recall curves of particle picking for different single particle picking tools. The green, yellow, black, blue, and red curves represent the precision-recall curves for RELION-2 [31], DeepPicker [20], DeepEM [6], PIXER [4], and DeepCryoPicker respectively
Fig. 7
Fig. 7
Particle picking results using different testing micrographs from the KLH dataset [26] and different particle picking tools. The red and yellow arrows to denote the FP and FN particles picking results. The red arrows show the FP where the particles are incorrectly picked while the yellow arrows show the FN where some particles are missed (not picked). a, c, e, g Top and side-views particles picking results using DeepCryoPicker. b Top and side-views particles picking results using RELION [31]. d Top and side-views particles picking results using DeepEM [6]. f Top and side-views particles picking results using PIXER [4]. h Top and side-views particles picking results using DeepPicker [20]
Fig. 7
Fig. 7
Particle picking results using different testing micrographs from the KLH dataset [26] and different particle picking tools. The red and yellow arrows to denote the FP and FN particles picking results. The red arrows show the FP where the particles are incorrectly picked while the yellow arrows show the FN where some particles are missed (not picked). a, c, e, g Top and side-views particles picking results using DeepCryoPicker. b Top and side-views particles picking results using RELION [31]. d Top and side-views particles picking results using DeepEM [6]. f Top and side-views particles picking results using PIXER [4]. h Top and side-views particles picking results using DeepPicker [20]
Fig. 8
Fig. 8
The computational efficiency statistics of DeepCryoPicker training times
Fig. 9
Fig. 9
DeepCryoPicker workflow. The orange rectangle marks the first part of the fully automated approach “fully training particles-section and dataset generation”. The blue rectangle marks the second part “fully automated single particles picking”. The green and gray rectangles mark the first and second stages of the preprocessing step respectively
Fig. 10
Fig. 10
Illustration of the effects of the cryo-EM image analysis on a zoom-in selected particle region using two different examples from two datasets. a1, b1, c1, d1, e1 original zoom-in particle regions (different shapes) are selected from different micrograph Apoferritin (top-view particle) [27], KLH (top-view) [26], KLH (side-view) [26], Ribosome (irregular shape) [28], and β-galactosidase (complex shape) [29] respectively. a2, b2, b2, e2 normalized single particle image region. a3, b3, c3, d3, e3 single particle region after applying the contrast enhancement correction (CEC). a4, b4, c4, d4, e4 single particle region after applying the histogram equalization. a5, b5, c5, d5, e5 single particle region after applying image resonation with Wiener filtering. a6, b6, c6, d6, e6 single particle region after applying the contrast-limited adaptive histogram equalization. a7, b7, c7, d7, e7 single particle region after applying image guided filtering. a8, b8, c8, d8, e8 single particle region after applying morphological image operation
Fig. 10
Fig. 10
Illustration of the effects of the cryo-EM image analysis on a zoom-in selected particle region using two different examples from two datasets. a1, b1, c1, d1, e1 original zoom-in particle regions (different shapes) are selected from different micrograph Apoferritin (top-view particle) [27], KLH (top-view) [26], KLH (side-view) [26], Ribosome (irregular shape) [28], and β-galactosidase (complex shape) [29] respectively. a2, b2, b2, e2 normalized single particle image region. a3, b3, c3, d3, e3 single particle region after applying the contrast enhancement correction (CEC). a4, b4, c4, d4, e4 single particle region after applying the histogram equalization. a5, b5, c5, d5, e5 single particle region after applying image resonation with Wiener filtering. a6, b6, c6, d6, e6 single particle region after applying the contrast-limited adaptive histogram equalization. a7, b7, c7, d7, e7 single particle region after applying image guided filtering. a8, b8, c8, d8, e8 single particle region after applying morphological image operation
Fig. 11
Fig. 11
Micrograph clustering and single particle picking results using different cryo-EM datasets. a Apoferritin micrograph clustering image (binary mask) using AutoCryoPicker Approach [24] based Intensity-Based Clustering Algorithm (IBC) and Apoferritin dataset [27]. b Top-view (Circular) Particles Detection and Picking Results using Modified Circular Hough Transform (CHT) [24], the center of each particle illustrated by the ‘ + ’ sign and the radius of each particle by the blue circle around each particle from the Apoferritin dataset [27]. c KLH micrograph clustering image (binary mask) using AutoCryoPicker Approach [24] based Intensity-Based Clustering Algorithm (IBC) and KLH dataset [26]. d Top-view (Circular) Particles Detection and Picking Results using Modified Circular Hough Transform (CHT) [24], the center of each particle illustrated by the ‘ + ’ sign and the radius of each particle by the blue circle around each particle from the KLH dataset [26]. e KLH micrograph clustering image (binary mask) using AutoCryoPicker Approach [24] based Intensity-Based Clustering Algorithm (IBC) and KLH dataset [26]. f Top and side-view (square) Particles Detection and Picking Results using Feret diameters detection [32] and Modified Circular Hough Transform (CHT) [24] from KLH dataset [26], the center of each particle illustrated by the ‘ + ’ sign and the radius of each particle by the blue circle around each particle from the KLH dataset [26]. g Ribosome micrograph clustering image (binary mask) using SuperCryoPicker Approach [25] based super k-means clustering (SP-K-means) and Ribosome dataset [28]. h Irregular particle shape detection and picking by SP-K-means [25] on the Ribosome dataset [28]. i Β-galactosidase micrograph clustering image (binary mask) using SuperCryoPicker Approach [25] based super k-means clustering (SP-K-means) and β-galactosidase dataset [29]. j Complex particle shape detection and picking by SP-K-means on the β-galactosidase dataset [29]
Fig. 11
Fig. 11
Micrograph clustering and single particle picking results using different cryo-EM datasets. a Apoferritin micrograph clustering image (binary mask) using AutoCryoPicker Approach [24] based Intensity-Based Clustering Algorithm (IBC) and Apoferritin dataset [27]. b Top-view (Circular) Particles Detection and Picking Results using Modified Circular Hough Transform (CHT) [24], the center of each particle illustrated by the ‘ + ’ sign and the radius of each particle by the blue circle around each particle from the Apoferritin dataset [27]. c KLH micrograph clustering image (binary mask) using AutoCryoPicker Approach [24] based Intensity-Based Clustering Algorithm (IBC) and KLH dataset [26]. d Top-view (Circular) Particles Detection and Picking Results using Modified Circular Hough Transform (CHT) [24], the center of each particle illustrated by the ‘ + ’ sign and the radius of each particle by the blue circle around each particle from the KLH dataset [26]. e KLH micrograph clustering image (binary mask) using AutoCryoPicker Approach [24] based Intensity-Based Clustering Algorithm (IBC) and KLH dataset [26]. f Top and side-view (square) Particles Detection and Picking Results using Feret diameters detection [32] and Modified Circular Hough Transform (CHT) [24] from KLH dataset [26], the center of each particle illustrated by the ‘ + ’ sign and the radius of each particle by the blue circle around each particle from the KLH dataset [26]. g Ribosome micrograph clustering image (binary mask) using SuperCryoPicker Approach [25] based super k-means clustering (SP-K-means) and Ribosome dataset [28]. h Irregular particle shape detection and picking by SP-K-means [25] on the Ribosome dataset [28]. i Β-galactosidase micrograph clustering image (binary mask) using SuperCryoPicker Approach [25] based super k-means clustering (SP-K-means) and β-galactosidase dataset [29]. j Complex particle shape detection and picking by SP-K-means on the β-galactosidase dataset [29]
Fig. 12
Fig. 12
Top-view particles picking results using AutoCryoPicker [24] and different micrographs from the Apoferritin [27] and KLH [26] datasets. a Top-view single particle picking results using cryo-EM micrographs form the Apoferritin [27] dataset. b Top-view single particle picking results using cryo-EM micrographs form the KLH [26] datasets. c Apoferritin good top-view particle example that has been picked using AutoCryoPicker Approach [24]. d Apoferritin good top-view binary mask example (perfect “full” binary circular mask). e KLH good top-view particle example has been picked using AutoCryoPicker Approach [24]. f KLH good top-view mask example (perfect “full” binary circular mask). g Apoferritin bad top-view particle example has been picked using AutoCryoPicker Approach [24]. h Apoferritin bad top-view binary mask example (non-perfect binary circular mask). i KLH bad top-view particle example has been picked using AutoCryoPicker Approach [24]. j KLH bad top-view binary mask example (non-perfect binary circular mask)
Fig. 13
Fig. 13
Fully automated good training top-view training particles-selection results using AutoCryoPicker [24] approach and diferenrt micrographs from Apoferritin [27] and KLH [26] datasets. a, e Individual top-view particle binary mask form the Apoferritin [27] and KLH [26] datasets. b, f CHT [24] perfect circle on top of the particle’s binary masks. c, g Generated perfect top-view binary mask based on the center and dimeter that are automatically extracted from the CHT [24] using picked top-view particles form Apoferritin [27] and KLH [26]. d, h The full automated good top-view training particle selection results based on the perfect mask generation using CHT [24] and different top-view picked particles from different datasets (Apoferritin [27] and KLH [26]). i, k, m, o Other examples of the top-view particle’s binary masks that the modified CHT [24] has failed to draw perfect circles on top of them (dash red lines illustrate the missing part of the particle’s background while the dash blue lines illustrate the missing part of the circular object). j, l, n, p The full automated bad top-view training particle selection using different top-view picked particles from different datasets (Apoferritin [27] and KLH [26]) (dash red lines illustrate the missing part of the particle’s background while the dash blue lines illustrate the missing part of the circular object)
Fig. 14
Fig. 14
Fully automated side-view particles clustering results using different cryo-EM micrographs and Intensity-Based Clustering Algorithm (ICB) [24]. a, g KLH micrograph clustering images (binary masks) using the KLH dataset [26] were both top and side-view particles appear in additional to some cumulative ice and artificial objects. b, h Cleaned KLH micrograph binary mask images that have only the side-view particles after micrograph cleaning and small object and circular objects removal. c, i Binary particle objects smoothing micrographs. d, j Feret diameters measures [32] for the particle objects. e, k Perfect side-view (square) particle shapes generation on the top of the binary image of the KLH micrograph. f, l Show the overlapped particles removal and perfect side-view particles-selection results after remove the overlapped side-view binary masks
Fig. 15
Fig. 15
Fully automated perfect side-view masks generation and good training particles-selection results using the KLH dataset [26]. a, e, i The original individual side-view particle binary masks. b, f, j New binary particle’s mask dimensions using Feret diameters [32]. c, g, k The replaced artificial perfect side-view (square) binary masks based on the new Feret object dimensions. d, h, l The good KLH side-view particles selection
Fig. 16
Fig. 16
Fully automated good top and side-View (square and circular) training particles-selection using AutoCryoPicker [24] approach and KLH dataset [26]. a, d The Ground truth (particles manually labeled) for the different cryo-EM images from the KLH dataset [26]. b, e Side-view particles-selection results using AutoCryoPicker based IBC algorithm [24] and perfect side-view (square) particles-selection algorithm. c, f Top-view particles-selection results using a modified CHT algorithm [24] (the red ‘ + ’ sign is the center of each particle, and blue circles around each particle are the radius of each particle by the blue circle around each particle
Fig. 17
Fig. 17
Fully automated irregular (complex) particles picking results using SuperCryoEMPicker approach [25] and good training particles-selection. a Particle detection and picking results using SuperCryoEMPicker approach [25] and cryo-EM micrographs form the Ribosome dataset [28]. b, d Good irregular particle binary mask examples. c, e Good training particle examples selection. f, h Bad irregular binary mask examples (dash red lines illustrate the missing part of the particle’s background while the dash blue lines illustrate the center of the object that the selected particle has to be in). g, i Bad particle examples (dash red lines illustrate the missing part of the particle’s background)
Fig. 18
Fig. 18
The architecture of the deep neural network used in DeepCryoPicker. a Training pipeline. The convolutional layer and the subsampling layer are abbreviated as C and S, respectively. C3:11 × 11 × 96 means that in the third convolutional layer (C3) is comprised of 96 feature maps, each of which has a size of 11 × 11, also. C3: @27 × 27 means that output feature maps dimensions are 27 × 27 pixels. b Testing pipeline

References

    1. Han R, Wan X, Li L, et al. AuTom-dualx: a toolkit for fully automatic fiducial marker-based alignment of dual-axis tilt series with simultaneous reconstruction. Bioinformatics. 2019;35(2):319–328. doi: 10.1093/bioinformatics/bty620. - DOI - PMC - PubMed
    1. Zhang Y, Sun B, Feng D, Hu H, Chu M, Qu Q, Tarrasch JT, Li S, Kobilka TS, Kobilka BK. Cryo-EM structure of the activated GLP-1 receptor in complex with a G protein. Nature. 2017;546:248. doi: 10.1038/nature22394. - DOI - PMC - PubMed
    1. Parmenter CD, Cane MC, Zhang R, Stoilova-McPhie S. Cryo-electron microscopy of coagulation factor VIII bound to lipid nanotubes. Biochem Biophys Res Commun. 2018;366:288–293. doi: 10.1016/j.bbrc.2007.11.072. - DOI - PubMed
    1. Zhang J, Wang Z, Chen Y, Han R, Liu Z, Sun F, Zhang F. PIXER: an automated particle-selection method based on segmentation using a deep neural network. BMC Bioinform. 2019;20:41. doi: 10.1186/s12859-019-2614-y. - DOI - PMC - PubMed
    1. Frank J. Three-dimensional electron microscopy of macromolecular assemblies. New York: Oxford University Press; 2006.

LinkOut - more resources