

Fine mapping of the QTL cqSPDA2 for chlorophyll content in Brassica napus L
- PMID: 33167895
- PMCID: PMC7654151
- DOI: 10.1186/s12870-020-02710-y
Fine mapping of the QTL cqSPDA2 for chlorophyll content in Brassica napus L
Abstract
Background: Chlorophyll is the most important factor enabling plants to absorb, transfer and transform light energy and plays an important role in yield formation. Brassica napus is one of the most important oil crops. Breeding Brassica napus for high light efficiency by improving photosynthetic efficiency has considerable social and economic value. In Brassica napus, there have been studies of the initial location of chlorophyll in seed embryos and pericarps, but there are few reports on the fine mapping of chlorophyll QTLs. We constructed near-isogenic lines (NIL), fine-mapped a chlorophyll locus, and evaluated the effect of this dominant locus on agronomic traits.
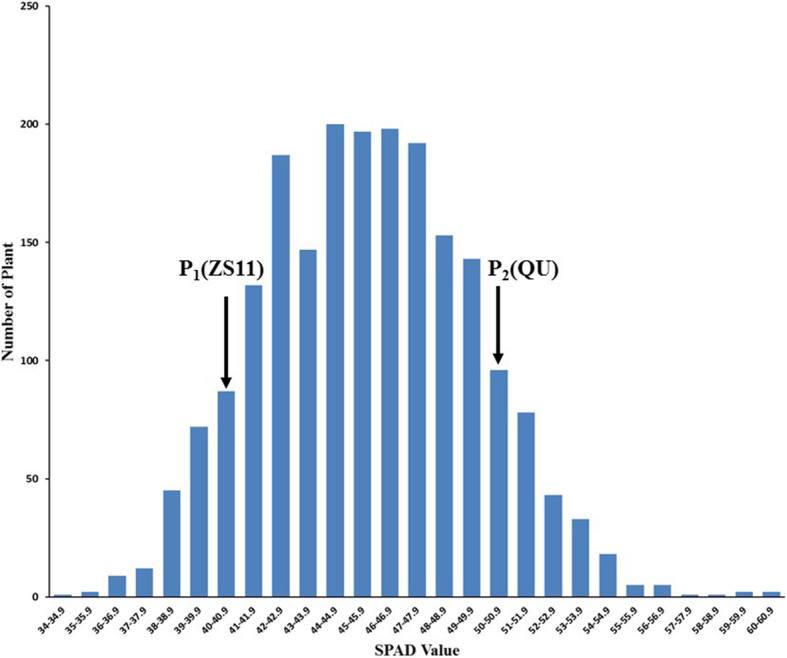
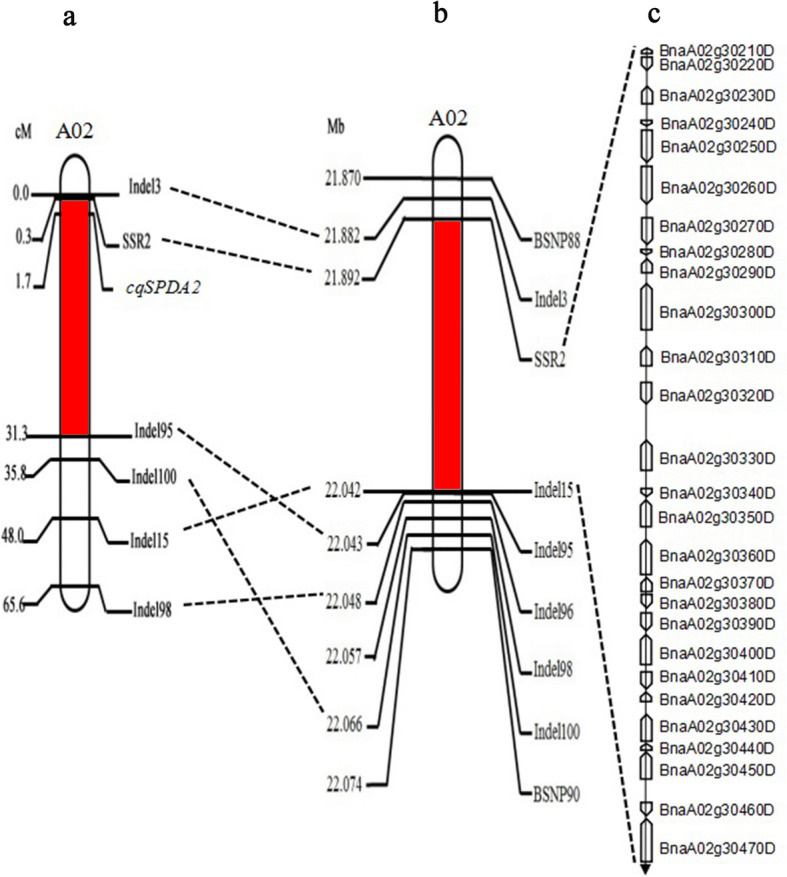
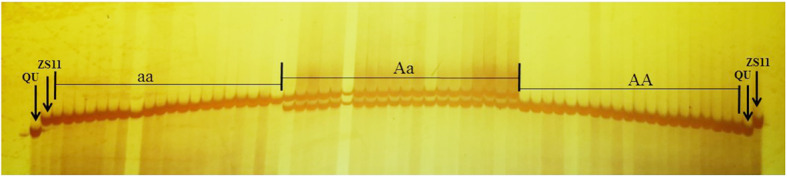
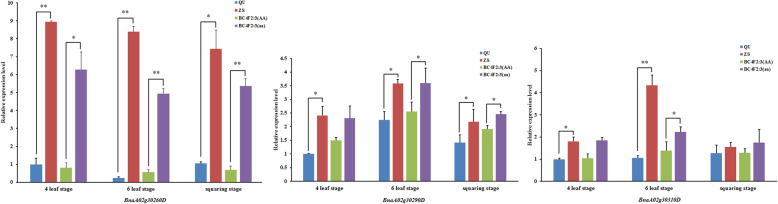
Results: The cqSPDA2 locus was mapped to an interval of 21.87-22.91 Mb on the chromosome A02 of Brassica napus using doubled haploid (DH) lines. To fine-map cqSPDA2, we built NIL and designed Indel primers covering the mapping interval. The 469 individuals in the BC3F2 population were analyzed using these indel primers. Among these indel primers, 15 could narrow the mapping interval to 188 kb between Indel3 and Indel15. Next, 16 indel primers and 19 SSR primers were designed within the new narrower mapping interval, and 5 of the primer-amplified fragments were found to be polymorphic and tightly linked to the cqSPDA2 locus in the BC4F2 population. The mapping interval was narrowed to 152 kb on A02 between SSR2 and Indel15. By gene expression analysis, we found three annotated genes in the mapping interval, including BnaA02g30260D, BnaA02g30290D and BnaA02g30310D, which may be responsible for chlorophyll synthesis.
Conclusions: The locus cqSPDA2, a dominant QTL for chlorophyll content in Brassica napus, was fine-mapped to a 21.89-22.04 Mb interval on A02. Three annotated genes (BnaA02g30260D, BnaA02g30290D and BnaA02g30310D) that may be responsible for chlorophyll synthesis were found.
Keywords: Brassica napus; Chlorophyll content; Fine mapping; Near-isogenic line; qRT-PCR.
Conflict of interest statement
The authors declare no competing financial interests.
Figures
References
-
- Guo P, Baum M, Varshney RK, Graner A, Grando S, Ceccarelli S. QTLs for chlorophyll and chlorophyll fluorescence parameters in barley under post-flowering drought. Euphytica. 2008;163:203–214. doi: 10.1007/s10681-007-9629-6. - DOI
-
- Mae T. Physiological nitrogen efficiency in rice: nitrogen utilization, photosynthesis, and yield potential. Plant Soil. 1997;196:201–210. doi: 10.1023/A:1004293706242. - DOI
MeSH terms
Substances
LinkOut - more resources
Full Text Sources
Miscellaneous
