

Stool microbiome, pH and short/branched chain fatty acids in infants receiving extensively hydrolyzed formula, amino acid formula, or human milk through two months of age
- PMID: 33167908
- PMCID: PMC7650147
- DOI: 10.1186/s12866-020-01991-5
Stool microbiome, pH and short/branched chain fatty acids in infants receiving extensively hydrolyzed formula, amino acid formula, or human milk through two months of age
Abstract
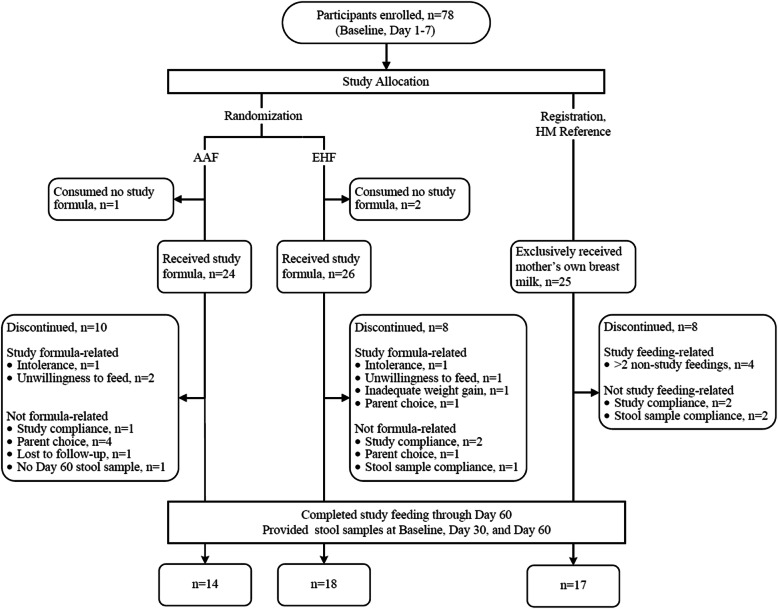
Background: Early infant feeding with intact or extensively hydrolyzed (EH) proteins or free amino acids (AA) may differentially affect intestinal microbiota composition and immune reactivity. This multicenter, double-blind, controlled, parallel-group, pilot study compared stool microbiota from Baseline (1-7 days of age) up to 60 days of age in healthy term infants who received mother's own milk (assigned to human milk [HM] reference group) (n = 25) or were randomized to receive one of two infant formulas: AA-based (AAF; n = 25) or EH cow's milk protein (EHF; n = 28). Stool samples were collected (Baseline, Day 30, Day 60) and 16S rRNA genes were sequenced. Alpha (Shannon, Simpson, Chao1) and beta diversity (Bray Curtis) were analyzed. Relative taxonomic enrichment and fold changes were analyzed (Wilcoxon, DESEq2). Short/branched chain fatty acids (S/BCFA) were quantified by gas chromatography. Mean S/BCFA and pH were analyzed (repeated measures ANOVA).
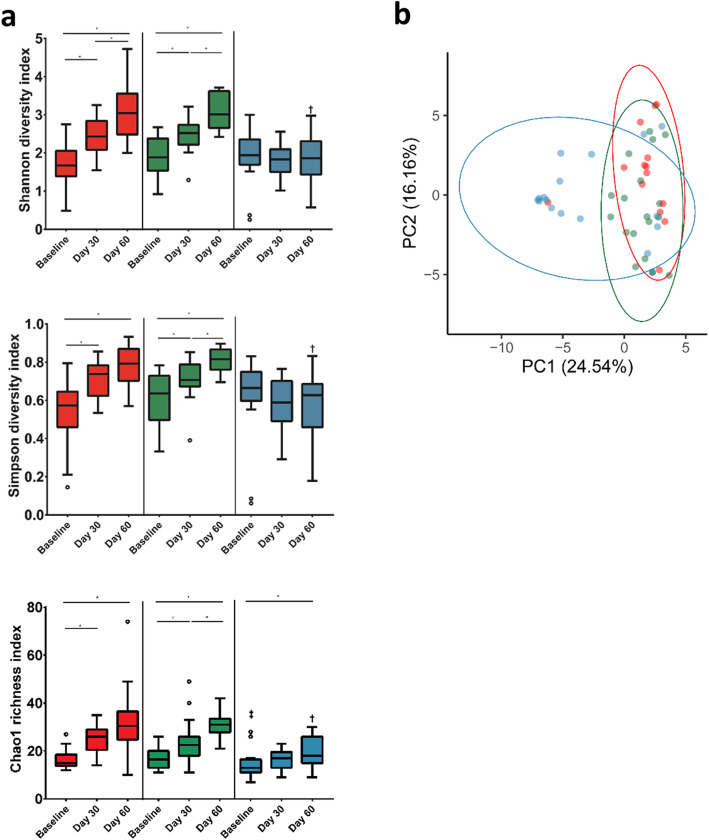
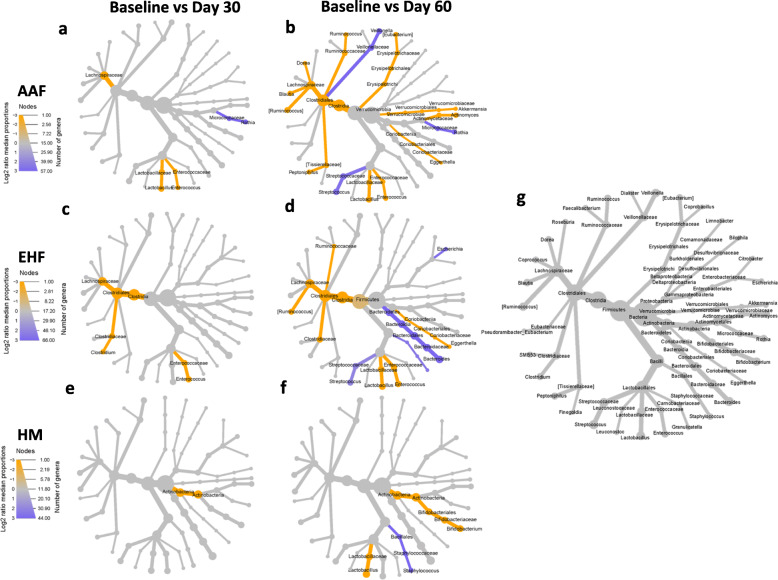
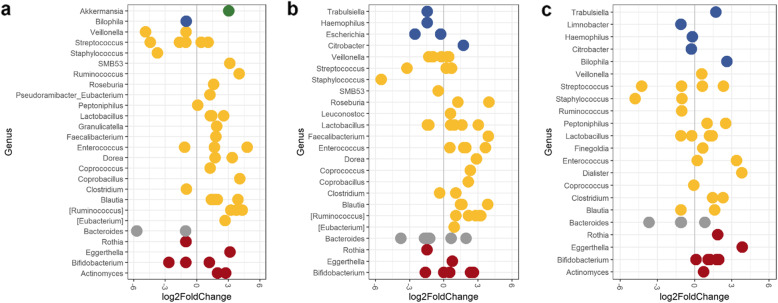
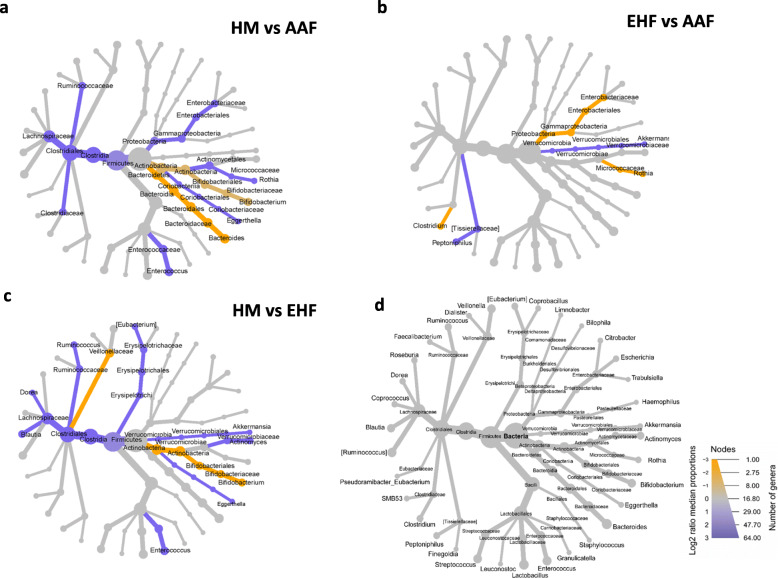
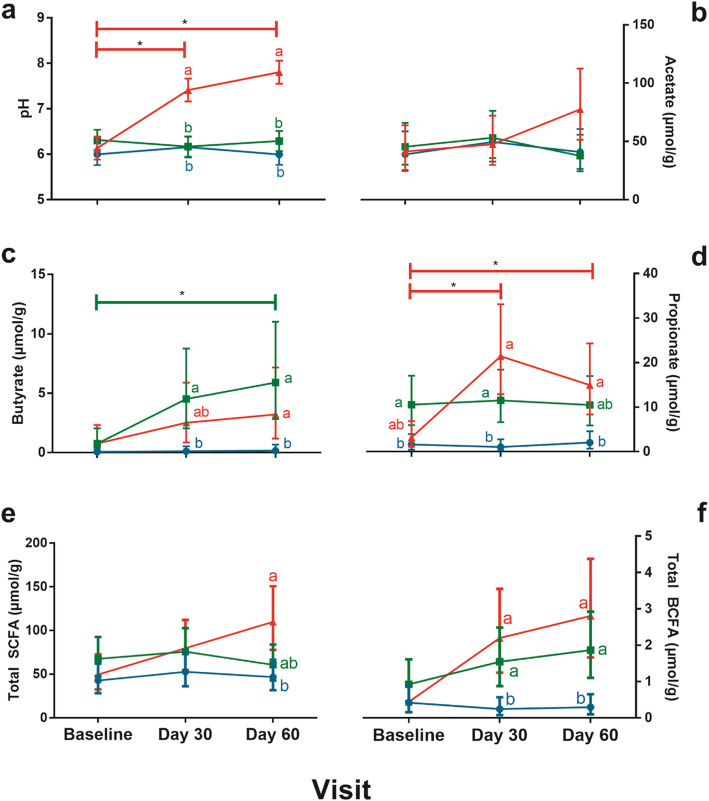
Results: At baseline, alpha diversity measures were similar among all groups; however, both study formula groups were significantly higher versus the HM group by Day 60. Significant group differences in beta diversity at Day 60 were also detected, and study formula groups were compositionally more similar compared to HM. The relative abundance of Bifidobacterium increased over time and was significantly enriched at Day 60 in the HM group. In contrast, a significant increase in members of Firmicutes for study formula groups were detected at Day 60 along with butyrate-producing species in the EHF group. Stool pH was significantly higher in the AAF group at Days 30 and 60. Butyrate increased significantly from Baseline to Day 60 in the EHF group and was significantly higher in study formula groups vs HM at Day 60. Propionate was also significantly higher for EHF and AAF at Day 30 and AAF at Day 60 vs HM. Total and individual BCFA were higher for AAF and EHF groups vs HM through Day 60.
Conclusions: Distinct patterns of early neonatal microbiome, pH, and microbial metabolites were demonstrated for infants receiving mother's own milk compared to AA-based or extensively hydrolyzed protein formula. Providing different sources of dietary protein early in life may influence gut microbiota and metabolites.
Trial registration: ClinicalTrials.gov Identifier: NCT02500563 . Registered July 28, 2015.
Keywords: Bifidobacterium; Infant formula; Infant microbiota; Short chain fatty acids.
Conflict of interest statement
CK was funded by a grant from Mead Johnson Nutrition. RH is a member of the Board of Directors of the International Scientific Association for Probiotics and Prebiotics, has received funding and honoraria from industry sources involved in the manufacture and marketing of probiotics and prebiotics, and is a co-owner of Synbiotics Health. MC, CLH, NM, JLW, and JAV are employed by the study sponsor, Mead Johnson Nutrition.
Figures
Similar articles
-
Gut microbiota in infants with food protein enterocolitis.Pediatr Res. 2025 Feb;97(2):763-773. doi: 10.1038/s41390-024-03424-9. Epub 2024 Jul 20. Pediatr Res. 2025. PMID: 39033251
-
Infant behavioral state and stool microbiome in infants receiving Lactocaseibacillus rhamnosus GG in formula: randomized controlled trial.BMC Pediatr. 2022 Oct 7;22(1):580. doi: 10.1186/s12887-022-03647-x. BMC Pediatr. 2022. PMID: 36207675 Free PMC article. Clinical Trial.
-
Microbiota, metabolic profiles and immune biomarkers in infants receiving formula with added bovine milk fat globule membrane: a randomized, controlled trial.Front Nutr. 2024 Oct 4;11:1465174. doi: 10.3389/fnut.2024.1465174. eCollection 2024. Front Nutr. 2024. PMID: 39444571 Free PMC article.
-
Comparison of Growth of Healthy Term Infants Fed Extensively Hydrolyzed Protein- and Amino Acid-Based Infant Formulas.Nutrients. 2018 Mar 1;10(3):289. doi: 10.3390/nu10030289. Nutrients. 2018. PMID: 29494498 Free PMC article. Review.
-
Dietary PUFA for preterm and term infants: review of clinical studies.Crit Rev Food Sci Nutr. 2005;45(3):205-29. doi: 10.1080/10408690590956378. Crit Rev Food Sci Nutr. 2005. PMID: 16048149 Review.
Cited by
-
Effect of Various Preterm Infant Milk Formulas on NEC-Like Gut Injury in Mice.Front Pediatr. 2022 Jul 6;10:902798. doi: 10.3389/fped.2022.902798. eCollection 2022. Front Pediatr. 2022. PMID: 35874567 Free PMC article.
-
Gut microbiome derived short chain fatty acids: Promising strategies in necrotising enterocolitis.Curr Res Microb Sci. 2024 Jan 12;6:100219. doi: 10.1016/j.crmicr.2024.100219. eCollection 2024. Curr Res Microb Sci. 2024. PMID: 38303965 Free PMC article.
-
Special Diets in Infants and Children and Impact on Gut Microbioma.Nutrients. 2022 Aug 4;14(15):3198. doi: 10.3390/nu14153198. Nutrients. 2022. PMID: 35956374 Free PMC article. Review.
-
Microbial metabolites as modulators of the infant gut microbiome and host-microbial interactions in early life.Gut Microbes. 2023 Jan-Dec;15(1):2192151. doi: 10.1080/19490976.2023.2192151. Gut Microbes. 2023. PMID: 36942883 Free PMC article. Review.
-
Effect of protein modification in synbiotic infant formula on probiotic metabolic activity and bacterial composition in an infant gut-model.Microbiome Res Rep. 2024 Jun 28;3(3):38. doi: 10.20517/mrr.2024.13. eCollection 2024. Microbiome Res Rep. 2024. PMID: 39421252 Free PMC article.
References
-
- Koletzko ÃS, Niggemann B, Arato A, Dias JA, Heuschkel R, Husby S, et al. Diagnostic approach and management of cow’s-milk protein allergy in infants and children: ESPGHAN GI committee practical guidelines. J Pediatr Gastroenterol Nutr. 2012;55:221–229. doi: 10.1097/MPG.0b013e31825c9482. - DOI - PubMed
-
- Canani RB, Nocerino R, Terrin G, Frediani T, Lucarelli S, Cosenza L, et al. Formula selection for management of children with cow’s milk allergy influences the rate of acquisition of tolerance: a prospective multicenter study. J Pediatr. 2013;163:771–777. doi: 10.1016/j.jpeds.2013.03.008. - DOI - PubMed
Publication types
MeSH terms
Substances
Associated data
LinkOut - more resources
Full Text Sources
Medical
