

A large decrease in the magnitude of seasonal fluctuations in mortality among elderly explains part of the increase in longevity in Sweden during 20th century
- PMID: 33167913
- PMCID: PMC7654045
- DOI: 10.1186/s12889-020-09749-4
A large decrease in the magnitude of seasonal fluctuations in mortality among elderly explains part of the increase in longevity in Sweden during 20th century
Abstract
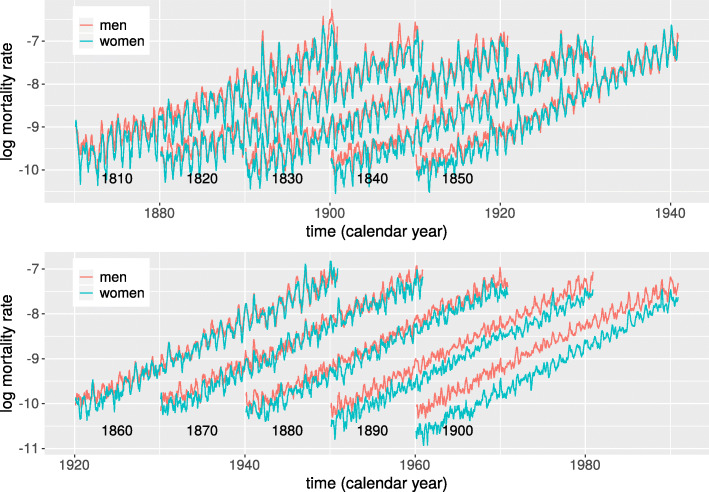
Background: Mortality rates are known to depend on the seasons and, in temperate climates, rates are highest during winter. The magnitude of these seasonal fluctuations in mortality has decreased substantially in many countries during the 20th century, but the extent to which this decrease has contributed to the concurrent increase in life expectancy is not known. Here, I describe how the seasonality of all-cause mortality among people ages 60 years or more has changed in Sweden between 1860 and 1995, and investigate how this change has contributed to the increase in life expectancy observed during the same time period.
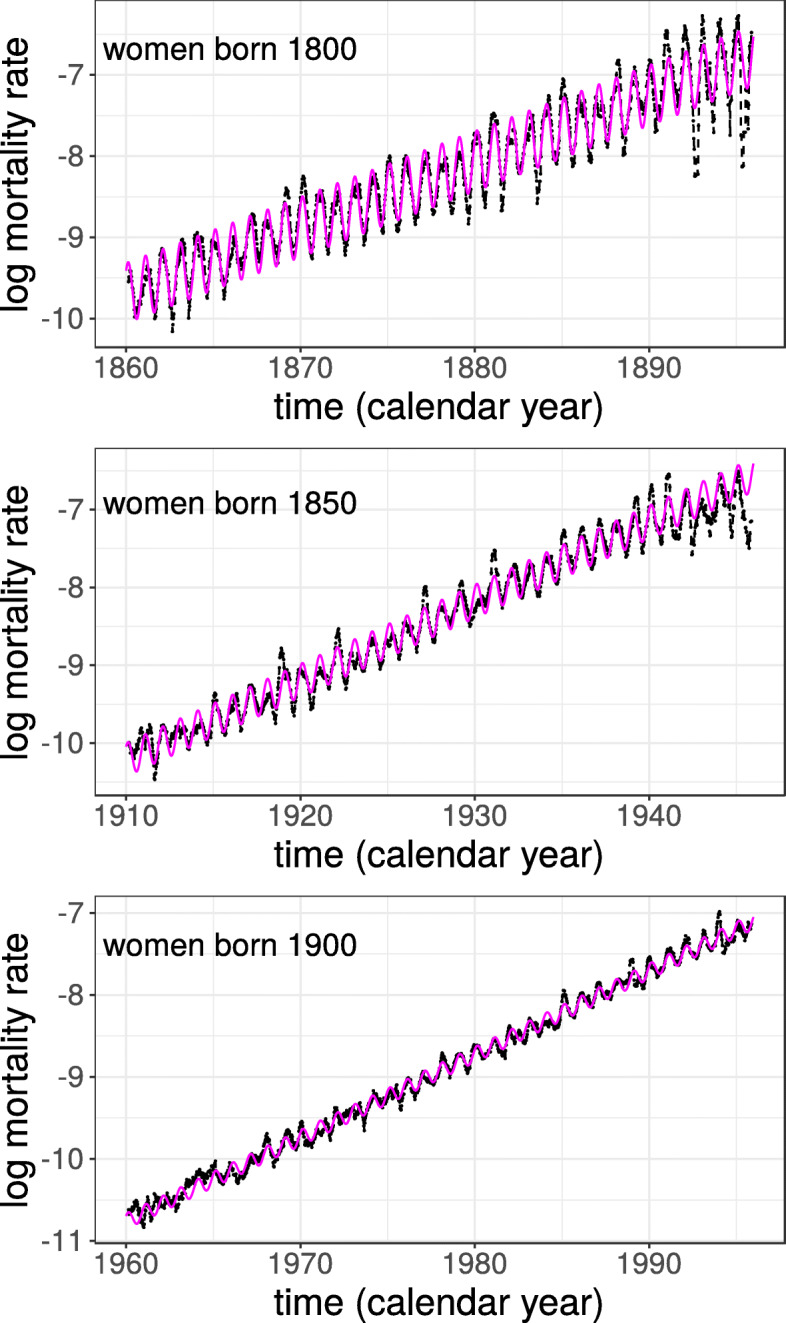
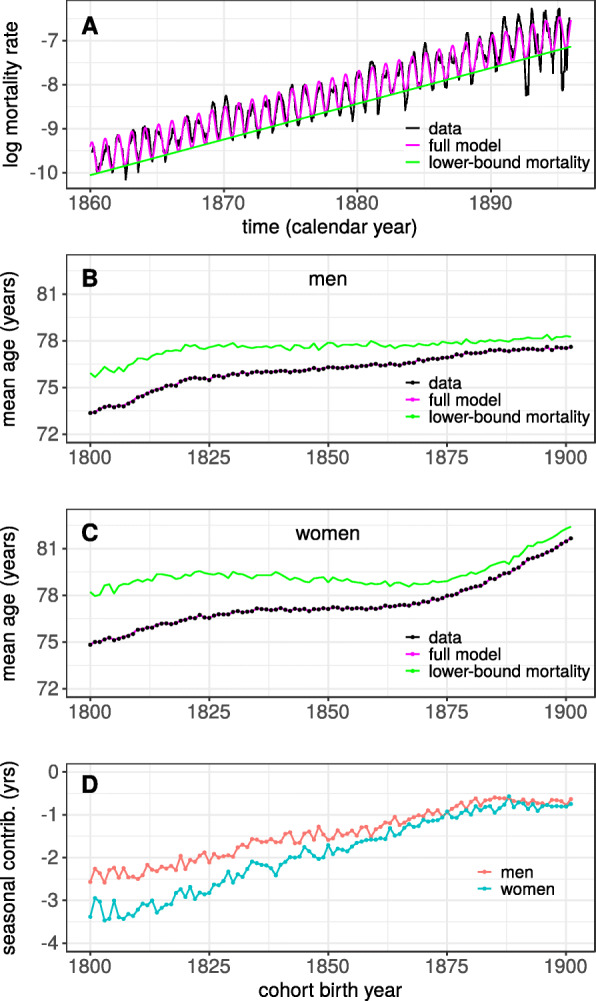
Methods: Yearly sex-specific birth cohorts consisting of all people born in Sweden between 1800 and 1901 who reached at least 59 years of age were obtained from a genealogical database. The mortality rates for each cohort were modeled by an exponential function of age modulated by a sinusoidal function of time of year. The potential impact of seasonal fluctuations on life expectancy was investigated by a novel decomposition of the total mortality rate into a seasonal part and a part independent of the seasons. Cohort life expectancy at age 60 was used to quantify changes in lifespan during the time period.
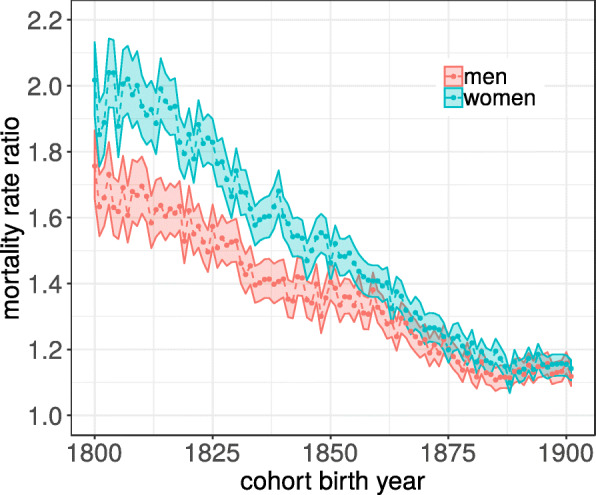
Results: The magnitude of seasonal fluctuations in mortality rates decreased substantially between 1860 and 1995. For cohorts born in 1800, the risk of dying during the winter season was almost twice that of dying during summer. For cohorts born in 1900, the relative increase in winter mortality was 10%. Cohort life expectancy at age 60 increased by 4.3 years for men and 6.8 years for women, and the decrease in seasonal mortality fluctuations accounted for approximately 40% of this increase in average lifespan.
Conclusion: By following a large number of extinct cohorts, it was possible to show how the decrease in seasonal fluctuations in mortality has contributed to an increase in life expectancy. The decomposition of total mortality introduced here might be useful to better understand the processes and mechanisms underlying the marked improvements in life expectancy seen over the last 150 years.
Keywords: Cohort; Longevity; Mortality; Seasonal fluctuations; Winter excess mortality.
Conflict of interest statement
The author declares that he/she has no competing interests.
Figures
Similar articles
-
[Rapid increase in maximal country specific life expectancy across cohorts].Adv Gerontol. 2014;27(2):229-35. Adv Gerontol. 2014. PMID: 25306652 Russian.
-
Survival after the age of 80 in the United States, Sweden, France, England, and Japan.N Engl J Med. 1995 Nov 2;333(18):1232-5. doi: 10.1056/NEJM199511023331824. N Engl J Med. 1995. PMID: 7565998
-
Potential gains in life expectancy by reducing inequality of lifespans in Denmark: an international comparison and cause-of-death analysis.BMC Public Health. 2018 Jul 4;18(1):831. doi: 10.1186/s12889-018-5730-0. BMC Public Health. 2018. PMID: 29973183 Free PMC article.
-
Inflammatory exposure and historical changes in human life-spans.Science. 2004 Sep 17;305(5691):1736-9. doi: 10.1126/science.1092556. Science. 2004. PMID: 15375259 Review.
-
Recent mortality in Britain: a review of trends and explanations.Age Ageing. 2021 May 5;50(3):676-683. doi: 10.1093/ageing/afab016. Age Ageing. 2021. PMID: 33625483 Review.
Cited by
-
Variability of Mortality: Additional Information on Mortality and Morbidity Curves under Normal and Pathological Conditions [Commentary on the Article by A. G. Malygin "Programmed Risks of Death in Male Patients with Diabetes" Published in Biochemistry (Moscow), vol. 86, pp. 1553-1562 (2021)].Biochemistry (Mosc). 2022 Mar;87(3):294-299. doi: 10.1134/S0006297922030087. Biochemistry (Mosc). 2022. PMID: 35526855 Free PMC article.
-
Exponential increase in mortality with age is a generic property of a simple model system of damage accumulation and death.PLoS One. 2020 Jun 4;15(6):e0233384. doi: 10.1371/journal.pone.0233384. eCollection 2020. PLoS One. 2020. PMID: 32497107 Free PMC article.
-
Seasonal variation in medico-legal autopsies in Finland-a nationwide analysis of the period 2016-2021.Int J Legal Med. 2024 Jan;138(1):277-280. doi: 10.1007/s00414-022-02880-4. Epub 2022 Aug 30. Int J Legal Med. 2024. PMID: 36038738 Free PMC article.
-
Mortality of the COVID-19 Outbreak in Sweden in Relation to Previous Severe Disease Outbreaks.Front Public Health. 2021 Feb 18;9:579948. doi: 10.3389/fpubh.2021.579948. eCollection 2021. Front Public Health. 2021. PMID: 33681118 Free PMC article.
-
Seasonality in mortality and its impact on life expectancy levels and trends across Europe.J Epidemiol Community Health. 2025 May 9;79(6):466-473. doi: 10.1136/jech-2024-223050. J Epidemiol Community Health. 2025. PMID: 39740985 Free PMC article.
References
-
- Tabellkommissionen . Bidrag Till Sveriges Officiella Statistik. A. Befolkningsstatistik. Stockholm, Sweden: P. A. Norstedt & Söner; 1857.
-
- Rosenwaike I. Seasonal variation of deaths in United States 1951-1960. J Am Stat Assoc. 1966;61(315):706.
-
- Rau R. Seasonality in human mortality: a demographic approach. Berlin, Germany: Springer; 2007.
MeSH terms
LinkOut - more resources
Full Text Sources
