. 2020 Nov 10;15(1):66.
doi: 10.1186/s13024-020-00415-2.

Diabetic phenotype in mouse and humans reduces the number of microglia around β-amyloid plaques

Affiliations

Diabetic phenotype in mouse and humans reduces the number of microglia around β-amyloid plaques

Teemu Natunen et al. Mol Neurodegener. .

Abstract

Background: Alzheimer's disease (AD) is the most common neurodegenerative disease and type 2 diabetes (T2D) plays an important role in conferring the risk for AD. Although AD and T2D share common features, the common molecular mechanisms underlying these two diseases remain elusive.

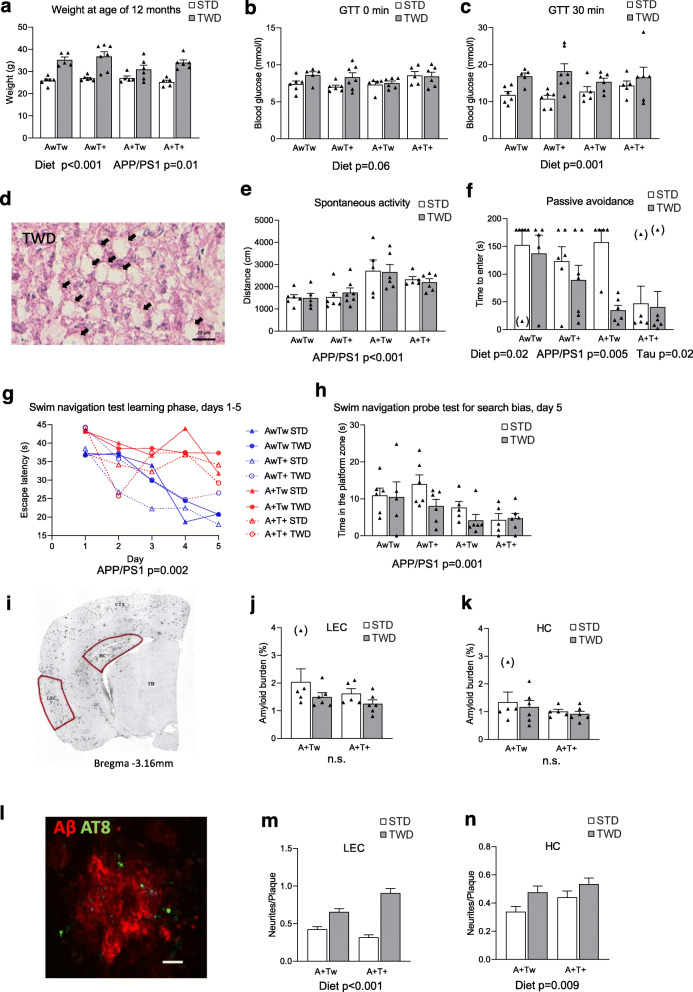
Methods: Mice with different AD- and/or tauopathy-linked genetic backgrounds (APPswe/PS1dE9, Tau P301L and APPswe/PS1dE9/Tau P301L) were fed for 6 months with standard diet or typical Western diet (TWD). After behavioral and metabolic assessments of the mice, the effects of TWD on global gene expression as well as dystrophic neurite and microglia pathology were elucidated. Consequently, mechanistic aspects related to autophagy, cell survival, phagocytic uptake as well as Trem2/Dap12 signaling pathway, were assessed in microglia upon modulation of PI3K-Akt signaling. To evaluate whether the mouse model-derived results translate to human patients, the effects of diabetic phenotype on microglial pathology were assessed in cortical biopsies of idiopathic normal pressure hydrocephalus (iNPH) patients encompassing β-amyloid pathology.

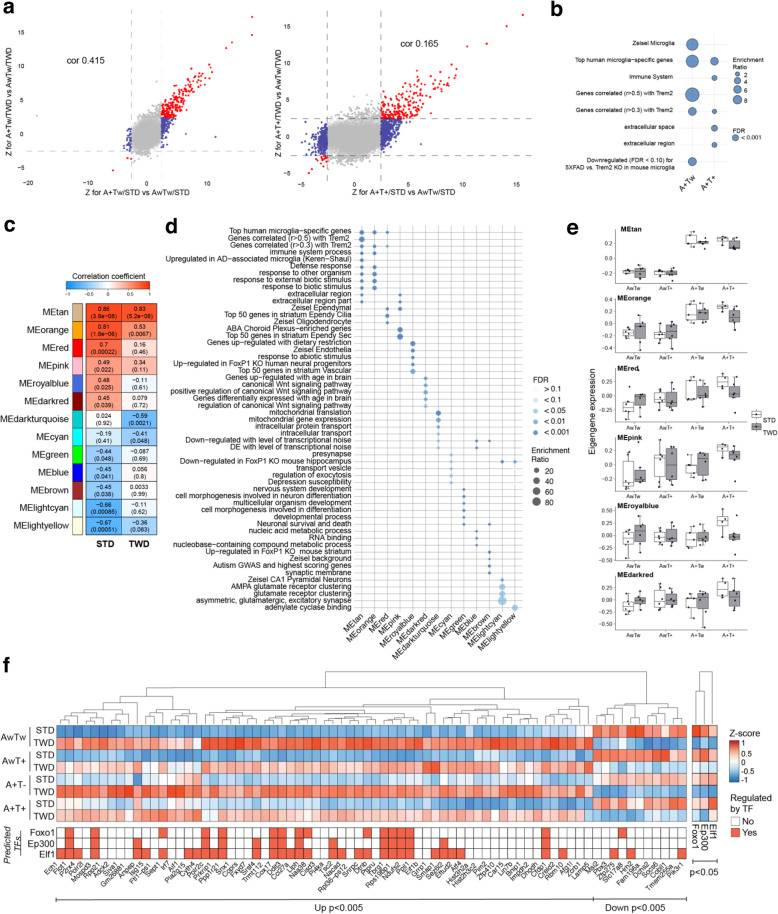
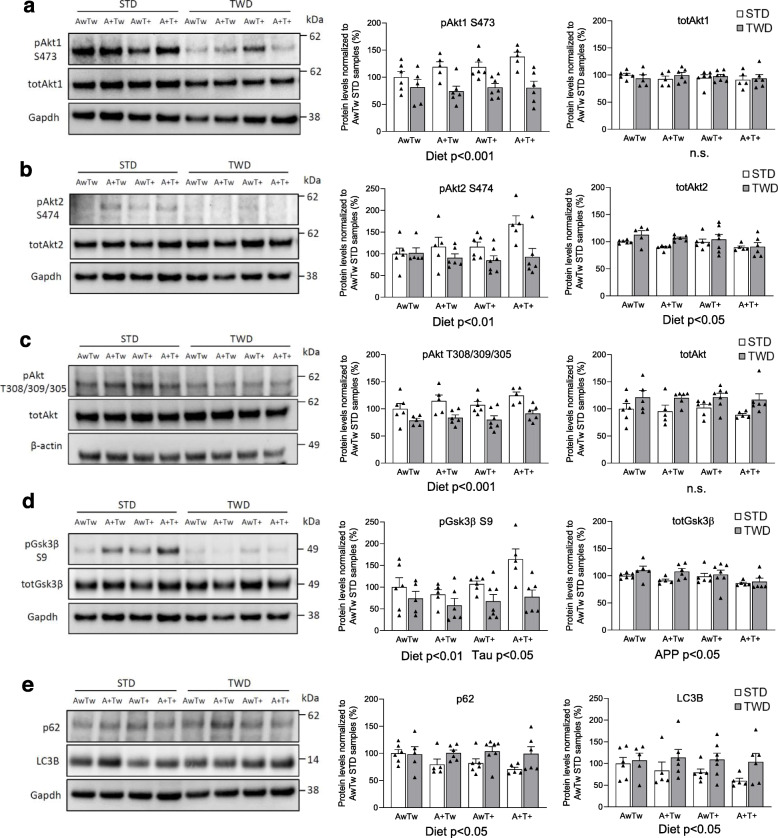
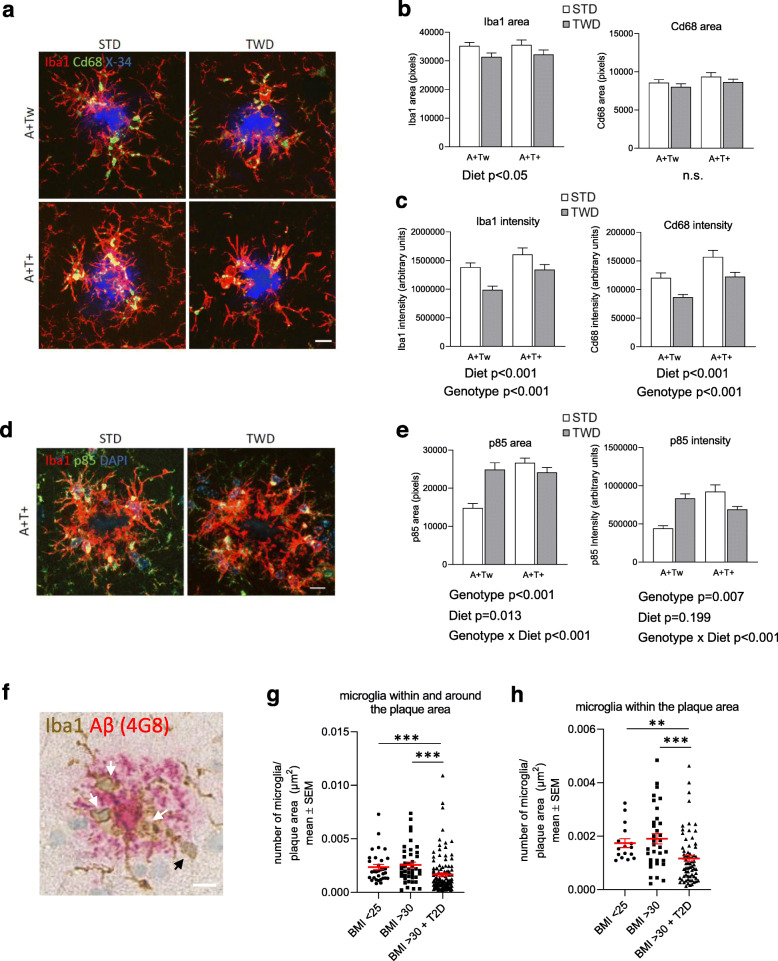
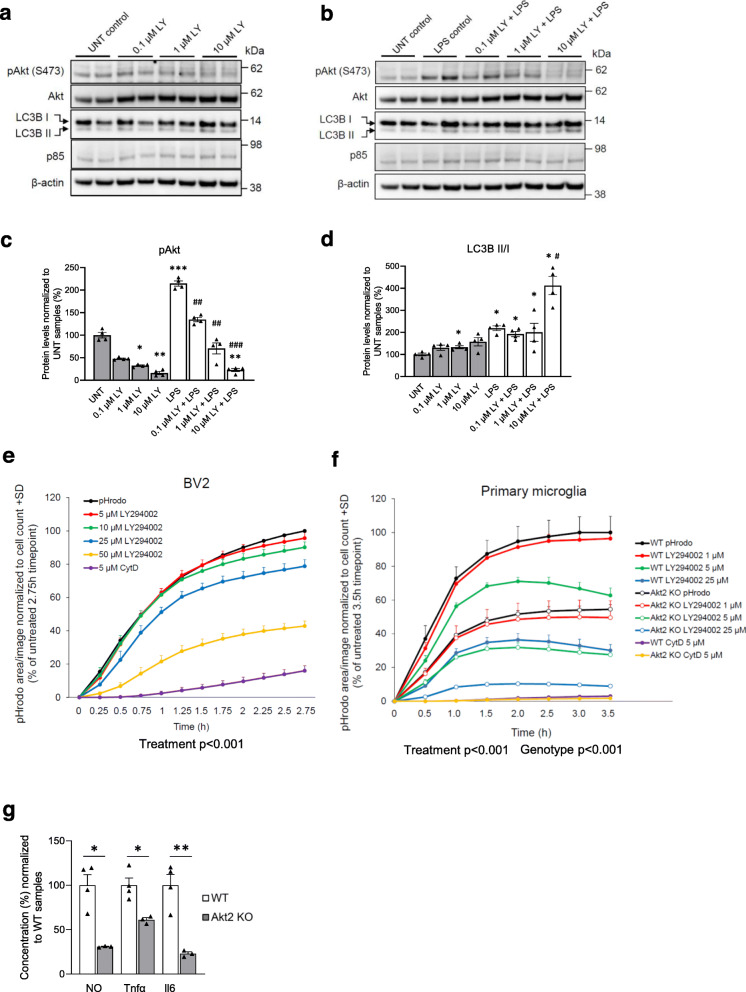
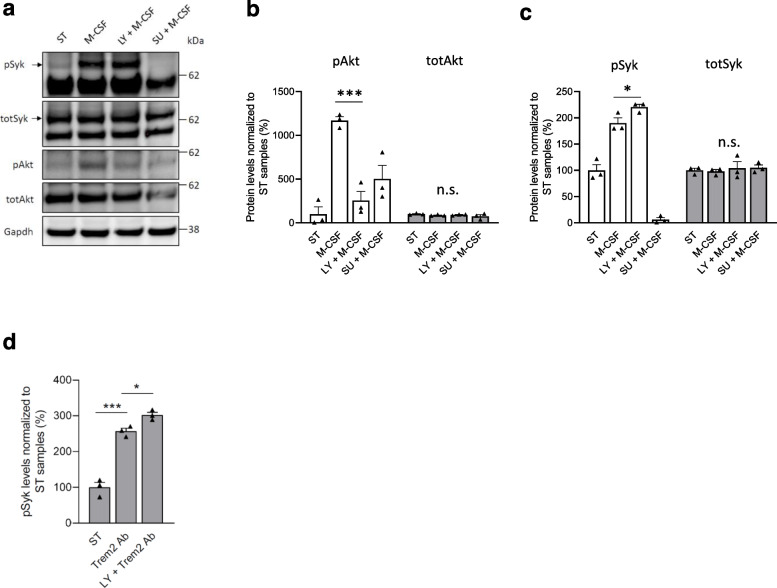
Results: TWD led to obesity and diabetic phenotype in all mice regardless of the genetic background. TWD also exacerbated memory and learning impairment in APPswe/PS1dE9 and Tau P301L mice. Gene co-expression network analysis revealed impaired microglial responses to AD-related pathologies in APPswe/PS1dE9 and APPswe/PS1dE9/Tau P301L mice upon TWD, pointing specifically towards aberrant microglial functionality due to altered downstream signaling of Trem2 and PI3K-Akt. Accordingly, fewer microglia, which did not show morphological changes, and increased number of dystrophic neurites around β-amyloid plaques were discovered in the hippocampus of TWD mice. Mechanistic studies in mouse microglia revealed that interference of PI3K-Akt signaling significantly decreased phagocytic uptake and proinflammatory response. Moreover, increased activity of Syk-kinase upon ligand-induced activation of Trem2/Dap12 signaling was detected. Finally, characterization of microglial pathology in cortical biopsies of iNPH patients revealed a significant decrease in the number of microglia per β-amyloid plaque in obese individuals with concomitant T2D as compared to both normal weight and obese individuals without T2D.

Conclusions: Collectively, these results suggest that diabetic phenotype in mice and humans mechanistically associates with abnormally reduced microglial responses to β-amyloid pathology and further suggest that AD and T2D share overlapping pathomechanisms, likely involving altered immune function in the brain.

Keywords: Alzheimer’s disease; Dystrophic neurites; Microglia; PI3K-Akt signaling; Type 2 diabetes; Typical Western diet.


Conflict of interest statement

The authors declared no potential conflicts of interest with respect to the research, authorship, and/or publication of this article.

Figures

Fig. 1
Fig. 1
TWD leads to T2D, memory impairment and increased number of dystrophic neurites in mice with AD-linked genetic backgrounds. a Weight of mice at age of 12 months (Two-way ANOVA). b Glucose tolerance test (GTT) results after 3 h fasting (Two-way ANOVA). c Serum glucose levels in GTT after 30 min of D-glucose injection (p = 0.001, Two-way ANOVA). d Representative liver sample image of TWD. Mice with TWD had significantly higher fatty liver score as compared to mice with STD (p < 0.001, Mann-Whitney). Black arrows indicate lipid vacuoles. Scale bar 20 μm. e Assessment of spontaneous activity (p < 0.001, Two-way ANOVA). f Passive avoidance test revealed impaired performance of mice with TWD as compared to mice with STD (diet effect, p = 0.02, Two-way ANOVA). Also, AD and tauopathy-associated transgenes impaired the performance (A+ = APPswe/PS1dE9; p < 0.001 and T+ = Tau P301L; p < 0.001, Two-way ANOVA). Three outliers were left out from statistical analysis (in brackets). g In five-day learning phase of Morris swim navigation test, mice with A+ transgene (APPswe/PS1dE9) (red lines) did not learn to find the platform as fast as mice without A+ transgene (blue lines, p = 0.002, Two-way ANOVA), while TWD and T+ transgene (Tau P301L) did not affect learning. h On day five, mice with A+ transgene spent significantly less time in platform zone (p = 0.001, Two-way ANOVA). Also, mice with TWD spent less time in platform zone as compared to mice with STD, but the difference did not reach statistical significance (p < 0.09, Two-way ANOVA). i A representative image of APPswe/PS1dE9 mouse coronal brain section used for assessing β-amyloid plaque load from lateral entorhinal cortex (LEC) and from dentate gyrus (DG) of hippocampus (HC). j Amyloid burden quantification in LEC, and k in HC. l A representative fluorescence microscope image of APPswe/PS1dE9 mouse coronal brain section showing AT8-positive dystrophic neurites around β-amyloid plaques. Scale bar = 10 μm. m Quantification of dystrophic neurites/plaque in LEC showing significant increase in TWD mice as compared to STD mice (p < 0.001). n Also, in HC number of dystrophic neurites per plaque was increased in TWD mice as compared to STD mice (p = 0.009). All results are shown as mean + SEM, behavioral tests: n = 5–7 mice/group, Two-way ANOVA, immunohistochemistry: n = 5–6 mice/group, 3 brain slices/mouse. Dystrophic neurites around β-amyloid plaques (diameter > 10 μM) were counted, Kruskal-Wallis H-test. AwTw = wild-type, AwT+ = Tau P301L, A + Tw = APPswe/PS1dE9, A + T+ = APPswe/PS1dE9 x Tau P301L
Fig. 2
Fig. 2
Transcriptomic and co-expression network analysis reveal impaired microglial response to AD-related pathology. a Transcriptome-wide response comparison of STD and TWD mice to A+ and A+T+ background. Plots show Z-statistics derived from DE analysis for A+Tw/STD vs. AwTw/STD (x-axis) and A+Tw/TWD vs. AwTw/TWD (y-axis) (left) and A+T+/STD vs. AwTw/STD (x-axis) and A+T+/TWD vs. AwTw/TWD (y-axis) (right). Points (genes) showing concordant response in STD and TWD cases are indicated in red, and discordant response for TWD as compared to STD, in blue. Genome-wide correlations of Z statistics and the corresponding correlation values are indicated on the top of each panel. b Enrichment analysis of genes showing discordant response to A+ or A+T+ background in TWD mice as compared to STD mice (blue dots in a). Enrichment ratio = number of observed divided by the number of expected genes. c WGCNA modules significantly associated to genotype in either STD or TWD mice. The color and value in the box represent correlation coefficient value. The value in parentheses represents corresponding correlation p-value. d Enrichment analysis for WGCNA module genes. Color indicates FDR value and size enrichment ratio. e Box plots representing eigengene values for modules positively associated with genotype. Points represent eigengene values for each mouse in that group. Box plots show the median, 25th and 75th percentiles, error bars show 1.5 interquartile ranges. f Z-score value heatmap of DE genes for STD vs. TWD mice with FDR < 0.005 and enriched transcription factors (TFs) with FDR < 0.05. n = 4–6 mice/group. AwTw = wild-type, AwT+ = Tau P301L, A+Tw = APPswe/PS1dE9, A+T+ = APPswe/PS1dE9 x Tau P301L
Fig. 3
Fig. 3
TWD induces impaired Akt-Gsk3β signaling in the brain. a Western blot analysis of hippocampal lysates showing decreased phosphorylation of S473 in Akt1 in mice with TWD as compared to STD (p < 0.001). Diet had no effect on total Akt1 levels. b Similarly, phosphorylation of S474 in Akt2 is decreased in mice with TWD as compared to STD (p < 0.01). Diet had a minor, but statistically significant effect on total Akt2 levels (p < 0.05). c Also, phosphorylation of T308/309/305 residue in Akt1/2/3, respectively, was significantly decreased in mice with TWD as compared to STD (p < 0.001). Total Akt1/2/3 levels showed no significant changes. d Phosphorylation of Gsk3β at the inhibitory S9 residue was significantly decreased in mice with TWD as compared to mice with STD (p < 0.01). A+ transgene (APPswe/PS1dE9) increased slightly, but significantly Gsk3β S9 phosphorylation (p < 0.05) as well as total Gsk3β levels (p < 0.05). e A representative Western blot image and quantification of hippocampal lysates showing increased levels of the autophagy markers p62 and LC3B in TWD mice as compared to STD mice (p < 0.05). Phosphorylated protein levels were normalized to their respective total protein levels in cell lysates and total protein levels were normalized to Gapdh or β-actin. All results are shown as mean + SEM, n = 5–7 mice/group, Two-way ANOVA. AwTw = wild-type, AwT+ = Tau P301L, A+Tw = APPswe/PS1dE9, A+T+ = APPswe/PS1dE9 x Tau P301L
Fig. 4
Fig. 4
TWD and T2D alter microglial response to β-amyloid plaques in AD mice and human brain biopsies. a Representative immunofluorescence images of β-amyloid plaques stained with X-34 (blue) surrounded by Iba1 positive microglia (red) and lysosomes stained with Cd68 (green) from A+Tw and A+T+ mice from both STD and TWD groups. Scale bar 10 μm. b Quantification revealed that TWD significantly (p < 0.05) decreased Iba1 positive area (pixels) as compared to STD in both A+Tw and A+T+ mice, while diet showed no effect on Cd68 positive area. c Also, intensity of both Iba1 and Cd68 (arbitrary units) was significantly decreased (p < 0.001, both) in mice with TWD as compared to STD in both genotypes. Furthermore, T+ transgene (Tau P301L) significantly increased both Iba1 and Cd68 intensity (p < 0.001, both). d Representative immunofluorescence images of Iba1 positive microglia (red) and p85α staining (green) around β-amyloid plaques in hippocampus of A+T+ mice from both STD and TWD groups. Scale bar 10 μm. e Quantification of p85α revealed statistically significant genotype x diet interaction (p < 0.001) in both p85α area and p85α intensity. T+ transgene significantly increased both p85α area (p < 0.001) and p85α intensity (p = 0.007), while diet had opposing effects on p85α depending on the genotype. a-e results are shown as mean + SEM, n = 5–6 mice/group, Two-Way ANOVA. f Representative image of frontal cortex biopsy sample from probable iNPH subject co-stained for IBA1 (brown) and β-amyloid (red). White arrows denote microglia within the plaque area, and black arrow denotes microglia around the plaque area. Scale bar 10 μm. g Quantification of IBA1-positive microglia within and around the β-amyloid plaque. h Quantification of IBA1-positive microglia within the plaque area. g-h; results are shown as mean ± SEM, n = 3–5 subjects/group. AwTw = wild-type, AwT+ = Tau P301L, A+Tw = APPswe/PS1dE9, A+T+ = APPswe/PS1dE9 x Tau P301L
Fig. 5
Fig. 5
Modulation of PI3K-Akt pathway affects autophagic and phagocytic activity as well as inflammatory response in microglial cells. a A representative Western blot image of lysates of BV2 cells treated with LY294002 (LY) (0.1 μM – 10 μM), and b with LY294002 together with LPS. c Quantification revealed that LY294002 decreased Akt S473 phosphorylation levels dose-dependently in cells treated with LY294002 and together with LPS and LY294002. d Quantification of LC3B II and I levels revealed a significant increase in LCB3II/I ratio by LY294002. e Phagocytic activity in BV2 cells was assessed using pHrodo bioparticles and fluorescence emission was measured in the IncuCyte live cell imaging device in every 15 min. BV2 cells were treated with four different concentrations of PI3K inhibitor LY294002 (5 μM – 50 μM) and with 5 μM Cytochalasin D (CytD). LY294002 decreased phagocytic activity dose-dependently (p < 0.001) and CytD blocked phagocytosis almost completely. a-d; Data are presented as mean + SEM from four biological replicates. Mann-Whitney U-test, *p < 0.05, **p < 0.01, ***p < 0.001 vs. untreated control, #p < 0.05, ##p < 0.01, ###p < 0.001 vs. LPS control. f Phagocytic activity of primary microglia isolated from WT and Akt2 KO mice was assessed similarly as in BV2 cells using pHrodo bioparticles and fluorescence emission was measured in the IncuCyte live cell imaging device in every 30 min. Cells were treated with three different concentrations of LY294002 (1 μM – 25 μM) and with 5 μM CytD. LY294002 decreased phagocytic activity dose-dependently (p < 0.001) and Akt2 KO cells showed significantly decreased phagocytic activity as compared to WT cells (p < 0.001). CytD blocked phagocytosis almost completely in both WT and Akt2 KO cells. e-f; Data are presented as mean + SEM from three biological replicates in technical quadruplets, One-way ANOVA, LSD (e) and Two-way ANOVA (f). g Levels of inflammatory markers, nitric oxide (NO), tumor necrosis factor α (Tnfα), and interleukin 6 (Il6) were significantly lower in Akt2 KO primary microglia as compared to WT primary microglia after 48 h LPS + IFNγ -treatment. Data presented as mean % + SEM, n = 3–4. *p < 0.05, **p < 0.01, T-test
Fig. 6
Fig. 6
Inhibition of PI3K activity affects phosphorylation of Syk in microglial cells. a Western blot analysis of lysates of BV2 cells pre-treated with LY294002 (LY, 1 μM) or Src-kinase inhibitor SU6656 (SU, 2 μM) prior to M-CSF treatment. b Quantification of Akt S473 phosphorylation levels revealed a significant decrease in LY294002-treated samples while total Akt levels were unchanged. c Quantification of Syk (Y525/526) phosphorylation levels revealed a significant increase in LY294002-treated samples while total Syk levels were unchanged. d Phosphorylation status of Syk was significantly increased in WT primary microglia treated with Trem2 antibody for 5 min as compared to control cells (ST). LY294002 treatment together with Trem2 antibody further increased phosphorylation. ST; starvation only, M-CSF; 100 ng/ml for 5 min, LY; 1 μM LY294002 for 1 h before M-CSF, SU; 2 μM Src-kinase inhibitor SU6656 treatment 20 min before M-CSF. Data presented as mean % + SEM, n = 3, *p < 0.05, **p < 0.01, ***p < 0.001, One-way ANOVA, LSD

Similar articles

Cited by

References

    1. Bloom GS. Amyloid-β and tau: the trigger and bullet in Alzheimer disease pathogenesis. JAMA Neurol. 2014;71(4):505–508. doi: 10.1001/jamaneurol.2013.5847. - DOI - PubMed
    1. Montine TJ, Phelps CH, Beach TG, Bigio EH, Cairns NJ, Dickson DW, et al. National institute on aging-Alzheimer’s association guidelines for the neuropathologic assessment of Alzheimer’s disease: a practical approach. Acta Neuropathol. 2012;123:1–11. doi: 10.1007/s00401-011-0910-3. - DOI - PMC - PubMed
    1. Hong S, Beja-Glasser VF, Nfonoyim BM, Frouin A, Li S, Ramakrishnan S, et al. Complement and microglia mediate early synapse loss in Alzheimer mouse models. Science (80- ) 2016;352:712–716. doi: 10.1126/science.aad8373. - DOI - PMC - PubMed
    1. Irie F, Fitzpatrick AL, Lopez OL, Kuller LH, Peila R, Newman AB, et al. Enhanced risk for Alzheimer disease in persons with type 2 diabetes and APOE epsilon4: the cardiovascular health study cognition study. Arch Neurol. 2008;65(1):89–93. doi: 10.1001/archneurol.2007.29. - DOI - PMC - PubMed
    1. De Felice FG, Ferreira ST. Inflammation, defective insulin signaling, and mitochondrial dysfunction as common molecular denominators connecting type 2 diabetes to Alzheimer disease. Diabetes. 2014;63(7):262–272. doi: 10.2337/db13-1954. - DOI - PubMed

Publication types