

Why do some countries do better or worse in life expectancy relative to income? An analysis of Brazil, Ethiopia, and the United States of America
- PMID: 33168040
- PMCID: PMC7654592
- DOI: 10.1186/s12939-020-01315-z
Why do some countries do better or worse in life expectancy relative to income? An analysis of Brazil, Ethiopia, and the United States of America
Abstract
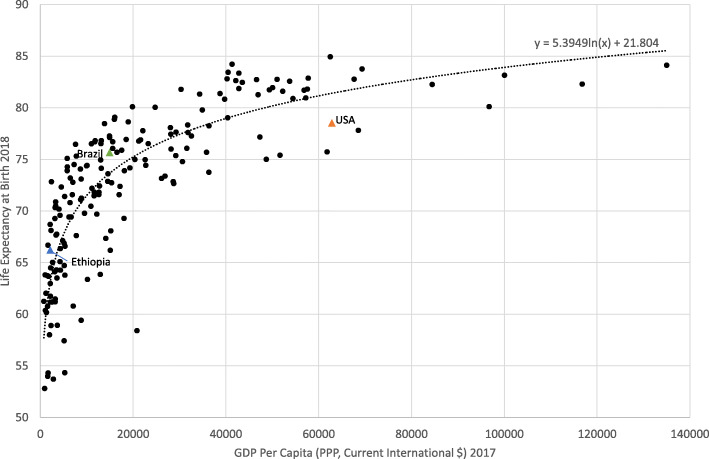
Background: While in general a country's life expectancy increases with national income, some countries "punch above their weight", while some "punch below their weight" - achieving higher or lower life expectancy than would be predicted by their per capita income. Discovering which conditions or policies contribute to this outcome is critical to improving population health globally.
Methods: We conducted a mixed-method study which included: analysis of life expectancy relative to income for all countries; an expert opinion study; and scoping reviews of literature and data to examine factors that may impact on life expectancy relative to income in three countries: Ethiopia, Brazil, and the United States. Punching above or below weight status was calculated using life expectancy at birth and gross domestic product per capita for 2014-2018. The scoping reviews covered the political context and history, social determinants of health, civil society, and political participation in each country.
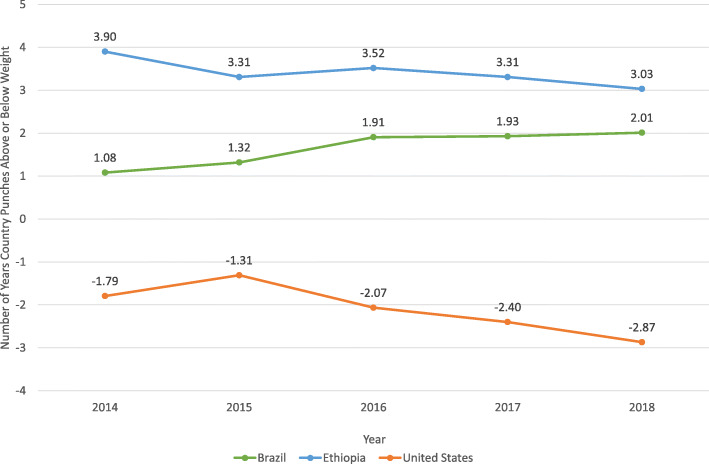
Results: Possible drivers identified for Ethiopia's extra 3 years life expectancy included community-based health strategies, improving access to safe water, female education and gender empowerment, and the rise of civil society organisations. Brazil punched above its weight by 2 years. Possible drivers identified included socio-political and economic improvements, reduced inequality, female education, health care coverage, civil society, and political participation. The United States' neoliberal economics and limited social security, market-based healthcare, limited public health regulation, weak social safety net, significant increases in income inequality and lower levels of political participation may have contributed to the country punching 2.9 years below weight.
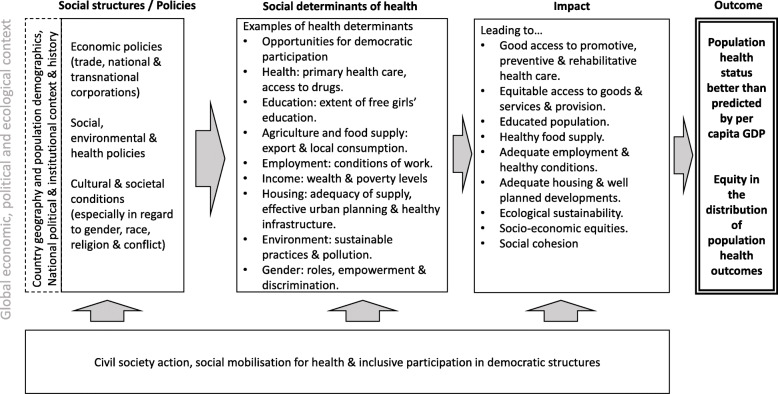
Conclusions: The review highlighted potential structural determinants driving differential performance in population health outcomes cross-nationally. These included greater equity, a more inclusive welfare system, high political participation, strong civil society and access to employment, housing, safe water, a clean environment, and education. We recommend research comparing more countries, and also to examine the processes driving within-country inequities.
Keywords: Civil society; Life expectancy; Policy; Population health; Social determinants of health.
Conflict of interest statement
The authors declare that they have no competing interests.
Figures
References
-
- Life expectancy at birth, total (years) [https://data.worldbank.org/indicator/SP.DYN.LE00.IN].
-
- Schultz TP. Health human capital and economic development. J Afr Econ. 2010;19:iii12–iii80. doi: 10.1093/jae/ejq015. - DOI
-
- Jetter M, Laudage S, Stadelmann D. The intimate link between income levels and life expectancy: global evidence from 213 years*. Soc Sci Q. 2019;100:1387–1403. doi: 10.1111/ssqu.12638. - DOI
