. 2020 Nov 24;117(47):29937-29947.
doi: 10.1073/pnas.2000790117. Epub 2020 Nov 9.

The potassium channel subunit Kvβ1 serves as a major control point for synaptic facilitation

Affiliations

The potassium channel subunit Kvβ1 serves as a major control point for synaptic facilitation

In Ha Cho et al. Proc Natl Acad Sci U S A. .

Abstract

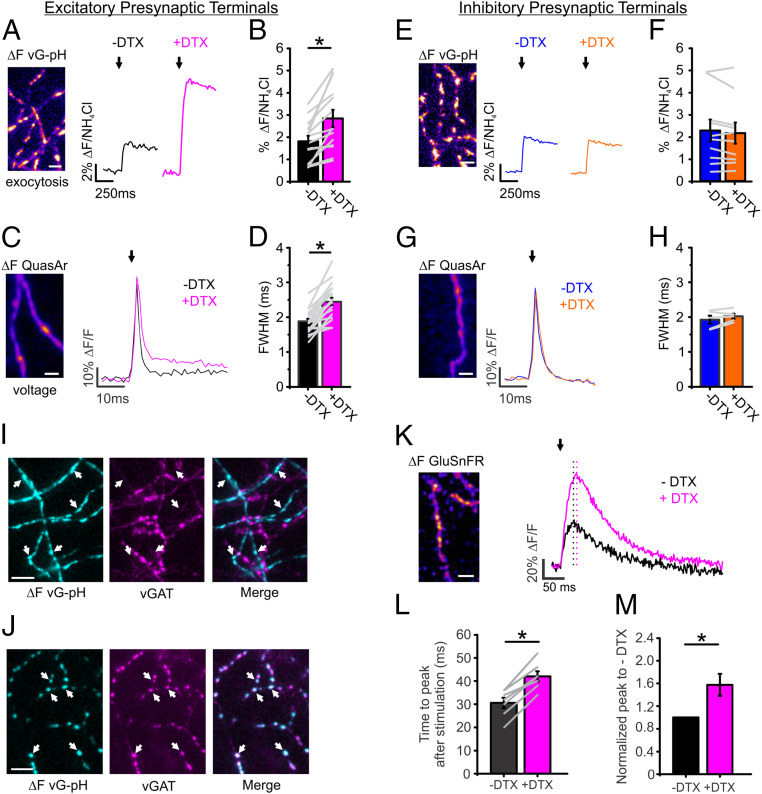
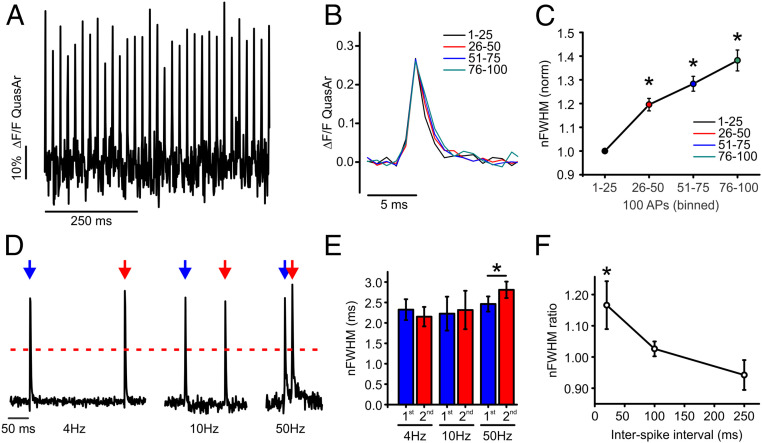
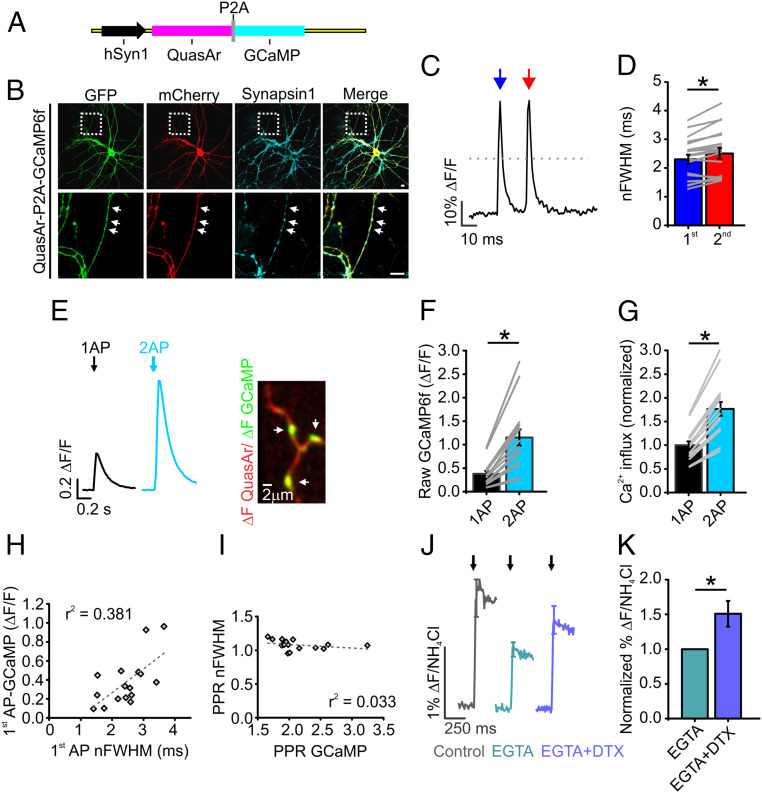
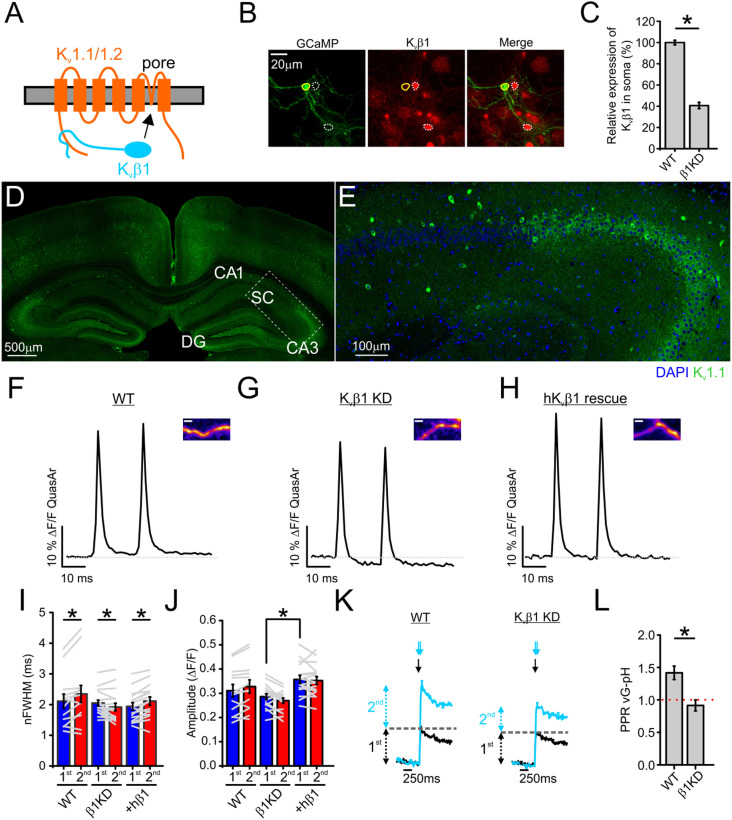
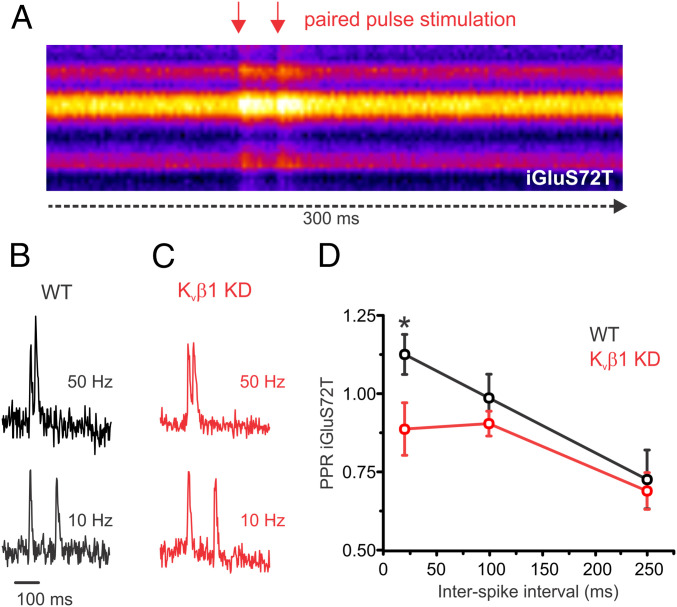
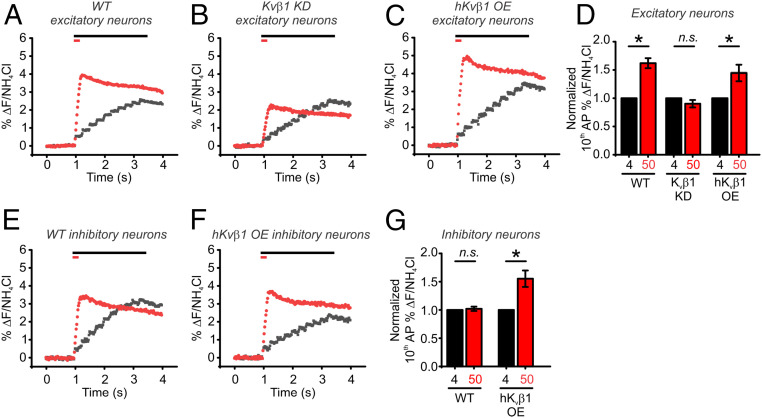
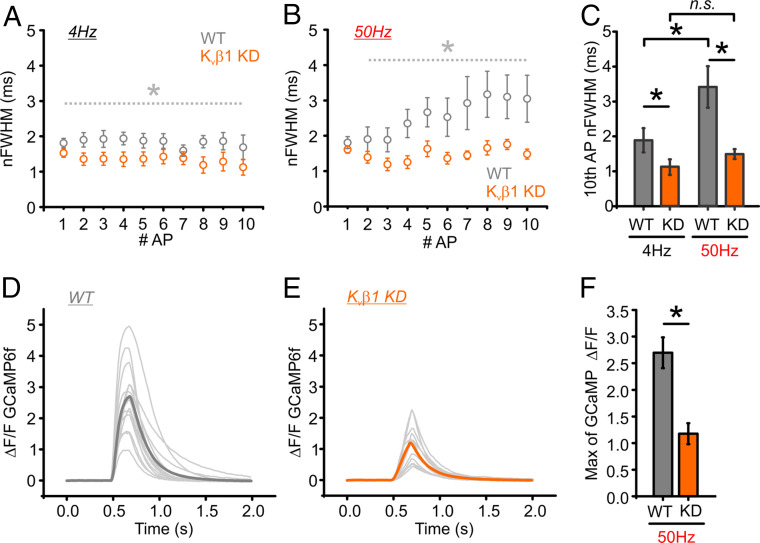
Analysis of the presynaptic action potential's (APsyn) role in synaptic facilitation in hippocampal pyramidal neurons has been difficult due to size limitations of axons. We overcame these size barriers by combining high-resolution optical recordings of membrane potential, exocytosis, and Ca2+ in cultured hippocampal neurons. These recordings revealed a critical and selective role for Kv1 channel inactivation in synaptic facilitation of excitatory hippocampal neurons. Presynaptic Kv1 channel inactivation was mediated by the Kvβ1 subunit and had a surprisingly rapid onset that was readily apparent even in brief physiological stimulation paradigms including paired-pulse stimulation. Genetic depletion of Kvβ1 blocked all broadening of the APsyn during high-frequency stimulation and eliminated synaptic facilitation without altering the initial probability of vesicle release. Thus, using all quantitative optical measurements of presynaptic physiology, we reveal a critical role for presynaptic Kv channels in synaptic facilitation at presynaptic terminals of the hippocampus upstream of the exocytic machinery.

Keywords: action potential; exocytosis; potassium channel; synapse; synaptic plasticity.


Conflict of interest statement

The authors declare no competing interest.

Figures

Fig. 1.
Fig. 1.
Kv1 channels are expressed exclusively in excitatory presynaptic terminals. (AD) Measurements of exocytosis using vG-pH (A and B) for both control (black) and DTX-treated (magenta) excitatory neurons; arrows indicate when stimulation was applied. Example of recording of voltage using QuasAr (C) and corresponding FWHM (D). (Scale bar, 10 μm.) (vG-pH, n = 16 cells, *P < 0.001, paired t test; QuasAr, n = 20 cells, *P < 0.01, paired t test). (EH) Measurements of exocytosis using vG-pH (E and F) in control (blue) and DTX-treated (orange) inhibitory neurons. Representative recording of voltage using Quasar (G) and the corresponding averaged FWHM (H). Arrow in G indicates when stimulation was applied (vG-pH, n = 10 cells; QuasAr, n = 5 cells). (I and J) Representative images of vGAT antibody live staining in excitatory terminals (I) and inhibitory terminals (J). Colocalization of vGAT-staining signal with active synapses marked by vG-pH response is indicated by the white arrows. (Scale bar, 10 µm.) (K) Representative ΔF image of GluSnFR upon single stimulation. Average trace of GluSnFR for both control (black) and DTX-treated (magenta) excitatory neurons; arrow indicates when stimulation was applied; black dotted line indicates the peak of control, and magenta dotted line indicates the peak of DTX-treated neurons, showing the latency (n = 7 cells). (Scale bar, 10 µm.) (L and M) The corresponding averaged time to peak after stimulation (L) and normalized peak to control (M) are shown. (*P < 0.05, paired t test). Extracellular Ca2+ concentration is 2 mM in all experiments.
Fig. 2.
Fig. 2.
Activity-dependent broadening of APsyn in excitatory nerve terminals of hippocampal neurons. (A) Example APsyn traces evoked by 50-Hz stimulation. (B) Representative average AP traces from four separate bins of 25 APs during a 100-AP stimulation train delivered at 50 Hz. (C) Plot of normalized nFWHM for four separate bins from excitatory cells. Asterisk indicates significance relative to first AP bin in excitatory cells (n = 39 cells, *P < 0.05, ANOVA with Tukey’s post hoc comparisons). (D) Representative measurement of QuasAr with 2 AP at 4-, 10-, or 50-Hz stimulation in excitatory neurons. Peaks are normalized to the first peak of each measurment. Blue arrow indicates the first stimulation, and red arrow indicates the second stimulation. Red dashed line represents the half maximum of the peak where the width was measured. (E) Average nFWHM for the first (blue) and second (red) AP waveform in paired-pulse stimulation of excitatory neurons (n = 10 cells for 4-Hz condition; n = 8 cells for 10-Hz condition; n = 13 cells for 50-Hz condition; *P < 0.05, paired t test). Error bars indicate mean ± SEM. (F) Average nFWHM ratio (second/first AP) is plotted as a function of a stimulation interval (*P < 0.05, ANOVA with Tukey’s post hoc comparisons). Extracellular Ca2+ concentration is 2 mM in all experiments.
Fig. 3.
Fig. 3.
APsyn broadening alters the profile of Ca2+ entry into synaptic terminals. (A) Schematic of vector describing bicistronic expression of QuasAr and GCaMP separated by a P2A peptide that cleaves the two proteins for separate localization. (B) Immunofluorescence of QuasAr-P2A-GCaMP expression in axons. GCaMP and QuasAr were stained with anti-GFP and anti-mCherry antibodies, respectively. QuasAr contains a nonfluorescent form of the mOrange-tag to prevent cross talk with the GFP signal. Synapsin1 staining was used for marking presynaptic terminals (marked by arrows). (Scale bar, 10 µm.) (C) Representative measurement of QuasAr from the axon of an excitatory neuron with en passant synapses with 2 APs at 50-Hz stimulation. Blue arrow indicates the first stimulation, and red arrow indicates the second stimulation. Gray dotted line represents the half maximum where the width was measured. (D) Average nFWHM for the first (blue) and second (red) AP waveforms in paired-pulse stimulation of excitatory neurons (n = 19, *P < 0.001, paired t test). Error bars indicate mean ± SEM. (E, Left) Representative trace of GCaMP response to a single AP (black) and paired-pulse stimulation (cyan). (E, Right) Representative image of QuasAr ΔF (red) and GCaMP ΔF (green) during the stimulation. (Scale bar, 2 µm.) (F) Average GCaMP fluorescence in response to a single AP (black) and paired-pulse stimulation (cyan) (n = 16 individual cells). (G) Average change in Ca2+ as measured by converting GCaMP fluorescence to relative changes in Ca2+ to account for the nonlinearity of the GCaMP (Materials and Methods) (n = 16 individual cells), *P < 0.001, paired t test. (H) Correlation between first AP-induced Ca2+ influx and nFWHM of first AP. Linear fit is shown using a dashed line. (I) Correlation between paired-pulse ratio of GCaMP (PPR GCaMP) and nFWHM (PPR nFWHM) using a linear fit. (J) Measurements of exocytosis using vG-pH for control (gray), EGTA (turquoise), and EGTA with DTX (purple) neurons upon single-AP stimulation. Arrows indicate when stimulation was applied. (K) Normalization of percentage of total vesicles to EGTA condition (n = 8 cells, *P < 0.05, paired t test). Extracellular Ca2+ concentration is 2 mM in all experiments.
Fig. 4.
Fig. 4.
Kvβ1-induced Kv1 inactivation is critical to APsyn broadening with paired-pulse stimulation. (A) Cartoon of Kvβ1-induced inactivation of Kv1.1/1.2 complexes. (B) Immunofluorescence staining for GCaMP (using anti-GFP antibody) and endogenous Kvβ1 in primary cultured hippocampal neurons. Solid circles indicate the soma of a neuron cotransfected with GCaMP and Kvβ1 shRNA, and dashed circles indicate those of untransfected neurons. (Scale bar, 20 µm.) (C) Quantification of relative expression of Kvβ1 in soma of Kvβ1 shRNA transfected neurons compared with WT neurons (n = 50 for control; n = 19 cells for Kvβ1 shRNA transfected neurons; *P < 0.001, Student’s t test). (D and E) Immunohistochemical staining of adult mouse brain slices with antibodies against Kv1.1 channels (green) and the nuclear marker DAPI (blue). (Inset in D) The transition into the CA1 region where Schaffer collateral (SC) axons are prominent with magnification of Inset shown in E. DG: dentate gyrus; CA1 and CA3: regions of the hippocampus. (F and H) Average traces of AP waveforms in response to 2 AP at 50-Hz stimulation from control (F), Kvβ1 KD (G), and hKvβ1 rescue (H) neurons. Insets provide a representative QuasAr ΔF image from each condition. (Scale bar, 2 µm.) (I and J) Average nFWHM (I) and amplitude (J) for the first (blue) and second (red) AP waveform as shown in FH (WT, n = 13 cells; Kvβ1 KD, n = 17 cells; hKvβ1 rescue, n = 16 cells; *P < 0.05, Student’s t test for amplitude comparison between different conditions, paired t test for nFWHM). (K) Average traces of exocytosis for 1 AP (black) or 2 AP delivered at 50 Hz (cyan) from control and Kvβ1 KD neurons as measured with vG-pH. Black and cyan arrow(s) in K indicates when stimulation was applied for each corresponding trace respectively. (L) Average vG-pH ratio from control and Kvβ1 KD neurons (control, n = 8 cells; Kvβ1 KD, n = 9 cells; *P < 0.01, Student’s t test). Error bars indicate mean ± SEM. Extracellular Ca2+ concentration is 2 mM in all experiments.
Fig. 5.
Fig. 5.
Paired-pulse measurements of glutamate release is impaired in Kvβ1 KD neurons. Optical measurements of glutamate release from individual presynaptic terminals expressing ultrafast iGluSnFR S72T during paired-pulse stimulation at various frequencies. (A) Kymograph of a representative recording across the axon of a hippocampal neuron recorded at 500 Hz and stimulated with a paired-pulse (50 Hz). Representative individual recordings of iGluSnFR S72T for a control (B) and Kvβ1 KD (C) neuron stimulated with 2APs at 50 Hz (Top) and 10 Hz (Bottom) normalized to the response of the first AP. (D) Average iGluSnFR paired-pulse ratio (normalized to glutamate reponse of first AP) from control and Kvβ1 KD neurons (control, n = 13 cells; Kvβ1 KD, n = 13 cells; *P < 0.05, Student’s t test; error bars represent SE). Note the selective impairment of release at 50 Hz compared to 10 and 4 Hz. Extracellular Ca2+ concentration is 2 mM in all experiments.
Fig. 6.
Fig. 6.
Synaptic facilitation is absent in Kvβ1 KD neurons. (AC) Average traces of pHluorin measurements of exocytosis for WT (A), Kvβ1 KD (B), and human Kvβ1 overexpressed (C) excitatory neurons in responses to 10 APs delivered at 4 Hz (black) or 50 Hz (red) as measured with vG-pH. Bars at top of the graphs indicate the duration of each stimulation. (D) Normalization of average fusion induced by the 10th AP as a percentage of total vesicle fluorescences measured by application of NH4Cl. Neurons were stimulated with 10 AP at 4 Hz (black) or 50 Hz (red) (WT neurons, n = 16 cells; Kvβ1 KD neurons, n = 8 cells; hKvβ1 OE neurons, n = 6 cells; *P < 0.05, paired t test). (E and F) Average traces of pHluorin measurements of exocytosis for WT (E) and hKvβ1 overexpressed (F) inhibitory neurons in responses to 10 APs delivered at 4 Hz (black) or 50 Hz (red) as measured with vG-pH. Bars at top of the graphs indicate the duration of each stimulation. (G) Normalization of average fusion induced by the 10th AP as a percentage of total vesicle fluorescences measured by application of NH4Cl. Neurons were stimulated with 10 AP at 4 Hz (black) or 50 Hz (red) (WT neurons, n = 7 cells; hKvβ1 OE neurons, n = 5 cells; *P < 0.05, paired t test). Extracellular Ca2+ concentration is 2 mM in all experiments.
Fig. 7.
Fig. 7.
AP broadening and Ca2+ accumulation are inhibited in Kvβ1 KD neurons. (A and B) Optical recording of APs in neurons expressing QuasAr stimulated with 10 AP at 4 Hz (A) and 50 Hz (B). nFWHMs of each AP across the stimulus train from WT (gray) and Kvβ1 KD (orange) cells are displayed (n = 16 trials per cell; WT = 9 cells; Kvβ1 KD = 7 cells). (C) Quantification of the averaged nFWHM of the 10th AP from WT and Kvβ1 KD (n = 9 cells for WT; n = 7 cells for Kvβ1 KD; *P < 0.05, Student’s t test). Error bars indicate mean ± SEM. (D and E) Ca2+ influx was measured with GCaMP6f in control (D) and Kvβ1 KD (E) neurons. The light gray traces represent individual experiments with the averaged Ca2+ influx depicted in dark gray (WT) or orange (Kvβ1 KD). (F) Quantification of the averaged GCaMP6f response of the 10th AP from WT and Kvβ1 KD neurons (n = 14 cells for WT; n = 11 cells for Kvβ1 KD; *P < 0.001, Student’s t test). Extracellular Ca2+ concentration is 2 mM in all experiments.

References

    1. Jackman S. L., Regehr W. G., The mechanisms and functions of synaptic facilitation. Neuron 94, 447–464 (2017). - PMC - PubMed
    1. Geiger J. R., Jonas P., Dynamic control of presynaptic Ca(2+) inflow by fast-inactivating K(+) channels in hippocampal mossy fiber boutons. Neuron 28, 927–939 (2000). - PubMed
    1. Jackson M. B., Konnerth A., Augustine G. J., Action potential broadening and frequency-dependent facilitation of calcium signals in pituitary nerve terminals. Proc. Natl. Acad. Sci. U.S.A. 88, 380–384 (1991). - PMC - PubMed
    1. Liu P. W., Blair N. T., Bean B. P., Action potential broadening in capsaicin-sensitive DRG neurons from frequency-dependent reduction of Kv3 current. J. Neurosci. 37, 9705–9714 (2017). - PMC - PubMed
    1. Ma Y., Bayguinov P. O., Jackson M. B., Action potential dynamics in fine axons probed with an axonally targeted optical voltage sensor. eNeuro 4, ENEURO.0146-17.2017 (2017). - PMC - PubMed

Publication types

MeSH terms

LinkOut - more resources