. 2020 Nov 24;117(47):29803-29810.
doi: 10.1073/pnas.2008213117. Epub 2020 Nov 9.

Identification of a brainstem locus that inhibits tumor necrosis factor

Affiliations

Identification of a brainstem locus that inhibits tumor necrosis factor

Adam M Kressel et al. Proc Natl Acad Sci U S A. .

Abstract

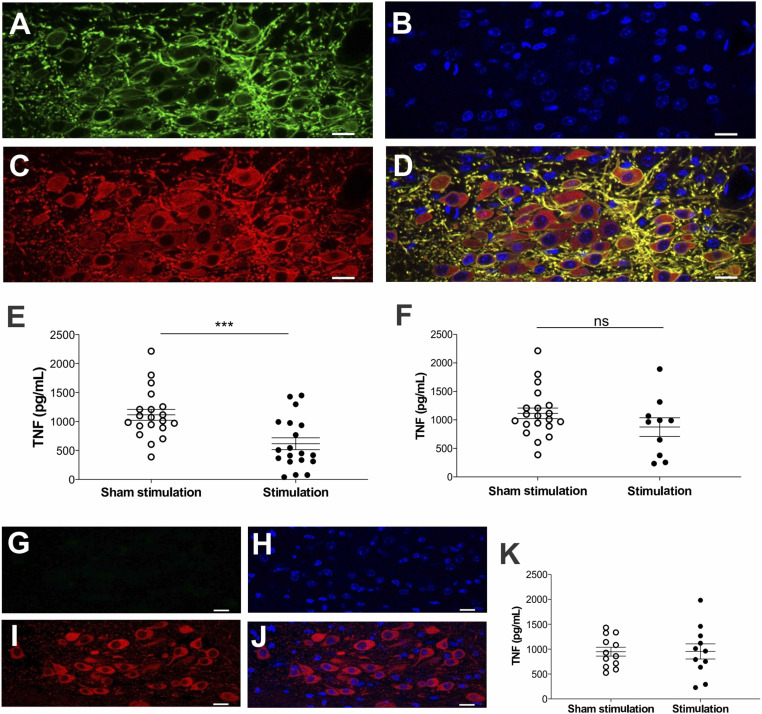
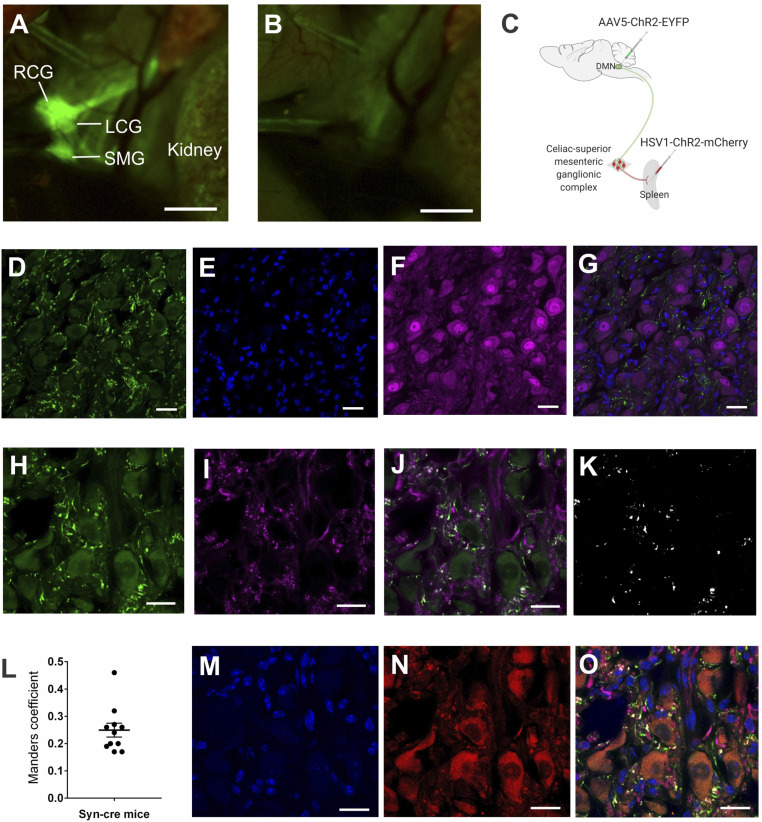
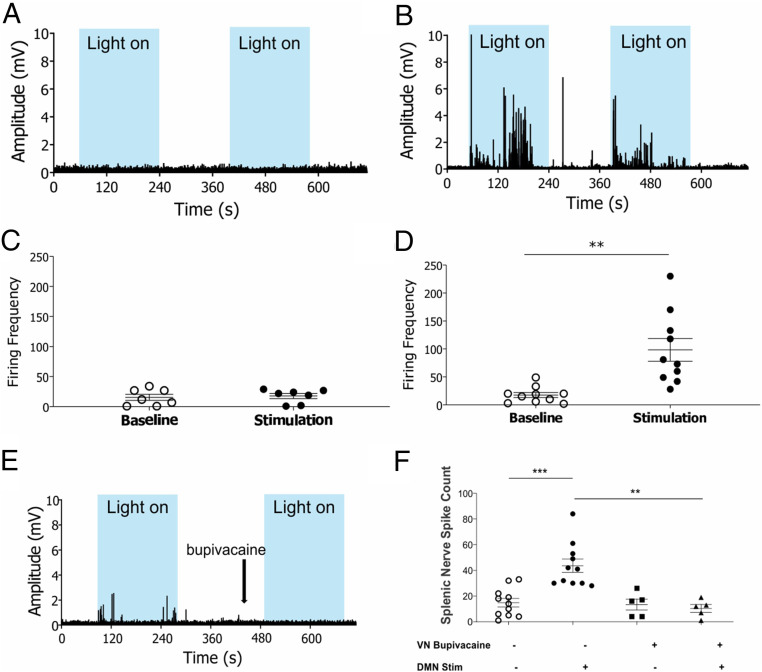
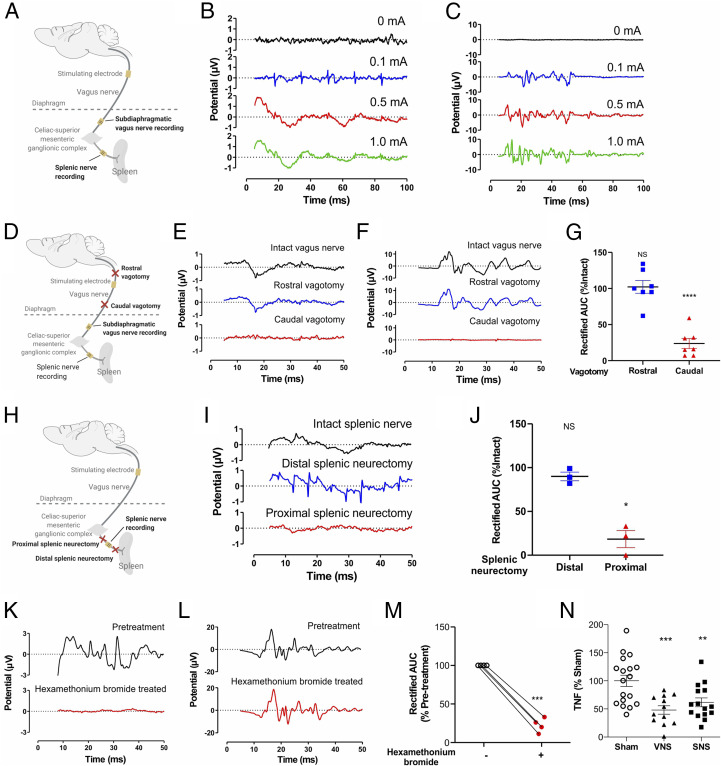
In the brain, compact clusters of neuron cell bodies, termed nuclei, are essential for maintaining parameters of host physiology within a narrow range optimal for health. Neurons residing in the brainstem dorsal motor nucleus (DMN) project in the vagus nerve to communicate with the lungs, liver, gastrointestinal tract, and other organs. Vagus nerve-mediated reflexes also control immune system responses to infection and injury by inhibiting the production of tumor necrosis factor (TNF) and other cytokines in the spleen, although the function of DMN neurons in regulating TNF release is not known. Here, optogenetics and functional mapping reveal cholinergic neurons in the DMN, which project to the celiac-superior mesenteric ganglia, significantly increase splenic nerve activity and inhibit TNF production. Efferent vagus nerve fibers terminating in the celiac-superior mesenteric ganglia form varicose-like structures surrounding individual nerve cell bodies innervating the spleen. Selective optogenetic activation of DMN cholinergic neurons or electrical activation of the cervical vagus nerve evokes action potentials in the splenic nerve. Pharmacological blockade and surgical transection of the vagus nerve inhibit vagus nerve-evoked splenic nerve responses. These results indicate that cholinergic neurons residing in the brainstem DMN control TNF production, revealing a role for brainstem coordination of immunity.

Keywords: TNF; cytokines; dorsal motor nucleus; inflammatory reflex; vagus nerve.


Conflict of interest statement

Competing interest statement: A.M.K., V.A.P., S.S.C. and K.J.T. have filed a patent application relevant to this work and have assigned their rights to the Feinstein Institutes for Medical Research. Y.A.L. is an employee of SetPoint Medical.

Figures

Fig. 1.
Fig. 1.
Selective activation of DMN cholinergic neurons inhibits TNF production during endotoxemia. (AD) Confocal images showing colocalization of ChR2-eYFP and ChAT immunoreactivity in the DMN of ChAT-ChR2-eYFP mice. (A) Anti-eYFP staining, (B) DAPI, (C) anti-ChAT staining, and (D) merged image of anti-eYFP, DAPI, and anti-ChAT staining. Note the strong expression of ChR2-eYFP in cholinergic neurons in the DMN. Data are representative of two animals per group. (Scale bar, 20 μm.) 40× magnification. (E and F) Optogenetic stimulation of cholinergic neurons in the DMN attenuated serum TNF in endotoxemic mice. ChAT-ChR2-eYFP mice were subjected to sham stimulation or optogenetic stimulation using (E) blue light (473 nm, 20 Hz, 25% duty cycle, 5 min) or (F) yellow light (593.5 nm, 20 Hz, 25% duty cycle, 5 min) in the left DMN. Animals were allowed to recover for 24 h and then injected intraperitoneally with LPS. Serum was obtained 90 min post-LPS administration and TNF was measured by ELISA. Stimulation of ChR2-expressing DMN cholinergic neurons with blue light, but not with yellow light, suppressed TNF levels during endotoxemia in ChAT-ChR2-eYFP mice. Data are represented as individual mouse data points with mean ± SEM. Unpaired t test: sham versus optogenetic stimulation (***P < 0.001, n = 19 to 20 per group). (GJ) Confocal images showing the absence of ChR2-eYFP in cholinergic neurons in littermate control mice. (G) Anti-eYFP staining, (H) DAPI, (I) anti-ChAT staining, and (J) merged image of anti-eYFP, DAPI, and anti-ChAT staining. Data are representative of two animals per group. (Scale bar, 20 μm.) 40× magnification. (K) Optogenetic stimulation in the DMN using blue light (473 nm, 20Hz, 25% duty cycle, 5 min) failed to suppress TNF production in ChR2-eYFP littermate controls. Data are represented as individual mouse data points with mean ± SEM. n = 11 to 12 per group.
Fig. 2.
Fig. 2.
The efferent vagus nerve fibers terminate in close proximity to the splenic nerve in the celiac-superior mesenteric ganglion complex. (A) Identification of the celiac-superior mesenteric ganglion complex in ChAT-eGFP transgenic mice, which allow fluorescent visualization of cholinergic structures. Using fluorescent stereomicroscopy, the celiac-superior mesenteric ganglion complex was localized on the ventral side of the descending aorta, supero-medial to the kidneys. RCG, right celiac ganglion; LCG, left celiac ganglion; SMG, superior mesenteric ganglion. Data are representative of two animals per group. (B) Only autofluorescence was seen in control C57BL/6 mice using fluorescent stereomicroscopy on the same area. (C) Schematic depiction of the viral tracing strategy, which involved infection of a Cre-dependent AAV (AAV5- ChR2-eYFP) into the DMN and a Cre-dependent HSV (HSV-ChR2-mCherry) into the spleen parenchyma of Syn-Cre mice. (DG) eYFP-expressing efferent vagus terminals and NeuN+ nerve cell bodies were visualized by immunohistochemistry in the celiac-superior mesenteric ganglia. (D) anti-eYFP staining, (E) DAPI, (F) anti-NeuN staining, (G) merged image of anti-eYFP, anti-NeuN, and DAPI staining. Note eYFP-expressing efferent vagus terminals in close proximity to NeuN-expressing nerve cell bodies. Data are representative of two animals per group. (Scale bar, 25 μm.) 40× magnification. (HL) Colocalization analysis of synaptophysin and eYFP in presynaptic efferent vagus nerve terminals in the celiac-superior mesenteric ganglion complex. (H) Anti-eYFP staining, (I) anti-synaptophysin staining, (J) merged image of anti-eYFP, and anti-synaptophysin staining. (K) Colocalization mask showing overlap regions of eYFP and synaptophysin labeling. (L) Mander’s coefficient values for overlap proportion. Presynaptic terminals labeled with anti-synaptophysin colocalized with anti-eYFP with a proportion of 0.25 ± 0.3 (Mander’s coefficient), indicating that vagus nerve fibers originating from the DMN terminate in the celiac-superior mesenteric ganglion complex. (Scale bar, 20 μm.) 63× magnification. (MO) eYFP-expressing efferent vagus terminals and mCherry-expressing splenic nerve cell bodies were visualized by immunohistochemistry in the celiac-superior mesenteric ganglion complex. (M) DAPI, (N) mCherry, (O) merged image of anti-eYFP, anti-synaptophysin, mCherry and DAPI staining. (Scale bar, 20 μm.) 63× magnification. Note a substantial proportion (41.3 ± 3.4%) of synaptophysin+ eYFP+ presynaptic vagus terminals are located in close proximity (<300 nm) to splenic neurons retrogradely labeled by HSV-mCherry.
Fig. 3.
Fig. 3.
Optogenetic stimulation of cholinergic neurons in the DMN induces evoked action potentials in the splenic nerve. (A and B) Splenic nerve activity in response to blue light stimulation (light on) of the DMN cholinergic neurons (473 nm, 25% duty cycle, 8 to 12 mW total power, 2 to 3 min duration). Blue boxes indicate periods of light stimulation. Representative recordings shown for (A) non-ChR2 littermate control (B) ChAT-ChR2-eYFP mice. Data are representative of 7 to 10 animals per group. (C and D) Optogenetic stimulation of DMN cholinergic neurons produced a significant increase in splenic nerve activity in ChAT-ChR2-eYFP mice. Firing frequency was recorded in the splenic nerve over a 2-min stimulation period in (C) non-ChR2 littermate control, (n = 7), (D) ChAT-ChR2-eYFP mice (n = 10). Data are represented as individual mouse data points with mean ± SEM. Two-tailed t test: baseline versus optogenetic stimulation (**P < 0.01). (E and F) Optogenetic stimulation of DMN cholinergic neurons following bupivacaine administration to the left cervical vagus nerve failed to induce evoked potentials in the splenic nerve. (E) Splenic nerve activity was recorded during optogenetic stimulation (473 nm, 25% duty cycle, 8 to 12 mW total power, 2 min duration) of the DMN pre- and postbupivacaine administration. Blue boxes indicate periods of light stimulation. Representative neural recording shown. Data are representative of five animals. (F) Total spike count measured in splenic nerve following optogenetic stimulation of the DMN. Data are represented as individual mouse data points with mean ± SEM. Two-tailed t test: sham versus DMN stimulation (***P < 0.001, n = 11), vehicle versus bupivacaine administration (**P < 0.01, n = 5). No significant difference in the baseline splenic nerve activity was observed after the addition of bupivacaine to the left cervical vagus nerve.
Fig. 4.
Fig. 4.
Efferent cholinergic signals transmitted in the vagus nerve induce evoked action potentials in the splenic nerve. (A–C) Evoked splenic nerve compound action potentials increase in response to increasing intensities of electrical cervical vagus nerve stimulation. (A) Schematic depiction of the recording strategy. (B–C) Stimulation (0.25 ms biphasic pulses of 0, 0.1, 0.5, 1 mA) was delivered to the cervical vagus nerve, and evoked compound action potentials were recorded on the splenic nerve and subdiaphragmatic vagus nerve. Representative traces of (B) splenic nerve, (C) subdiaphragmatic vagus nerve. Data is representative of 3 animals per group. (D–G) Efferent signals transmitted in the cervical vagus nerve induce evoked action potentials in the splenic nerve. (D) Schematic depiction of the vagotomy and recording strategy. After caudal or rostral vagotomy (with respect to stimulating electrode), vagus nerve stimulation-induced evoked potentials were recorded. Representative traces of (E) splenic nerve, (F) subdiaphragmatic vagus nerve. Data is representative of 7 animals per group. (G) Caudal but not rostral vagotomy abrogates evoked action potentials in the splenic nerve. Data is represented as individual rat data point with mean ± SEM. One-way paired mixed-effects model followed by Tukey’s multiple comparisons test between groups: intact versus caudal vagotomy (P < 0.0001, n = 7), rostral versus caudal vagotomy (P = 0.0008, n = 7). (H–J) Splenic nerve activity in response to vagus nerve stimulation recorded after splenic neurectomy (proximal or distal to the splenic nerve recording electrode), (H) Schematic depiction of the splenic neurectomy and recording strategy. After proximal or distal splenic neurectomy (with respect to recording electrode) vagus nerve stimulation-induced evoked potentials were recorded, (I) Representative traces of compound action potentials in the splenic nerve. Data is representative of 3 animals per group, (J) Splenic neurectomy that was proximal but not distal to the splenic nerve recording electrode abrogates evoked action potentials in the splenic nerve. Data is represented as individual rat data point with mean ± SEM. Paired mixed-effects model followed by Tukey’s multiple comparisons test between groups: intact versus proximal splenic neurectomy (P = 0.02, n = 3). (K–M) Blocking of cholinergic signaling with hexamethonium bromide (10 mg/kg) abrogates cervical vagus nerve-originating evoked potentials in the splenic nerve. Vagus nerve stimulation-induced evoked potentials were recorded in the (K) splenic nerve and (L) sub-diaphragmatic vagus nerve before injection and at 20 min post-injection. Representative examples of evoked potentials (n = 4 per group). (M) Area under the curve (AUC) of the splenic nerve activity. Data is represented as individual rat data point with mean ± SEM. Paired t-test between two groups: Pre-treatment versus post-treatment with hexamethonium bromide (P = 0.0005, n = 4). (N) Splenic nerve stimulation attenuates LPS-induced serum TNF response. Data is represented as individual rat data point with mean ± SEM. One-way ANOVA followed by Dunnett’s multiple comparisons test between groups: sham versus VNS (P < 0.001), sham versus SNS (P < 0.01).

References

    1. Laughton W. B., Powley T. L., Localization of efferent function in the dorsal motor nucleus of the vagus. Am. J. Physiol. 252, R13–R25 (1987). - PubMed
    1. Travagli R. A., Hermann G. E., Browning K. N., Rogers R. C., Brainstem circuits regulating gastric function. Annu. Rev. Physiol. 68, 279–305 (2006). - PMC - PubMed
    1. Ionescu E., Rohner-Jeanrenaud F., Berthoud H. R., Jeanrenaud B., Increases in plasma insulin levels in response to electrical stimulation of the dorsal motor nucleus of the vagus nerve. Endocrinology 112, 904–910 (1983). - PubMed
    1. Geis G. S., Wurster R. D., Cardiac responses during stimulation of the dorsal motor nucleus and nucleus ambiguus in the cat. Circ. Res. 46, 606–611 (1980). - PubMed
    1. Montgomery J. P., Patterson P. H., Behavioral stress and tumor progression. Anticancer Res. 26, 1189–1192 (2006). - PubMed

Publication types

MeSH terms

LinkOut - more resources