. 2020 Dec 1;117(48):30547-30553.
doi: 10.1073/pnas.2013182117. Epub 2020 Nov 9.

The impact of COVID-19 nonpharmaceutical interventions on the future dynamics of endemic infections

Affiliations

The impact of COVID-19 nonpharmaceutical interventions on the future dynamics of endemic infections

Rachel E Baker et al. Proc Natl Acad Sci U S A. .

Abstract

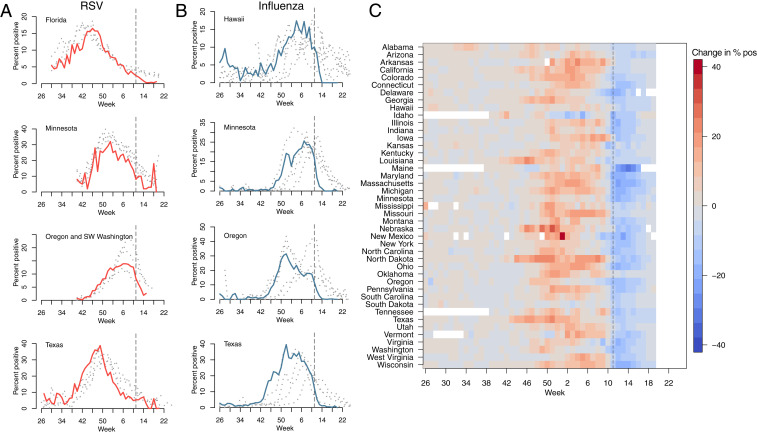
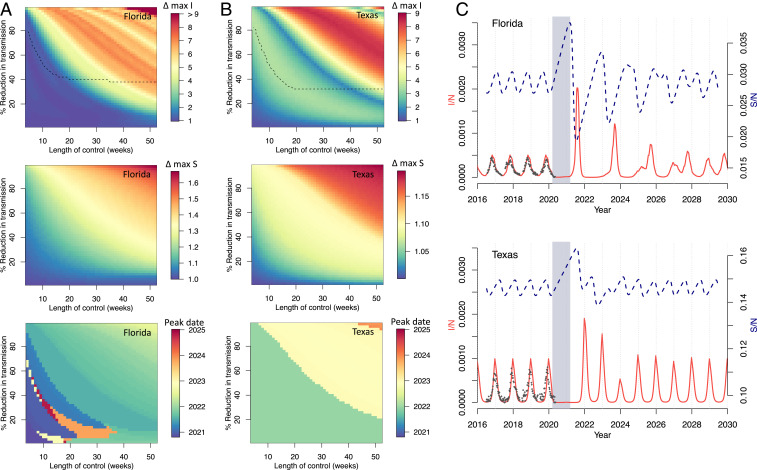
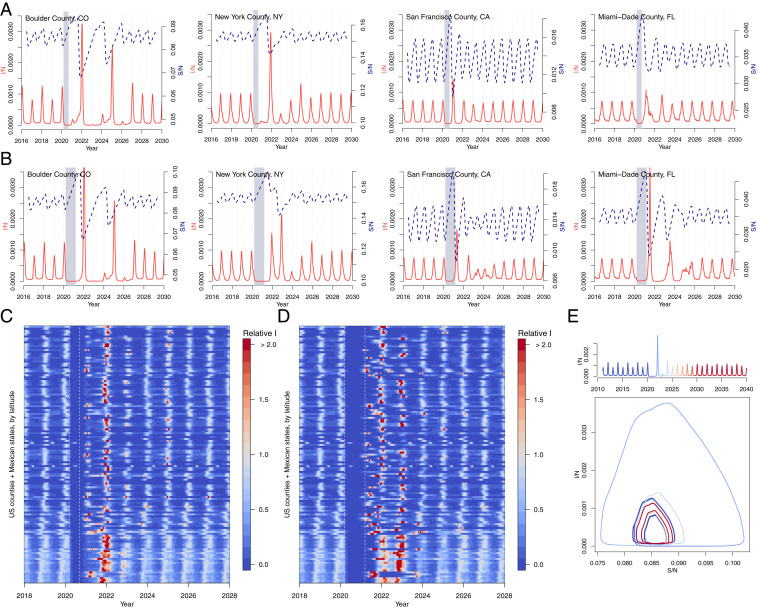
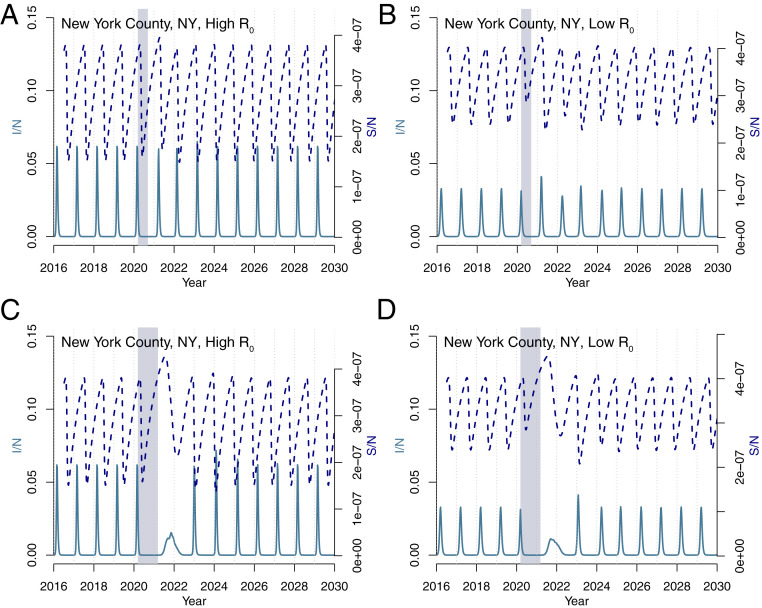
Nonpharmaceutical interventions (NPIs) have been employed to reduce the transmission of severe acute respiratory syndrome coronavirus 2 (SARS-CoV-2), yet these measures are already having similar effects on other directly transmitted, endemic diseases. Disruptions to the seasonal transmission patterns of these diseases may have consequences for the timing and severity of future outbreaks. Here we consider the implications of SARS-CoV-2 NPIs for two endemic infections circulating in the United States of America: respiratory syncytial virus (RSV) and seasonal influenza. Using laboratory surveillance data from 2020, we estimate that RSV transmission declined by at least 20% in the United States at the start of the NPI period. We simulate future trajectories of both RSV and influenza, using an epidemic model. As susceptibility increases over the NPI period, we find that substantial outbreaks of RSV may occur in future years, with peak outbreaks likely occurring in the winter of 2021-2022. Longer NPIs, in general, lead to larger future outbreaks although they may display complex interactions with baseline seasonality. Results for influenza broadly echo this picture, but are more uncertain; future outbreaks are likely dependent on the transmissibility and evolutionary dynamics of circulating strains.

Keywords: COVID-19; RSV; influenza; nonpharmaceutical interventions.


Conflict of interest statement

The authors declare no competing interest.

Figures

Fig. 1.
Fig. 1.
Reduction in RSV and Influenza cases since March 2020. The percent positive laboratory tests for (A) RSV and (B) influenza across four US states. Data from 2020 are highlighted in red (RSV) and light blue (influenza). Data from previous seasons (2016–2019) are highlighted in gray. (C) The 2020 change relative to seasonal mean for influenza for all available US states (RSV surveillance data are only available for select states). Dashed line shows timing of the declaration of national emergency.
Fig. 2.
Fig. 2.
RSV simulations for Florida and Texas. (A and B) Surface plots show the change in peak incidence per capita and peak susceptibility per capita, relative to pre-2020 maxima, for varied lengths of control (weeks) and percent reduction in transmission. Black dashed line in the first plot row shows the region above which minimum incidence drops below 1, that is, where local extinction is possible. The lower surface plot shows the timing of peak incidence in this period. Results for (A) Florida and (B) Texas are shown. (C) Simulations of future RSV epidemics, assuming a control period of 1 y and a 20% reduction in transmission, are shown for Florida and Texas. Gray block represents the NPI period, red line is proportion infected (I/N), and blue dashed line is proportion susceptible (S/N).
Fig. 3.
Fig. 3.
RSV simulations for US counties and Mexican states. Simulations for four US counties with either (A) 6 mo or (B) 1 y of controls. Simulations for all US counties (with population > 500,000) and Mexican states in data with (C) 6-mo or (D) 1-y control period, where max incidence prior to the control period is set to 1. (E) Susceptible–Infected phase plane plot for Boulder, CO, showing epidemic trajectory with incidence time series above. The epidemic settles on a coexisting attractor postcontrol shown by the distinct precontrol (dark blue) and postcontrol (dark red) stable trajectories.
Fig. 4.
Fig. 4.
Influenza simulations for New York County. Simulations using a (A and B) 6-mo and (C and D) 1-y control period for both (A and C) high (R0max=3) and (B and D) low (R0max=2.2) transmission rates.

References

    1. Pei S., Kandula S., Shaman J., Differential effects of intervention timing on COVID-19 spread in the United States. medRxiv:10.1101/2020.05.15.20103655 (29 May 2020). - PMC - PubMed
    1. Tian H., et al. , An investigation of transmission control measures during the first 50 days of the COVID-19 epidemic in China. Science 368, 638–642 (2020). - PMC - PubMed
    1. Lai S., et al. , Effect of non-pharmaceutical interventions to contain COVID-19 in China. Nature 585, 410–413 (2020). - PMC - PubMed
    1. Chinazzi M., et al. , The effect of travel restrictions on the spread of the 2019 novel coronavirus (COVID-19) outbreak. Science 368, 395–400 (2020). - PMC - PubMed
    1. Hsiang S., et al. , The effect of large-scale anti-contagion policies on the COVID-19 pandemic. Nature 584, 262–267. - PubMed

Publication types