. 2020 Dec 1;117(48):30661-30669.
doi: 10.1073/pnas.2010943117. Epub 2020 Nov 9.

Label-free adaptive optics imaging of human retinal macrophage distribution and dynamics

Affiliations

Label-free adaptive optics imaging of human retinal macrophage distribution and dynamics

Daniel X Hammer et al. Proc Natl Acad Sci U S A. .

Abstract

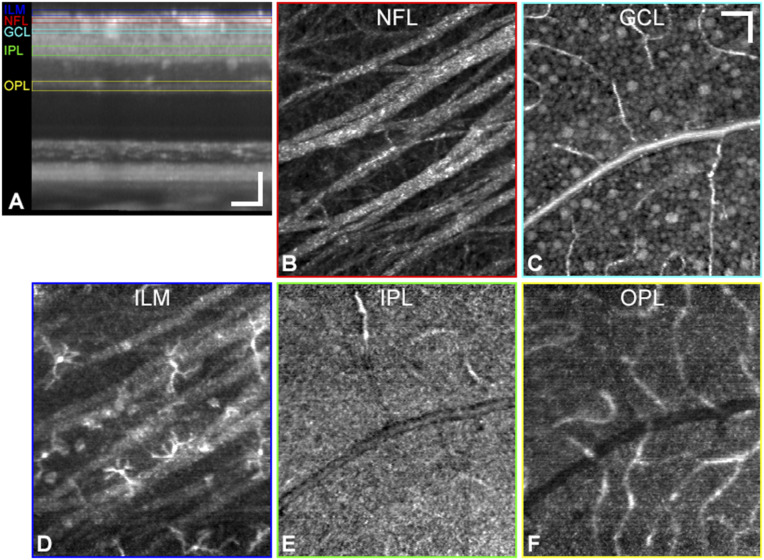
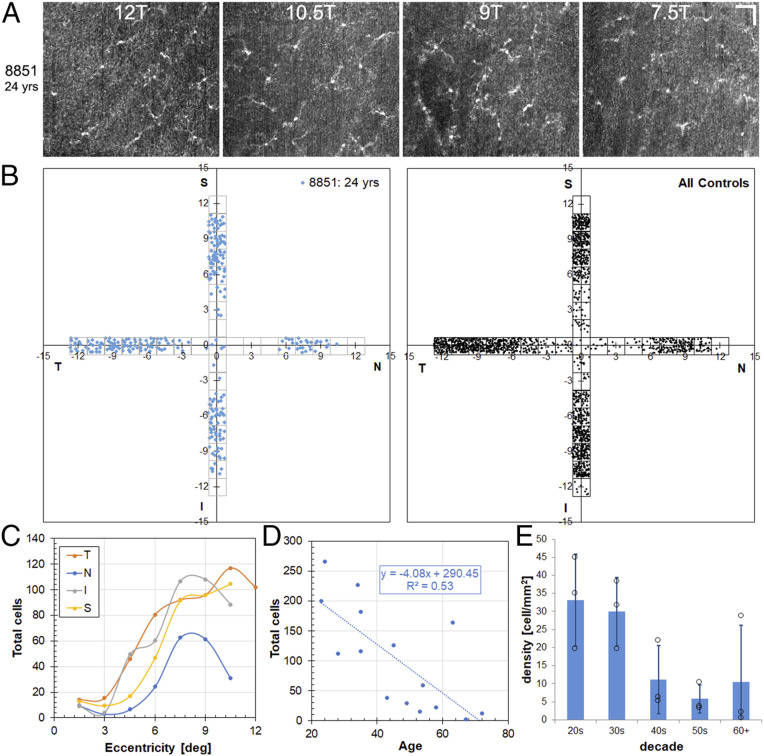
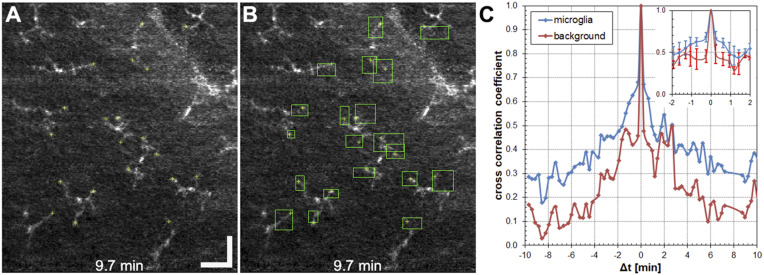
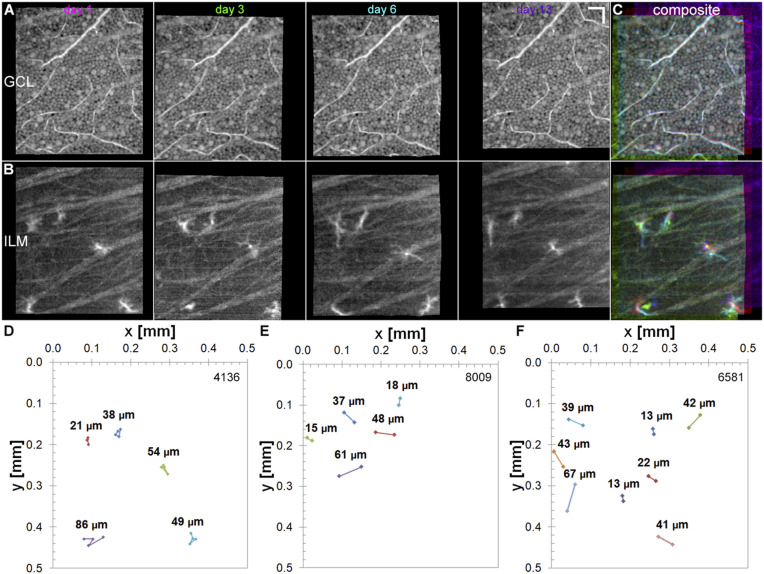
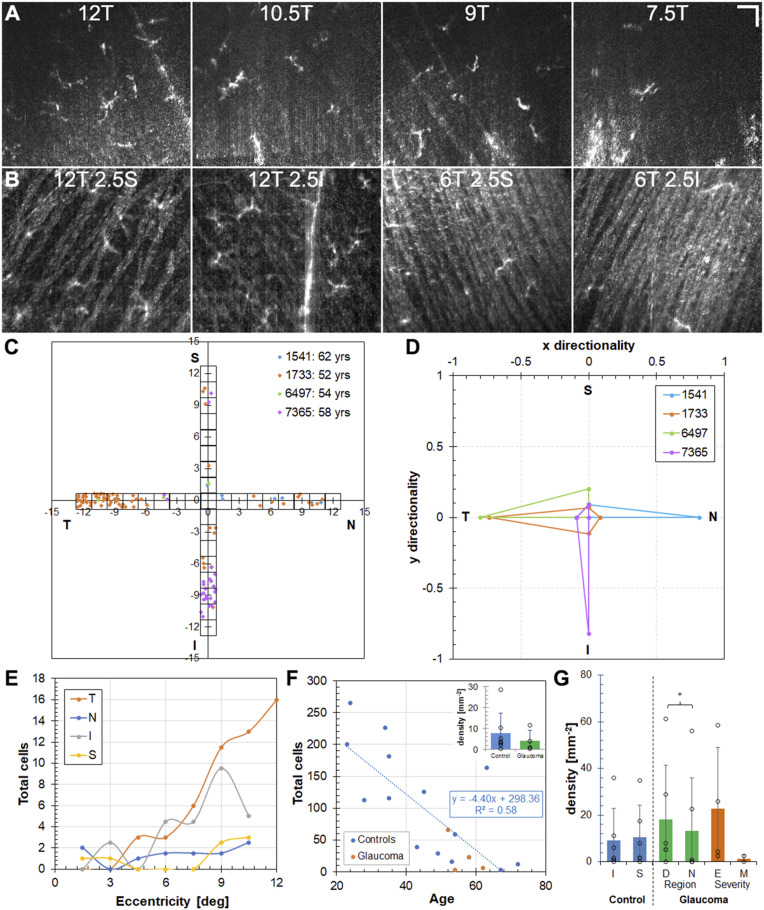
Microglia are resident central nervous system macrophages and the first responders to neural injury. Until recently, microglia have been studied only in animal models with exogenous or transgenic labeling. While these studies provided a wealth of information on the delicate balance between neuroprotection and neurotoxicity within which these cells operate, extrapolation to human immune function has remained an open question. Here we examine key characteristics of retinal macrophage cells in live human eyes, both healthy and diseased, with the unique capabilities of our adaptive optics-optical coherence tomography approach and owing to their propitious location above the inner limiting membrane (ILM), allowing direct visualization of cells. Our findings indicate that human ILM macrophage cells may be distributed distinctly, age differently, and have different dynamic characteristics than microglia in other animals. For example, we observed a macular pattern that was sparse centrally and peaked peripherally in healthy human eyes. Moreover, human ILM macrophage density decreased with age (∼2% of cells per year). Our results in glaucomatous eyes also indicate that ILM macrophage cells appear to play an early and regionally specific role of nerve fiber layer phagocytosis in areas of active disease. While we investigate ILM macrophage cells distinct from the larger sample of overall retinal microglia, the ability to visualize macrophage cells without fluorescent labeling in the live human eye represents an important advance for both ophthalmology and neuroscience, which may lead to novel disease biomarkers and new avenues of exploration in disease progression.

Keywords: adaptive optics; glaucoma; macrophage; microglia; optical coherence tomography.


Conflict of interest statement

The authors declare no competing interest.

Figures

Fig. 1.
Fig. 1.
Macrophage cells are resolved above the ILM but not in the IPL and OPL. (A) Cross-sectional view of an averaged AO-OCT volume (n = 395 volumes) from a 35-y-old healthy control subject and en face projections (axial thickness) of the following inner retinal layers: NFL (8 µm) (B), GCL (7 µm) (C), ILM (10 µm) (D), IPL (15 µm) (E), and OPL (15 µm) (F). Layers are color-coded in corresponding cross-sectional regions of interest. The bottom row shows known retinal macrophage locations. (Scale bars: 50 µm.)
Fig. 2.
Fig. 2.
ILM macrophage cells are sparse in the central macula, and density decreases with age in healthy control subjects. (A) Example en face AO-OCT axial projections near the temporal peak in a 24-y-old healthy control subject. (Scale bar: 50 µm.) (B) ILM macular macrophage distribution maps (horizontal and vertical meridians) for the same subject and for all healthy control subjects. (C and D) Total ILM macrophage counts in the regions surveyed as a function of eccentricity for the four quadrants (C) and as a function of age (D) for the individual control subjects. (E) ILM macrophage density as a function of age (by decade). P = 0.037, ANOVA.
Fig. 3.
Fig. 3.
Quantification of ILM macrophage process fast dynamics. (A and B) Example en face AO-OCT images of ILM macrophage cells in a 33-y-old subject showing manually marked process endpoint locations (A) and coverage area calculated from the endpoint motion over 20 min (B). (Scale bar: 50 µm.) (C) Average cross-correlation coefficient calculated on a 20-min time-lapse video for 12 ILM macrophage cells and three background locations for a healthy control subject. (Inset) Coefficients for Δt <±2.0 min. Error bars indicate standard deviation (SD).
Fig. 4.
Fig. 4.
Slow ILM macrophage migration occurs from days to months. ILM macrophage migration was tracked for days to months in three healthy subjects by registering volumes to the GCL. In a 49-y-old subject, ILM macrophage cells were tracked at multiple timepoints over 2 wk. (A–C) Registered GCL (A) and ILM layers (B) and composite false color images (C) created from magenta (day 1), green (day 3), cyan (day 6), and purple (day 13). (Scale bar: 50 µm.) (D) Mean total pathlength (TPL) of macrophage soma migration (TPL: 49 ± 24 µm; range: 21 to 86 µm; n = 5 cells; 13 d). The mean pathlength (PL) using only start and end days was lower (PL: 20 ± 17 µm; range: 7 to 50 µm). (E) Macrophage migration in a 33-y-old healthy subject (PL: 36 ± 20 µm; range: 15 to 61 µm; n = 5 cells; 44 d). (F) Macrophage migration in a 35-y-old healthy subject (PL: 35 ± 17 µm; range: 13 to 67 µm; n = 8 cells; 112 d).
Fig. 5.
Fig. 5.
Macular ILM macrophage distribution in glaucomatous eyes is similar to that in controls but with regional differences. (A and B) Example AO-OCT images near the temporal distribution peak (A) and around the horizontal meridian (B) at 12T and 6T in a 52-y-old glaucoma subject. (Scale bar: 50 µm.) (C and D) ILM macrophage distribution maps (C) and symmetry plots (D) for four glaucoma subjects. (E and F) Total ILM macrophage counts in the regions surveyed as a function of eccentricity for the four quadrants (glaucoma subjects) (E) and age (all subjects) (F). (Inset) Average density across all distribution regions for four glaucoma subjects compared with seven age-matched control subjects. P = 0.27, Student’s t test. (G) Comparison of ILM macrophage density for 3°/6°/12° regions in six age-matched control and six glaucoma subjects. P = 0.25 for S-I, P < 0.01 for D-N, P = 0.23 for E-M, Student’s t test. S, superior; I, inferior; D, defect region; N, more normal region; E, early; M, moderate.

References

    1. Sierra A., Paolicelli R. C., Kettenmann H., Cien Años de Microglía: Milestones in a century of microglial research. Research Trends Neurosci. 42, 778–792 (2019). - PubMed
    1. Nimmerjahn A., Kirchhoff F., Helmchen F., Resting microglial cells are highly dynamic surveillants of brain parenchyma in vivo. Science 308, 1314–1318 (2005). - PubMed
    1. Wang J. W., Chen S. D., Zhang X. L., Jonas J. B., Retinal microglia in glaucoma. J. Glaucoma 25, 459–465 (2016). - PubMed
    1. Ginhoux F., Guilliams M., Tissue-resident macrophage ontogeny and homeostasis. Immunity 44, 439–449 (2016). - PubMed
    1. Distler C., Dreher Z., Glia cells of the monkey retina—II: Müller cells. Vision Res. 36, 2381–2394 (1996). - PubMed

Publication types

LinkOut - more resources