. 2020 Nov 9;6(1):37.
doi: 10.1038/s41540-020-00154-6.

Uncovering cancer gene regulation by accurate regulatory network inference from uninformative data

Affiliations

Uncovering cancer gene regulation by accurate regulatory network inference from uninformative data

Deniz Seçilmiş et al. NPJ Syst Biol Appl. .

Abstract

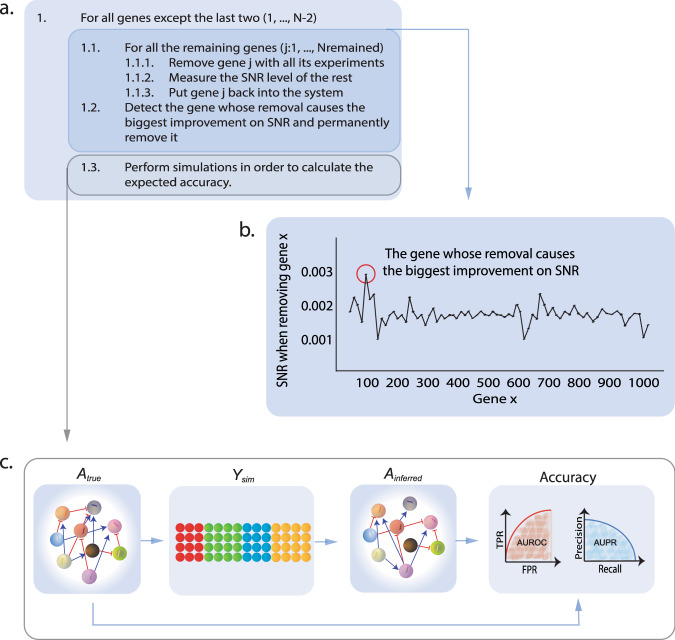
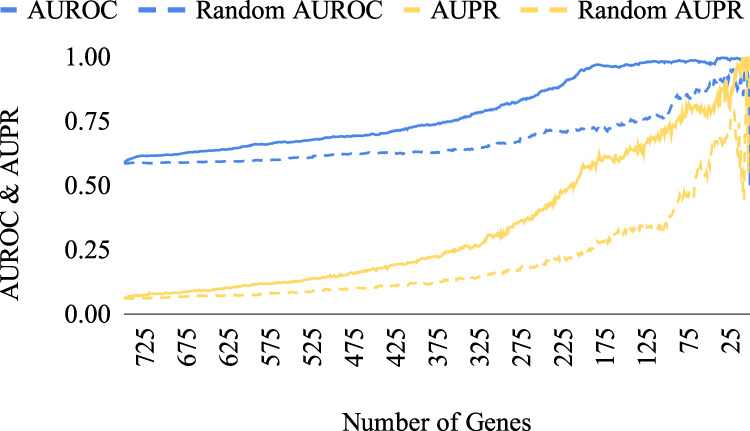
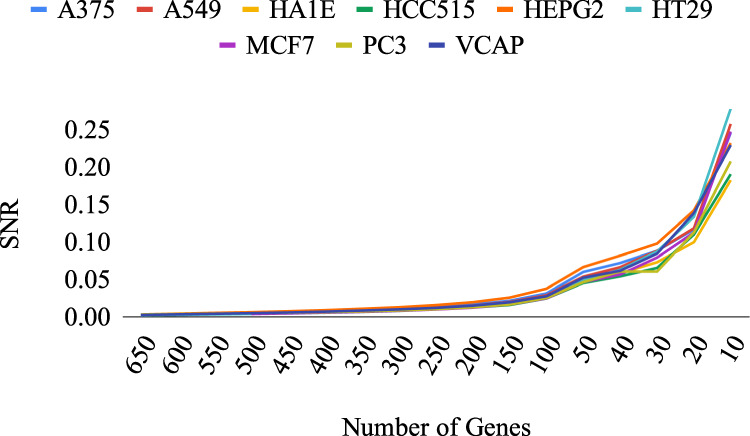
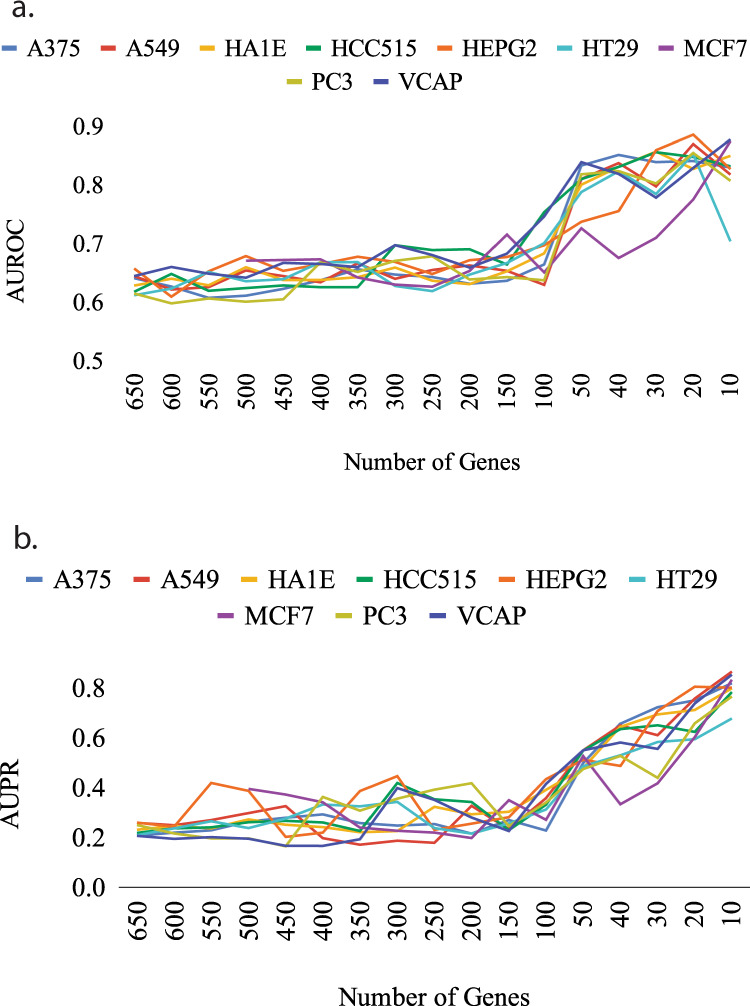
The interactions among the components of a living cell that constitute the gene regulatory network (GRN) can be inferred from perturbation-based gene expression data. Such networks are useful for providing mechanistic insights of a biological system. In order to explore the feasibility and quality of GRN inference at a large scale, we used the L1000 data where ~1000 genes have been perturbed and their expression levels have been quantified in 9 cancer cell lines. We found that these datasets have a very low signal-to-noise ratio (SNR) level causing them to be too uninformative to infer accurate GRNs. We developed a gene reduction pipeline in which we eliminate uninformative genes from the system using a selection criterion based on SNR, until reaching an informative subset. The results show that our pipeline can identify an informative subset in an overall uninformative dataset, allowing inference of accurate subset GRNs. The accurate GRNs were functionally characterized and potential novel cancer-related regulatory interactions were identified.


Conflict of interest statement

The authors declare no competing interests.

Figures

Fig. 1
Fig. 1. Workflow of the subset-selection algorithm.
a The subset-selection algorithm, where each gene is removed together with its knockdown experiments, and SNR of the remaining dataset is measured. The gene is then put back and the procedure is repeated for all genes in the dataset. b The inner part of the algorithm showing the changes in SNR after each removal and the detection of the gene whose removal increases SNR the most and therefore will be permanently removed. c The simulation step applied for the calculation of the expected accuracy of the GRN inference, where Atrue refers to the true GRN that can either be fully synthetic or estimated from the real data, Ysim denotes the generated expression matrix from Atrue, Ainferred is the inferred GRN, while the accuracy was evaluated in terms of the area under the ROC and precision-recall curves.
Fig. 2
Fig. 2. Performance of the subset-selection algorithm on the 750-gene GeneSPIDER synthetic dataset.
The performance in terms of AUROC and AUPR of the subset-selection algorithm is shown, compared to the performance of random gene removal. The x-axis represents the remaining subset size.
Fig. 3
Fig. 3. Performance of the gene reduction algorithm on the 200-gene GeneNetWeaver synthetic dataset.
The performance in terms of AUROC and AUPR of the subset-selection algorithm is shown, compared to the performance of random gene removal. The x-axis represents the remaining subset size.
Fig. 4
Fig. 4. The SNR level of SNR-enriched subsets of the nine selected L1000 cell lines.
The x-axis represents the subset size, the y-axis denotes the SNR, and each curve represents a cell line.
Fig. 5
Fig. 5. Evaluation of methods for benchmarking GRN inference accuracy with simulation.
The evaluation was made for the subsets of the A375 cell line in terms of AUROC (a) and AUPR (b). The legend shows the algorithm used to generate the true GRN for benchmarking, and the algorithm used to infer the GRNs from the simulated data as the first and second labels. For example, ‘LSCO & LASSO’ denotes that the true GRN was generated with LSCO and the GRNs were inferred with LASSO.
Fig. 6
Fig. 6. Expected accuracy of subset GRNs.
The accuracy was derived from simulations using LSCO and measured as AUROC (a) and AUPR (b) on the nine L1000 cell lines. The x-axis represents the subset size, the y-axis the AUROC and AUPR values, and each curve represents a cell line.
Fig. 7
Fig. 7. The accurate GRN of the HT29 colon cancer cell line.
The nodes demonstrate the informative genes of this L1000 cell line, and blue and red edges represent the regulatory interactions which are either activation or suppression, respectively.
Fig. 8
Fig. 8. Protein class enrichment of each cell line and their 50-gene subsets.
The x-axis shows the cell line, and the y-axis shows the class enrichment relative to UniProt fractions as log(ratio).
Fig. 9
Fig. 9. Knockdown effect on target.
Significant and nonsignificant up- and downregulation of the shRNA target genes in the studied L1000 cell lines.

References

    1. Friedman J, Hastie T, Tibshirani R. Regularization paths for generalized linear models via coordinate descent. J. Stat. Softw. 2010;33:1–22. doi: 10.18637/jss.v033.i01. - DOI - PMC - PubMed
    1. Tibshirani R. Regression shrinkage and selection via the lasso. J. R. Stat. Soc. Ser. B Stat. Methodol. 1996;58:267–288.
    1. Nordling, T. E. M. Robust inference of gene regulatory networks, PhD thesis, KTH School of Electrical Engineering, Automatic Control Lab (2013).
    1. Faith JJ, et al. Large-scale mapping and validation of Escherichia coli transcriptional regulation from a compendium of expression profiles. PLoS Biol. 2007;5:e8. doi: 10.1371/journal.pbio.0050008. - DOI - PMC - PubMed
    1. Huynh-Thu, V. A., Irrthum, A., Wehenkel, L. & Geurts, P. Inferring regulatory networks from expression data using tree-based methods. PLoS ONE.5 (9), e12776 (2010). - PMC - PubMed

Publication types