

Carbon Monitor, a near-real-time daily dataset of global CO2 emission from fossil fuel and cement production
- PMID: 33168822
- PMCID: PMC7653960
- DOI: 10.1038/s41597-020-00708-7
Carbon Monitor, a near-real-time daily dataset of global CO2 emission from fossil fuel and cement production
Abstract
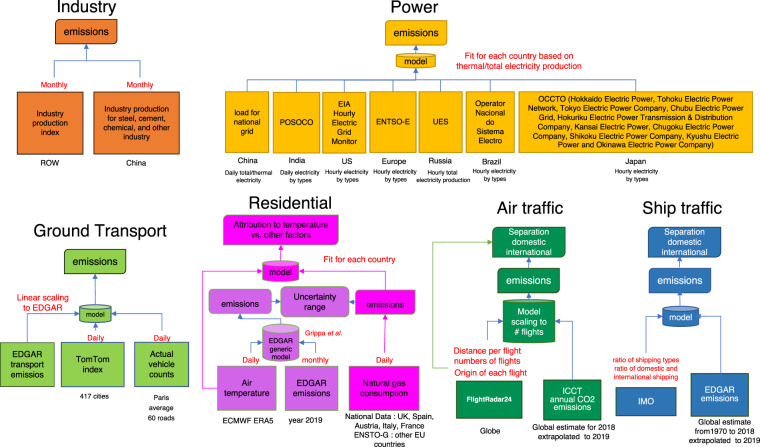
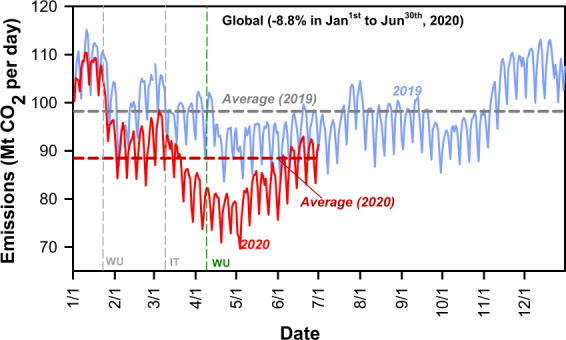
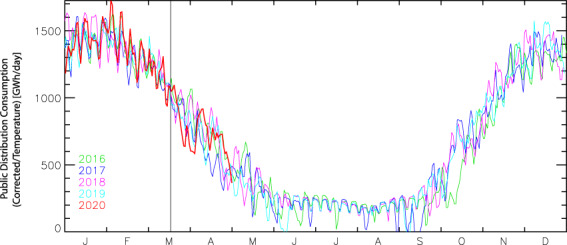
We constructed a near-real-time daily CO2 emission dataset, the Carbon Monitor, to monitor the variations in CO2 emissions from fossil fuel combustion and cement production since January 1, 2019, at the national level, with near-global coverage on a daily basis and the potential to be frequently updated. Daily CO2 emissions are estimated from a diverse range of activity data, including the hourly to daily electrical power generation data of 31 countries, monthly production data and production indices of industry processes of 62 countries/regions, and daily mobility data and mobility indices for the ground transportation of 416 cities worldwide. Individual flight location data and monthly data were utilized for aviation and maritime transportation sector estimates. In addition, monthly fuel consumption data corrected for the daily air temperature of 206 countries were used to estimate the emissions from commercial and residential buildings. This Carbon Monitor dataset manifests the dynamic nature of CO2 emissions through daily, weekly and seasonal variations as influenced by workdays and holidays, as well as by the unfolding impacts of the COVID-19 pandemic. The Carbon Monitor near-real-time CO2 emission dataset shows a 8.8% decline in CO2 emissions globally from January 1st to June 30th in 2020 when compared with the same period in 2019 and detects a regrowth of CO2 emissions by late April, which is mainly attributed to the recovery of economic activities in China and a partial easing of lockdowns in other countries. This daily updated CO2 emission dataset could offer a range of opportunities for related scientific research and policy making.
Conflict of interest statement
The authors declare no competing interests.
Figures
Dataset use reported in
References
-
- Janssens-Maenhout G, et al. EDGAR v4.3.2 Global Atlas of the three major Greenhouse Gas Emissions for the period 1970–2012. Earth Syst. Sci. Data. 2019;11:959–1002. doi: 10.5194/essd-11-959-2019. - DOI
-
- Marland G, Rotty RM. Carbon dioxide emissions from fossil fuels: a procedure for estimation and results for 1950–1982. Tellus Ser. B-Chem. Phys. Meteorol. 1984;36:232–261. doi: 10.3402/tellusb.v36i4.14907. - DOI
-
- Intergovernmental Panel on Climate Change (IPCC). Revised 1996 IPCC Guidelines for National Greenhouse Gas Inventories. (Intergovernmental Panel on Climate Change, 1997).
-
- Eggleston, S., Buendia, L., Miwa, K., Ngara, T. & Tanabe, K. 2006 IPCC guidelines for national greenhouse gas inventories. Vol. 5 (Institute for Global Environmental Strategies Hayama, Japan, 2006).
-
- Gregg JS, Andres RJ, Marland G. China: Emissions pattern of the world leader in CO2 emissions from fossil fuel consumption and cement production. Geophys. Res. Lett. 2008;35:GL032887. doi: 10.1029/2007GL032887. - DOI
Publication types
MeSH terms
Substances
Grants and funding
LinkOut - more resources
Full Text Sources
Miscellaneous
