. 2020 Nov 9;11(1):5661.
doi: 10.1038/s41467-020-19501-6.

FABP3-mediated membrane lipid saturation alters fluidity and induces ER stress in skeletal muscle with aging

Affiliations

FABP3-mediated membrane lipid saturation alters fluidity and induces ER stress in skeletal muscle with aging

Seung-Min Lee et al. Nat Commun. .

Abstract

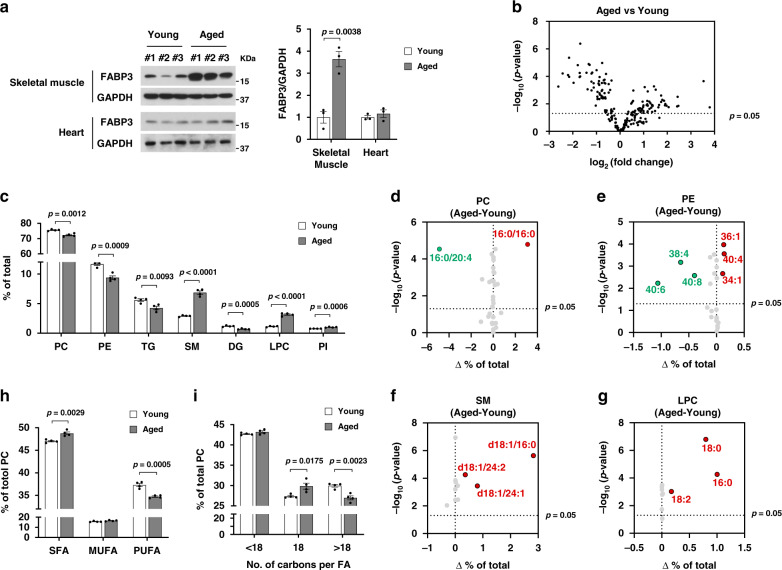
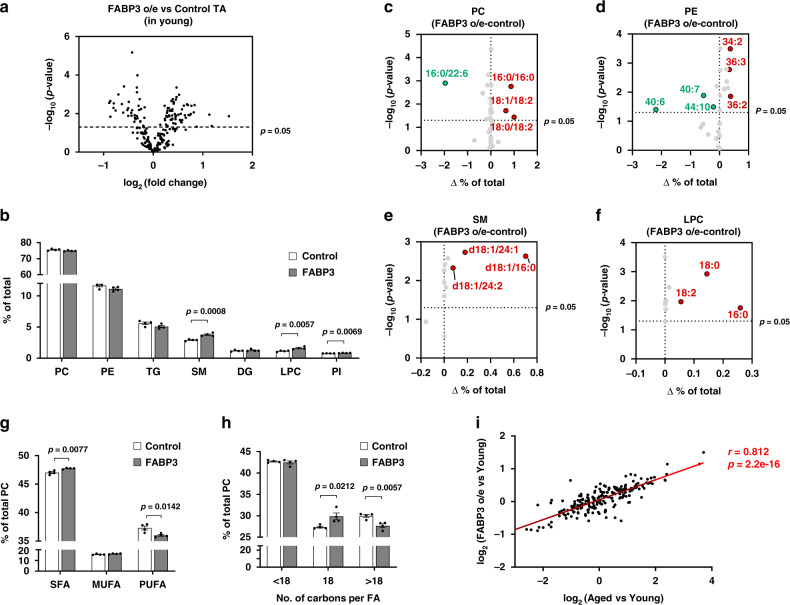
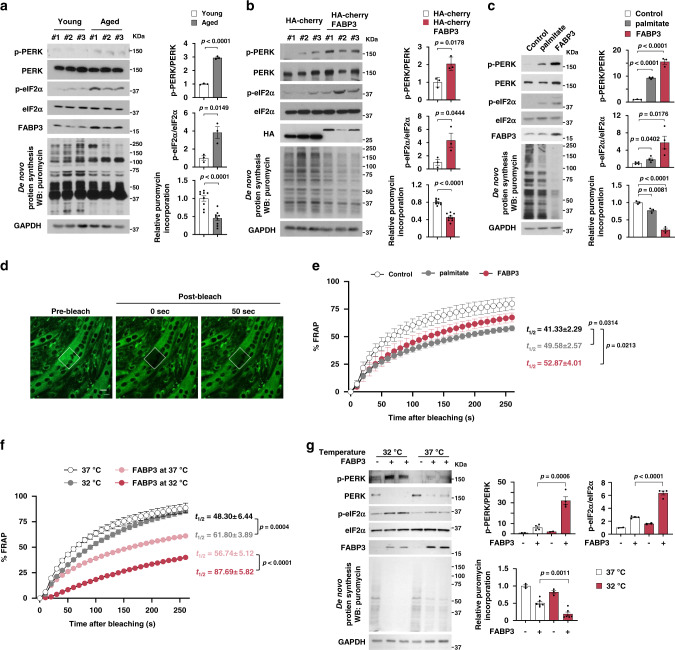
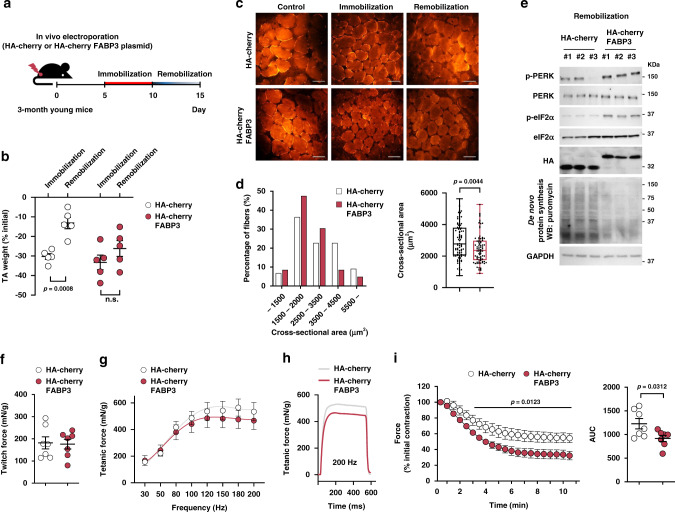
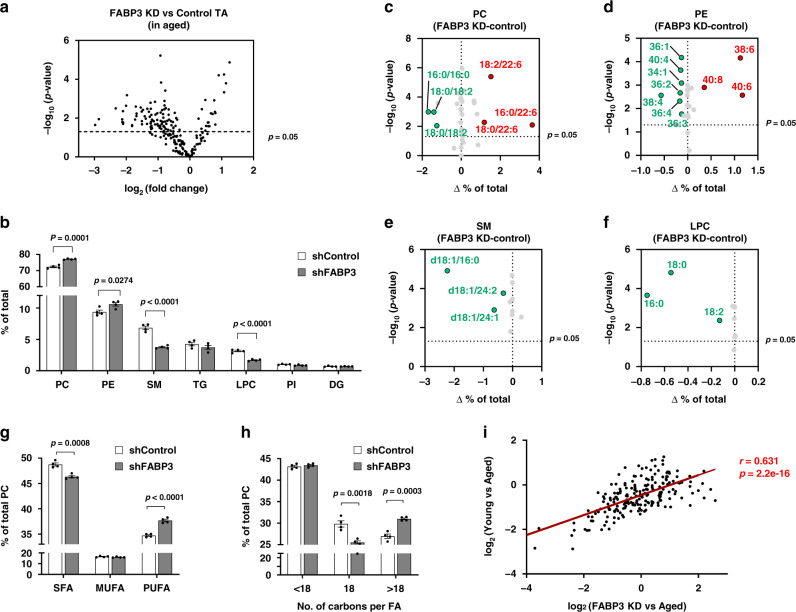
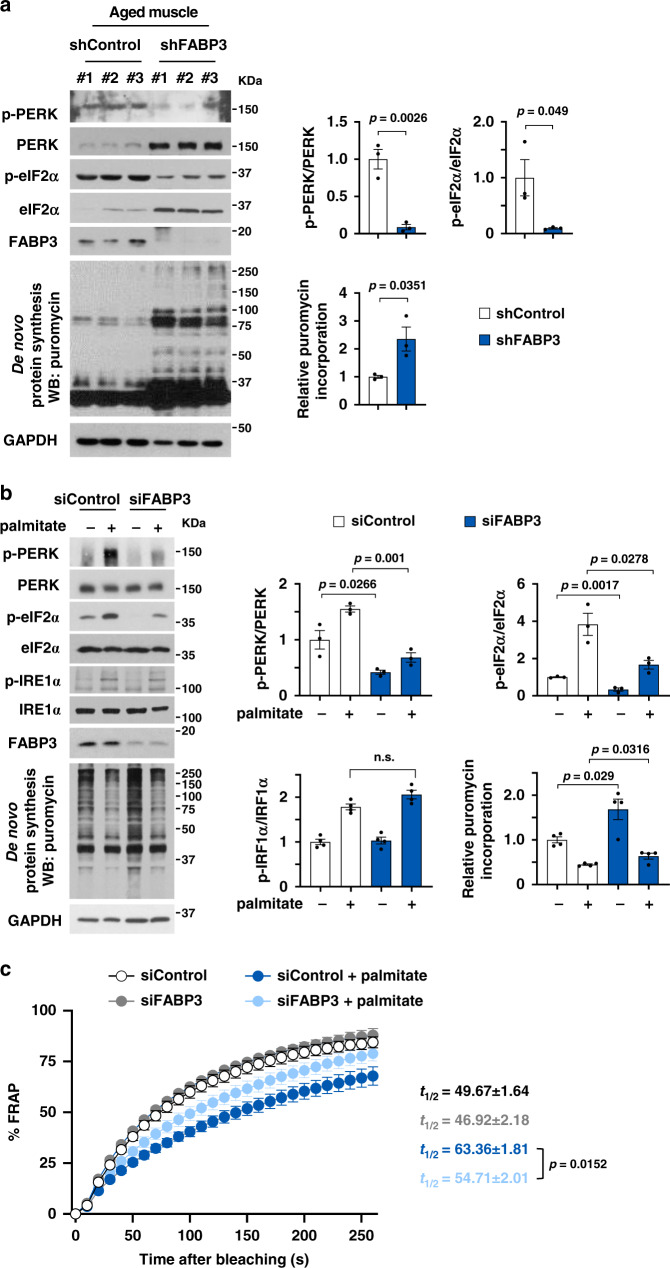
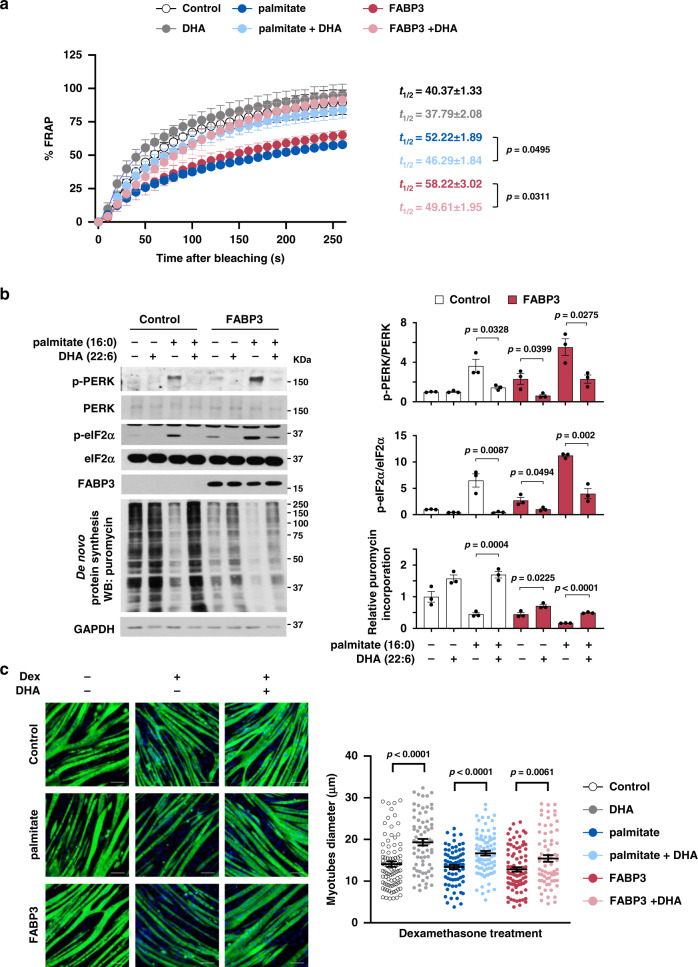
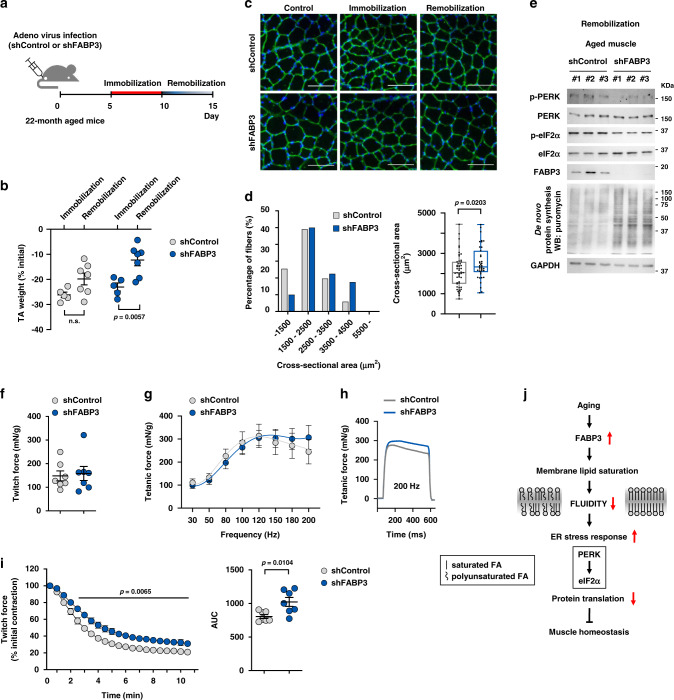
Sarcopenia is characterized by decreased skeletal muscle mass and function with age. Aged muscles have altered lipid compositions; however, the role and regulation of lipids are unknown. Here we report that FABP3 is upregulated in aged skeletal muscles, disrupting homeostasis via lipid remodeling. Lipidomic analyses reveal that FABP3 overexpression in young muscles alters the membrane lipid composition to that of aged muscle by decreasing polyunsaturated phospholipid acyl chains, while increasing sphingomyelin and lysophosphatidylcholine. FABP3-dependent membrane lipid remodeling causes ER stress via the PERK-eIF2α pathway and inhibits protein synthesis, limiting muscle recovery after immobilization. FABP3 knockdown induces a young-like lipid composition in aged muscles, reduces ER stress, and improves protein synthesis and muscle recovery. Further, FABP3 reduces membrane fluidity and knockdown increases fluidity in vitro, potentially causing ER stress. Therefore, FABP3 drives membrane lipid composition-mediated ER stress to regulate muscle homeostasis during aging and is a valuable target for sarcopenia.


Conflict of interest statement

The authors declare no competing interests.

Figures

Fig. 1
Fig. 1. Lipidomic signature of aged muscle.
a Immunoblots (top) and quantification (bottom) of the indicated proteins in skeletal muscle and heart isolated from young and aged mice (n = 3 mice per group). b Volcano plot of lipid species altered in aged vs. young muscle (n = 4 mice per group). Lipid species were measured by LC-MS. The x-axis indicates the logarithmic (base 2) fold abundance changes of all identified lipid species and the y-axis indicates negative logarithmic (base 10) t-test p-value. The horizontal dotted line reflects the filtering criterion (p-value = 0.05). c Proportion of major lipid classes in young and aged muscles. dg Volcano plots of PC (d), PE (e), SM (f), and LPC (g) species altered in aged vs. young muscles. The x-axis indicates the percentage changes (aged-young) in lipid abundance and the y-axis indicates negative logarithmic (base 10) t-test p-values. The horizontal dotted line reflects the filtering criterion (p-value = 0.05). Red and green indicate highly increased and decreased lipid species, respectively. h Proportion of saturated (SFA), monounsaturated (MUFA), or polyunsaturated (PUFA) PC acyl chains in young and aged muscles. i Proportion of <C18, C18, or >C18 PC acyl chains in young and aged muscles. Data are presented as means ± S.E.M. Two-tailed unpaired Student’s t-test was used. Source data are provided as a Source Data file.
Fig. 2
Fig. 2. FABP3-overexpressing young muscle exhibits lipid composition similar to aged muscle.
a Volcano plot of lipid species altered in FABP3-overexpressing muscle vs. control muscle. Lipid species were measured by LC-MS. The x-axis indicates the logarithmic (base 2) fold abundance changes of all identified lipid species and the y-axis indicates negative logarithmic (base 10) t-test p-value. The horizontal dotted line reflects the filtering criterion (p-value = 0.05). (n = 4 mice per group). b Proportion of major lipid classes in FABP3-overexpressing and control muscles. cf Volcano plot of PC (c), PE (d), SM (e), and LPC (f) species altered in FABP3-overexpressing vs. control muscles. The x-axis indicates the percentage changes (FABP3 o/e-control) in lipid species and the y-axis indicates negative logarithmic (base 10) t-test p-values. The horizontal dotted line reflects the filtering criterion (p-value = 0.05). Red and green indicate highly increased and decreased lipid species, respectively. g Proportion of SFA, MUFA, or PUFA PC acyl chains in FABP3-overexpressing and control muscles. h Proportion of <C18, C18, or >C18 PC acyl chains in FABP3-overexpressing and control muscles. Data are presented as means ± S.E.M. Two-tailed unpaired Student’s t-test was used. i Correlation analysis of the total identified lipid species in the indicated comparative condition. The x-axis indicates logarithmic (base 2) fold concentration changes of all identified lipid species in aged vs. young muscle, and the y-axis indicates logarithmic (base 2) fold changes in FABP3-overexpressing muscle vs. young muscle. Data in i were analyzed using Spearman’s correlation; correlation coefficient (r) and p-value (p) are in red. Source data are provided as a Source Data file.
Fig. 3
Fig. 3. FABP3-induced membrane rigidity inhibits de novo protein synthesis by inducing the ER stress response.
ac Immunoblot analysis (left) and quantification (right) of the PERK and eIF2α phosphorylation and puromycin incorporation in young (6 months) and aged (25 months) TA muscles (n = 3 mice per group) (a), FABP3-overexpressing and control TA muscles (n = 3 mice per group) (b), and FABP-overexpressing myotubes (n = 3 independent experiments) (c). Mice were injected intraperitoneally with puromycin and muscles (a, b) were harvested 30 min post-injection. TA muscles of young mice (b) were transfected with HA-cherry-FABP3 or HA-cherry control plasmid and were harvested 5 days after transfection. Fully differentiated C2C12 myotubes (c) expressing Cre-inducible FABP3 constructs were infected with Cre-carrying adenovirus (Ad-Cre) and cultured for 3 days before puromycin treatment. Palmitate was treated for 12 h as a positive control ER stress inducer. d Membrane fluidity was analyzed by FRAP. Representative confocal images of the BODIPY 500/510 C1, C12 -labeled myotubes before bleaching (pre-bleach) and at 0 and 50 s. after bleaching (post-bleach). White dotted squares, bleached areas. Scale bar, 20 μm. (n = 24 independent experiments). e Time course fluorescence gain in palmitate-treated or FABP3-overexpressing C2C12 myotubes. t1/2, the half-time for fluorescence recovery; black, control, n = 9; gray, palmitate, n = 7; red, FABP3, n = 8 each myotube. f, g Temperature effect on membrane fluidity and ER stress. FABP3-overexpressing and control C2C12 myotubes were incubated at 32 or 37 °C. Membrane fluidity (f) was measured by FRAP analysis. Note the t1/2 values in FRAP analyses. Black, 37 °C, n = 6; gray, 32 °C, n = 8; red, FABP3 at 32 °C, n = 6; light red, FABP3 at 37 °C, n = 8 each myotube. g Immunoblot analysis (left) and quantification (right) of the indicated proteins and puromycin incorporation. Data are presented as means ± S.E.M. Two-tailed unpaired Student’s t-test was used. Source data are provided as a Source Data file.
Fig. 4
Fig. 4. FABP3-overexpressing young muscle exhibits impaired muscle recovery after immobilization and early fatigue.
a Scheme of the experimental procedures. TA muscles of young mice were transfected with HA-cherry-FABP3 or HA-cherry control plasmid, immobilized with a surgical staple 5 days after transfection, and allowed to recover (remobilization, n = 5) after 5-day immobilization (n = 5). b TA muscle mass was measured 5 days after immobilization and 5 days after remobilization. Changes in muscle mass were expressed as percentage of control. c Representative images of the transfected myofibers (red). (n = 5 per group). Scale bars, 100 μm. d Frequency histograms of the cross-sectional area (left) of HA-cherry-FABP3- or HA-cherry control plasmid-transfected muscle fibers 5 days after remobilization. Box plot representing the mean cross-sectional areas (right) of transfected muscle fibers. Box represent the 25th–75th percentiles of the data; whiskers show the min and max range of the data; horizontal lines indicate the median value. e Immunoblot analysis of PERK and eIF2α phosphorylation, and puromycin incorporation in FABP3-overexpressing and control TA muscles after remobilization. Five days after remobilization, mice were injected intraperitoneally with puromycin. TA muscles were harvested 30 min post-injection (n = 3 mice per group). fi Muscle forces were measured in intact HA-cherry FABP3 or HA-cherry control plasmid-transfected TA muscles mounted on a force transducer. The maximum twitch force (f) at supramaximal voltage, 100 V for 1 ms. Frequency dependence (at 30–200 Hz, 100 V, 500 ms) of average tetanic force (g). Tetanic force traces (h) at 200 Hz for 500 ms (n = 7 mice per group). Fatigue index (i) was measured at 1 Hz and 100 V for 10 min. Generated force was recorded and expressed as a percentage of the initial force (left). Insert represents area under curve (AUC) (right) (n = 7 mice per group). Data are presented as means ± S.E.M. Two way ANOVA withBonferroni’s post hoc test was used (left in i) and two-tailed unpaired Student’s t-test was used (b, d, right in i). Source data are provided as a Source Data file.
Fig. 5
Fig. 5. FABP3 inhibition in aged muscle results in young-like lipid composition.
a Volcano plot of lipid species altered in FABP3-knockdown aged vs. control muscle. Lipid species were measured by LC-MS. The x-axis indicates logarithmic (base 2) fold abundance changes of all identified lipid species and the y-axis indicates negative logarithmic (base 10) t-test p-value. The horizontal dotted line reflects the filtering criterion (p-value = 0.05). (n = 4 mice per group) b Proportion of major lipid classes in FABP3-knockdown and control aged muscles. cf Volcano plot of PC (c), PE (d), SM (e), LPC (f) species altered in FABP3-knockdown vs. control aged muscles. The x-axis indicates the percentage changes (FABP3KD-control-aged muscle) of lipid species and the y-axis indicates negative logarithmic (base 10) t-test p-values. The horizontal dotted line reflects the filtering criterion (p-value = 0.05). Red and green indicate highly increased and decreased lipid species, respectively. g Proportion of SFA, MUFA, or PUFA PC acyl chains in FABP3-knockdown and control-aged muscles. h Proportion of <C18, C18, or >C18 PC acyl chains in FABP3-knockdown and control-aged muscles. The data are presented as means ± S.E.M. Two-tailed unpaired Student’s t-test was used. i Correlation analysis of the total identified lipid species in the indicated comparative condition. The x-axis indicates logarithmic (base 2) fold concentration changes of all identified lipid species in FABP3-knockdown aged vs. aged muscle and the y-axis indicates logarithmic (base 2) fold changes in aged vs. young muscle. Data in i were analyzed using Spearman’s correlation; correlation coefficient (r) and p-value (p) are in red. Source data are provided as a Source Data file.
Fig. 6
Fig. 6. FABP3 inhibition alleviated ER stress.
a, b Immunoblot analysis (left) and quantification (right) of the indicated proteins and puromycin incorporation in FABP3-knockdown aged and control muscles (a) and FABP3-knockdown myotubes (b). GAPDH was used as a loading control. TA muscles of aged mice (a) were infected with Ad-shFABP3 virus or Ad-shControl. Mice were injected intraperitoneally with puromycin (0.04 mmol/kg) 5 days after infection (n = 3 mice per group). C2C12 myotubes (b, c) were transfected with siFABP3 or siControl and treated with palmitate (500 μM) or vehicle for 12 h. Myotubes were then incubated with puromycin (1 μM) for 30 min (n = 3 independent experiments) (b). c Time course fluorescence recovery. Note the t1/2 values in FRAP analyses. Black, siControl, n = 6; gray, siFABP3, n = 6; deep blue, siControl + palmitate, n = 6; light blue, siFABP3+palmitate, n = 7 each myotube. Data are presented as means ± S.E.M. Two-tailed unpaired Student’s t-test was used. Source data are provided as a Source Data file.
Fig. 7
Fig. 7. PUFA supplementation alleviates FABP3-induced ER stress.
Effects of DHA on fluidity (a), ER stress signal (b), and morphology (c). FABP3 expression was induced with Cre recombinase-carrying adenovirus (Ad-Cre) infected into fully differentiated C2C12 myotubes harboring Cre-inducible FABP3 constructs. FABP3-overexpressing myotubes or palmitate (500 μM)-treated myotubes were treated with DHA (100 μM) or vehicle. a Membrane fluidity was measured by FRAP analysis. Note the t1/2 values in FRAP analyses. Black, control, n = 6; gray, DHA, n = 6; deep blue, palmitate, n = 5; light blue, palmitate+DHA, n = 9; red, FABP3, n = 5; light red, FABP3+DHA, n = 9 each myotube. b Immunoblot analysis (left) and quantification (right) of the indicated proteins and puromycin incorporation. Myotubes were incubated with puromycin (1 μM) for 30 min (n = 3 independent experiments). c the effect of DHA supplementation on FABP3-induced loss of atrophy recovery. FABP3-overexpressing or palmitate-treated myotubes were treated with dexamethasone (10 μM). Representative images (left) of MyHC (green) and DAPI (blue) staining in myotubes following DHA supplementation (100 μM) for 24 h (n = 3 independent experiments). Scale bar, 100 μm. Quantification (right) of myotubes diameter treated with dexamethasone. Data are presented as means ± S.E.M. Two-tailed unpaired Student’s t-test was used. Source data are provided as a Source Data file.
Fig. 8
Fig. 8. FABP3 knockdown ameliorated an impaired muscle recovery in aged mice.
a Scheme of the experimental procedures. TA muscles of aged mice were infected with Ad-shFABP3 or Ad-shControl virus, immobilized with a surgical staple 5 days after infection, and allowed to recover (remobilization) after 5-day immobilization. b TA muscle mass was measured at 5 days after immobilization (n = 5) and 5 days after remobilization (n = 7). Changes in muscle weight for immobilization and remobilization were expressed as the percentage of the contralateral non-immobilized muscle weight. c Representative images of laminin (red) and DAPI (blue) staining of myofibers infected with Ad-shFABP3 or Ad-shControl virus Scale bar, 200 μm. d Frequency histograms of the cross-sectional area (left) of Ad-shFABP3 or Ad-shControl virus-infected fibers 5 days after remobilization. Box plot representing the mean fiber cross-sectional areas (right). Box represent the 25th–75th percentiles of the data; whiskers show the min and max range of the data; horizontal lines indicate the median value. e Immunoblot analysis of PERK and eIF2α phosphorylation, and puromycin incorporation in Ad-shFABP3 or Ad-shControl virus-infected TA muscles after remobilization. TA muscles were harvested 30 min post-interperitoneal puromycin injection. (n = 3 mice per group). fi Ad-shFABP3 or Ad-shControl virus-infected TA muscles were mounted on a force transducer. The maximum twitch force (f) at supra-maximal voltage, 100 V for 1 ms. Frequency dependence of average tetanic force curves (g) at 30–200 Hz, 100 V, 500 ms for each frequency. Tetanic force traces (h) upon stimulation at 200 Hz for 500 ms. Data are presented as means. (n = 7 mice per group) Fatigue index (i) was measured at 1 Hz and 100 V by repeated stimuli for 10 min. Generated force was analyzed as a percentage of the initial contractile force (n = 7 mice per group) (left). Insert represents area under curve (AUC) (right). Data are presented as means ± S.E.M. Two way ANOVA with Bonferroni’s post hoc test was used (left in i) and two-tailed unpaired Student’s t-test was used (b, d, right in i). j Proposed model for age-dependent lipid remodeling by FABP3. Source data are provided as a Source Data file.

References

    1. Rosenberg IH. Sarcopenia: origins and clinical relevance. J. Nutr. 1997;127:990S–991S. doi: 10.1093/jn/127.5.990S. - DOI - PubMed
    1. Lauretani F, et al. Age-associated changes in skeletal muscles and their effect on mobility: an operational diagnosis of sarcopenia. J. Appl. Physiol. 2003;95:1851–1860. doi: 10.1152/japplphysiol.00246.2003. - DOI - PubMed
    1. Visser M, Schaap LA. Consequences of sarcopenia. Clin. Geriatr. Med. 2011;27:387–399. doi: 10.1016/j.cger.2011.03.006. - DOI - PubMed
    1. Cao L, Morley JE. Sarcopenia is recognized as an independent condition by an international classification of disease, tenth revision, clinical modification (ICD-10-CM) Code. J. Am. Med. Dir. Assoc. 2016;17:675–677. doi: 10.1016/j.jamda.2016.06.001. - DOI - PubMed
    1. Dennison EM, Sayer AA, Cooper C. Epidemiology of sarcopenia and insight into possible therapeutic targets. Nat. Rev. Rheumatol. 2017;13:340–347. doi: 10.1038/nrrheum.2017.60. - DOI - PMC - PubMed

Publication types

MeSH terms

LinkOut - more resources