. 2020 Nov 9;11(1):5660.
doi: 10.1038/s41467-020-19464-8.

Human endogenous retroviruses form a reservoir of T cell targets in hematological cancers

Affiliations

Human endogenous retroviruses form a reservoir of T cell targets in hematological cancers

Sunil Kumar Saini et al. Nat Commun. .

Abstract

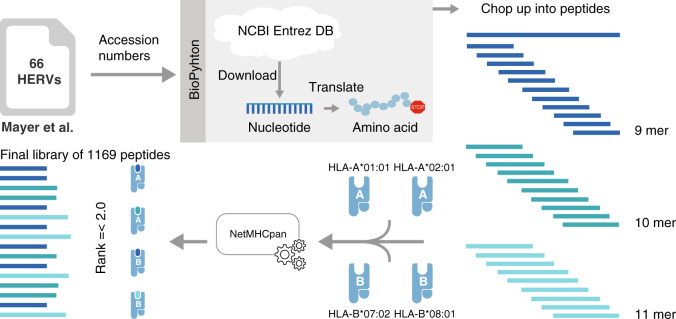
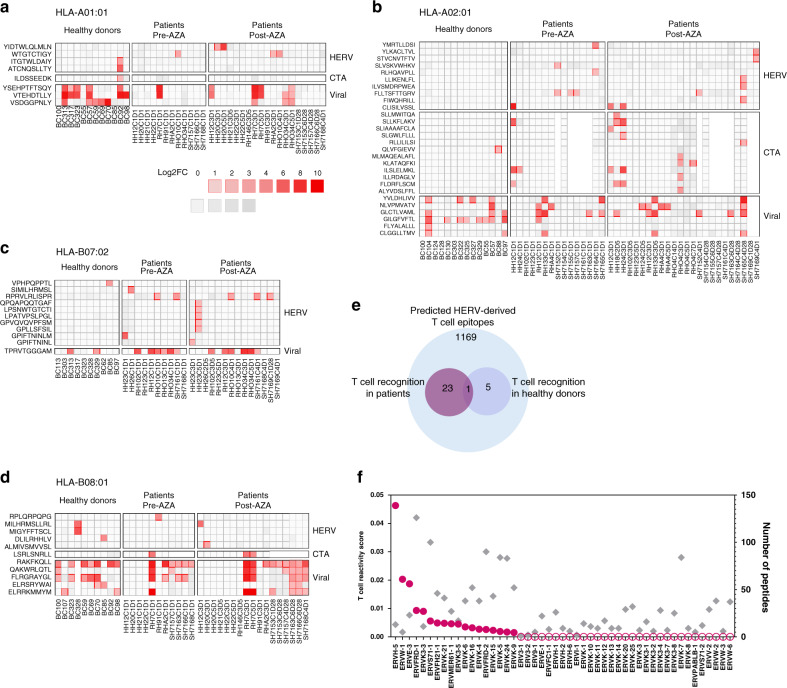
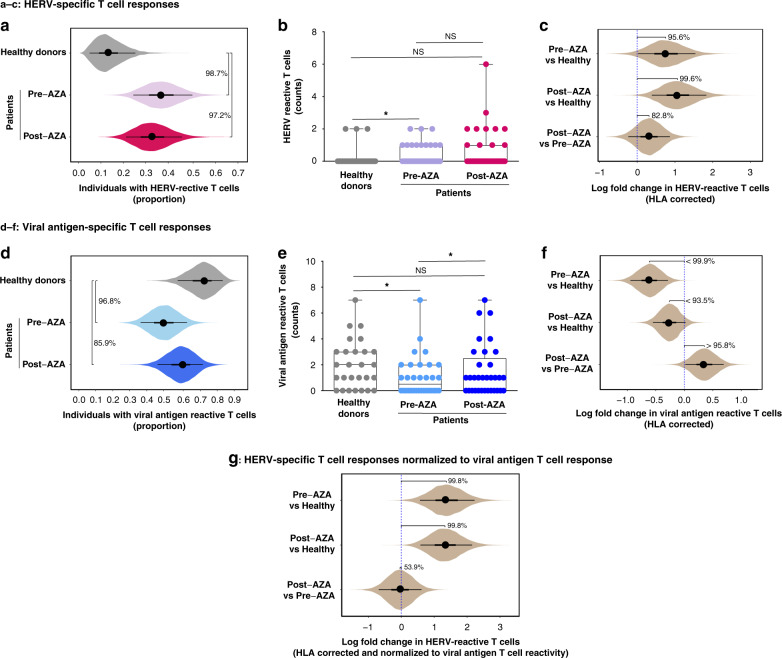
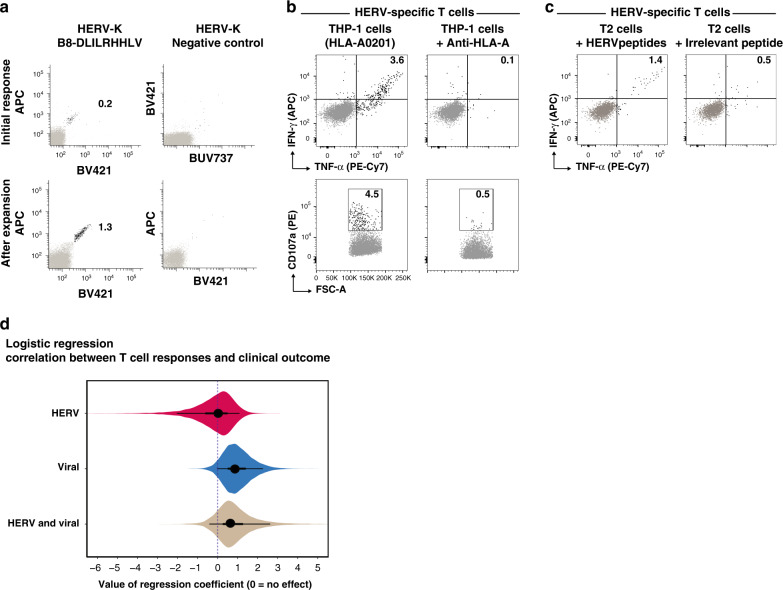
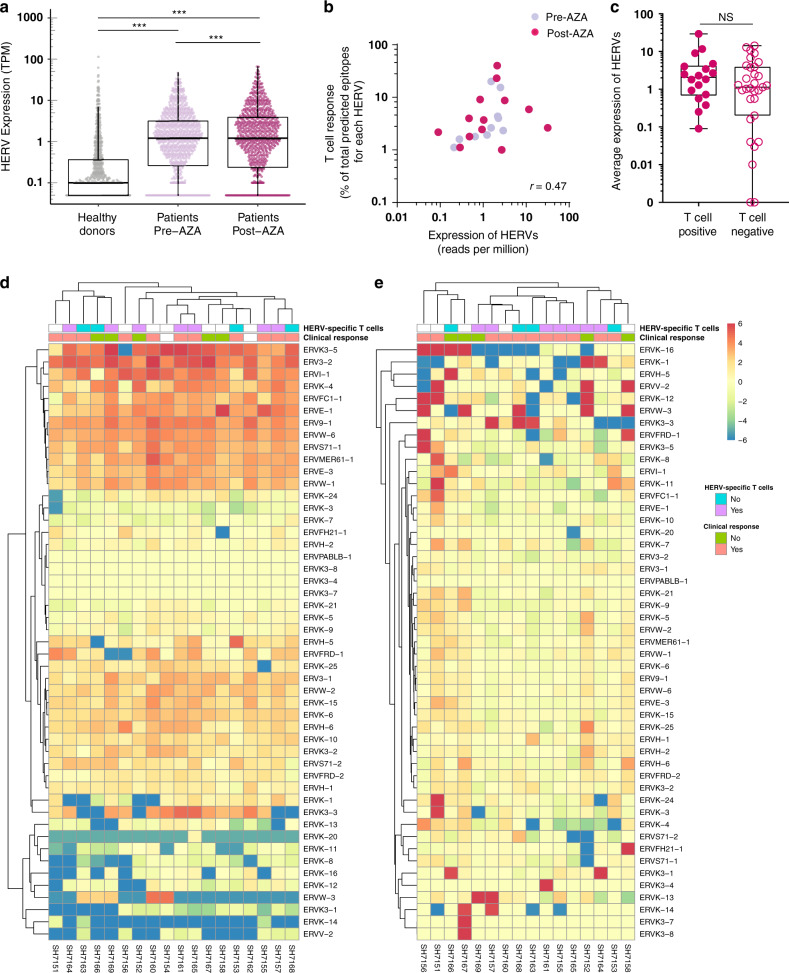
Human endogenous retroviruses (HERV) form a substantial part of the human genome, but mostly remain transcriptionally silent under strict epigenetic regulation, yet can potentially be reactivated by malignant transformation or epigenetic therapies. Here, we evaluate the potential for T cell recognition of HERV elements in myeloid malignancies by mapping transcribed HERV genes and generating a library of 1169 potential antigenic HERV-derived peptides predicted for presentation by 4 HLA class I molecules. Using DNA barcode-labeled MHC-I multimers, we find CD8+ T cell populations recognizing 29 HERV-derived peptides representing 18 different HERV loci, of which HERVH-5, HERVW-1, and HERVE-3 have more profound responses; such HERV-specific T cells are present in 17 of the 34 patients, but less frequently in healthy donors. Transcriptomic analyses reveal enhanced transcription of the HERVs in patients; meanwhile DNA-demethylating therapy causes a small and heterogeneous enhancement in HERV transcription without altering T cell recognition. Our study thus uncovers T cell recognition of HERVs in myeloid malignancies, thereby implicating HERVs as potential targets for immunotherapeutic therapies.


Conflict of interest statement

K.G. has served as advisory board member for Celgene. The remaining authors declare that they have no competing interests.

Figures

Fig. 1
Fig. 1. Schematic of HERV-derived peptides selected for T cell analysis.
Accession numbers for known transcribed HERVs published by Mayer et al. were used to download the reported nucleotide sequences from the National Center for Biotechnology Information’s (NCBIs) Entrez database (DB). The sequences were translated into amino acids until a stop codon occurred. Thereafter, the sequences were chopped into 9-, 10-, and 11mer peptides. Binding of all extracted peptides to the four most common Caucasian HLA alleles (HLA-A*01:01, -A*02:01, -B*07:02, and -B*08:01) was predicted using NetMHCpan 2.8. The final library consists of 1169 peptides from 49 of the 66 HERVs, all with a predicted binding percentile rank score of 2 or below to any of the four HLA alleles.
Fig. 2
Fig. 2. T cell reactivity to HERV-derived peptides in myeloid malignancies.
T cells reactive to HERV-derived peptides, CTAs, and viral antigens were identified from peripheral blood (Danish patients and healthy donors (HD)) and bone marrow (Australian patients) samples using a DNA barcode-based pMHC multimer analysis. ad Identified T cell responses are shown across the four tested HLAs for healthy donors and patient samples pre- and post-AZA therapy. Vertical axis labels the sample IDs and the horizontal axis shows the peptide sequences (single letter amino acid codes) split into three categories of antigens (HERV, CTA, and viral). T cell responses are shown based on barcode enrichment (Log2FC) in the sorted population compared to the complete pMHC library, and red scale determines significant enrichment (FDR < 0.1%) and gray scale if no significant enrichment was found. Peptides identified to have a T cell response in at least one of the analyzed samples are included; data for all the tested peptides are shown in Supplementary Fig. 2. The white color indicates peptides not tested in the specific samples. Patient samples with the prefix “RH” and “HH” derive from the Danish patients and patient samples with the prefix “SH” derive from the Australian patients. e Venn diagram summarizing numbers of immunogenic HERV-derived T cell epitopes identified in patients and healthy donors. f T cell reactivity score (pink dots, plotted in descending order) and peptide library size (gray diamonds) of individual HERVs analyzed for T cell recognition in the patients. Pink hollow dots represent HERVs with no T cell reactivity. T cell reactivity score is calculated as the sum of all the T cell reactive peptides out of the total peptide library of a given HERV tested across the patient samples. Source data are provided as Source data file.
Fig. 3
Fig. 3. Patients with myeloid malignancies have increased levels of T cell recognition to HERV-derived peptides.
CD8+ T cell responses, identified using DNA-barcoded-pMHC multimers (Fig. 2), grouped for individual categories of HERV- and viral-antigen libraries across healthy donors and patient samples before and after AZA treatment. a The proportion of individuals within the respective groups with detectable HERV-specific T cell responses (in a, c, d, f, and g uncertainty about estimates is indicated by showing the posterior probability distribution in the form of “eye plots”: dot and bars indicate the posterior median, the 50% credible interval (CI), and the 90% CI values). Median and 90% CI values are: healthy donors 0.13 [0.05, 0.25], pre-AZA 0.37 [0.25, 0.50], post-AZA 0.33 [0.20, 0.46]. Posterior probability that proportions increased: 99% (pre-AZA > healthy donors), 97% (post-AZA > healthy donors), and 36% (post-AZA > pre-AZA). b The number of HERV peptides recognized by CD8+ T cell populations in individual healthy donors and patients (pre- and post-AZA). P-values for hypothesis tests comparing the number in pairs of groups: p = 0.02 (healthy donor vs pre-AZA, Mann–Whitney–Wilcoxon test, one-tailed), p = 0.07 (healthy donor vs post-AZA, Mann–Whitney–Wilcoxon test, one-tailed), and p = 0.60 (pre-AZA vs post-AZA, Wilcoxon Signed-Rank test, one-tailed). Box plots showing the median, the lower and upper quartiles, and the whiskers as minimum and maximum values. Healthy donors, n = 27; pre-AZA, n = 33; post-AZA, n = 34 (source data are provided as Source data file). c Log fold change in proportion of HERV peptides recognized by CD8+ T cells. The proportion of recognized HERV peptides, and the log fold change in these proportions between pairs of cohorts, was estimated using a regression model that also corrected for the HLA alleles present in each individual sample. Pre-AZA vs healthy donors 0.75 [0.02, 1.5], post-AZA vs healthy donors 1.1 [0.39, 1.8], and post-AZA vs pre-AZA 0.32 [−0.24, 0.87]. Posterior probability that log fold change >0: 96% (pre-AZA vs healthy donors), 100% (post-AZA vs healthy donors), and 83% (post-AZA vs pre-AZA). d The proportion of individuals within the respective groups with detectable T cell responses to viral antigens. Healthy donors 0.73 [0.58, 0.85], pre-AZA 0.50 [0.36, 0.64], post--AZA 0.60 [0.47, 0.73]. Posterior probability that proportions in pairs of groups are different: 97% (pre-AZA < healthy donors), 86% (post-AZA < healthy donors), and 80% (post-AZA > pre-AZA). e Number of viral antigens recognized by CD8+ T cell populations in individual patients (pre- and post-AZA treatment) and healthy donors. P-values for hypothesis tests comparing the number in pairs of groups: p = 0.01 (healthy donor vs pre-AZA, Mann–Whitney–Wilcoxon test, one-tailed), p = 0.097 (healthy donor vs post-AZA, Mann–Whitney–Wilcoxon test, one-tailed), and p = 0.05 (pre-AZA vs post-AZA, Wilcoxon Signed-Rank test, one-tailed). Box plots showing the median, the lower and upper quartiles, and the whiskers as minimum and maximum values. Healthy donors, n = 27; pre-AZA, n = 32; post-AZA, n = 33 (source data are provided as Source data file). f Log fold change in proportion of viral peptides recognized by CD8+ T cells estimated using the regression model and corrected for individual HLA alleles. Pre-AZA vs healthy donors −0.61 [−0.95, −0.29], post-AZA vs healthy donors −0.26 [−0.55, 0.023], and post-AZA vs pre-AZA 0.35 [0.017, 0.69]. Posterior probability that log fold change >0: 100% (pre-AZA < healthy donors), 94% (post-AZA < healthy donors), and 96% (post-AZA > pre-AZA). g Log fold change in proportion of HERV peptides recognized by CD8+ T cells corrected for HLA alleles and normalized to viral antigen responses; pre-AZA vs healthy donors 1.4 [0.57, 2.23], post-AZA vs healthy donors 1.3 [0.58, 2.2], and post-AZA vs pre-AZA −0.04 [−0.69, 0.61]. Posterior probability that log fold change >0: 100% (pre-AZA vs healthy donors), 100% (post-AZA vs healthy donors), and 54% (post-AZA vs pre-AZA).
Fig. 4
Fig. 4. HERV-reactive T cell functionality and their relation to clinical outcome.
a Top panel, Flow cytometry plots of T cells detected in healthy donor PBMCs (BC85) reactive to a HERV-derived peptide (identified using DNA-barcoded multimer analysis, shown in panel d). An HLA-B*08:01-restricted HERV-derived peptide not identified to be reactive with T cells in the DNA-barcode multimer analysis was used as a negative control. Bottom panel, HERV-specific T cells from the same donor were expanded ex vivo using pMHCs and cytokines. T cells were identified using pMHC tetramers in a combinatorial color encoding strategy defining a unique two-color combination for identified T cells. Black dots represent dual-color tetramer-positive antigen-specific CD8+ T cells and gray dots are tetramer-negative or single-color positive CD8+ T cells. Numbers on plots indicate frequency (%) of antigen-specific CD8+ T cells. b Functional analysis of HERV-specific T cells expanded from patient SH7152 (identified using DNA-barcoded multimer analysis, shown in b) using pMHCs (SLVSKVWHKV and FLLTSFTTGRV restricted to HLA-A*02:01) incubated with HLA-A*02:01-restricted THP-1 cells. THP-1 cells blocked with anti-HLA-A antibodies are used as controls. c Functional analysis of same HERV-specific T cells in the presence of T2 cells loaded with HERV-peptides SVSKVWHKV and FLLTSFTTGRV or with an irrelevant peptide (A*02:01-restricted HIV pol epitope ILKEPVHGV). Numbers on the plots (B and C) show the frequency of CD8+ T cells positive for intracellular cytokine IFN-γ and TNF-α and degranulation marker CD107a. d Logistic regression exploring the relationship between clinical outcome and T cell response to viral or HERV peptides. The plot shows the posterior distribution of regression coefficients (eye plot with indication of posterior mean, 50% CI, and 90% CI) for the following predictors: HERV; the effect of any response to HERV peptides. Viral; the effect of any response to viral peptides. HERV and viral; interaction term indicating the effect of having T cell responses to both HERV and viral peptides. Note that the credible intervals for all regression coefficients include 0, indicating no statistically significant effect of the explored predictors, although there may be a positive effect of Viral and HERV and viral.
Fig. 5
Fig. 5. Enrichment of HERV-specific T cells in patients correlates with enhanced expression of HERV elements.
RNA-seq analysis of previously published data of 18 patients from the Australian patient cohort was performed to quantify the expression of the 49 HERVs tested for T cell analysis. a Expression of the 49 HERVs in each of the patients (before, n = 18, and after, n = 16, AZA treatment) compared with healthy donors (n = 14). Mann–Whitney–Wilcoxon test, two-tailed, p < 2.2e−16 (healthy donors vs pre-AZA), p < 2.2e−16 (healthy donors vs post--AZA). Wilcoxon Signed-Rank test, two-tailed, p = 1.8e−4 (pre-AZA vs post-AZA). RNA-seq data of healthy donors were obtained from previously published data (Supplementary Table 6). Healthy donors, n = 588 (49 HERVs across 12 healthy donors; pre- and post-AZA, n = 784 (49 HERVs across 16 patients). b Correlation of HERV-specific T cell responses identified in patient samples (shown in Fig. 2) with the expression of their associated HERVs. X-axis shows expression of the HERV transcripts (mean across the 18 patients, before or after treatment). Y-axis shows the proportion of identified T cell epitopes (before and after AZA treatment), i.e., number of T cell epitopes detected out of total predicted epitopes from a given HERV. Spearman correlation between HERV expression and T cell responses, r = 0.47 was significantly different from zero (p = 0.018) (source data are provided as Source data file). c Expression of the 18 HERV loci recognized by T cell populations compared with the expression of the 31 HERV loci not contributing to any T cell response. Expression was quantified as transcripts per million of total reads (TPM) and is given as the mean value for patients, including values both before and after AZA treatment; Mann–Whitney–Wilcoxon test, two-tailed, p = 0.26. T cell positive, n = 18; T cell negative, n = 31 (source data are provided as Source data file). d Heatmap of estimated fold change for individual HERVs across the 18 patients (before treatment) compared to mean expression HERV value across all healthy donors (using mean expression values of transcripts for each HERV gene). For comparative representation, the fold change color scale is restricted from −6 to 6, and fold change values outside this limit are shown at the maximum (>6 = 6) or minimum scale (< −6 = −6). HERV specific T cell occurrence together with information regarding clinical response is annotated in the top bars for each patient. e Similar to (d) comparing pre- and post-AZA treatment. In boxplots the box shows the 1st quartile (Q1), the median, and the 3rd quartile (Q3), while whiskers extend to 1.5 times the interquartile range (IQR) on either side of the box (or to the minimum and maximum data values if these are less than 1.5 * IQR from Q1 and Q3).

References

    1. Feschotte C, Gilbert C. Endogenous viruses: insights into viral evolution and impact on host biology. Nat. Rev. Genet. 2012;13:283–296. doi: 10.1038/nrg3199. - DOI - PubMed
    1. Dewannieux M, Heidmann T. Endogenous retroviruses: acquisition, amplification and taming of genome invaders. Curr. Opin. Virol. 2013;3:646–656. doi: 10.1016/j.coviro.2013.08.005. - DOI - PubMed
    1. Stoye JP. Studies of endogenous retroviruses reveal a continuing evolutionary saga. Nat. Rev. Microbiol. 2012;10:395–406. doi: 10.1038/nrmicro2783. - DOI - PubMed
    1. Mameli G, et al. Activation of MSRV-type endogenous retroviruses during infectious mononucleosis and Epstein-Barr virus latency: the missing link with multiple sclerosis? PLoS ONE. 2013;8:e78474. doi: 10.1371/journal.pone.0078474. - DOI - PMC - PubMed
    1. Herbst H, Sauter M, Kühler-Obbarius C, Löning T, Mueller-Lantzsch N. Human endogenous retrovirus (HERV)-K transcripts in germ cell and trophoblastic tumours. APMIS. 1998;106:216–220. doi: 10.1111/j.1699-0463.1998.tb01338.x. - DOI - PubMed

Publication types

Substances