. 2020 Nov 9;10(1):19359.
doi: 10.1038/s41598-020-75445-3.

Drivers and impacts of the most extreme marine heatwaves events

Affiliations

Drivers and impacts of the most extreme marine heatwaves events

Alex Sen Gupta et al. Sci Rep. .

Abstract

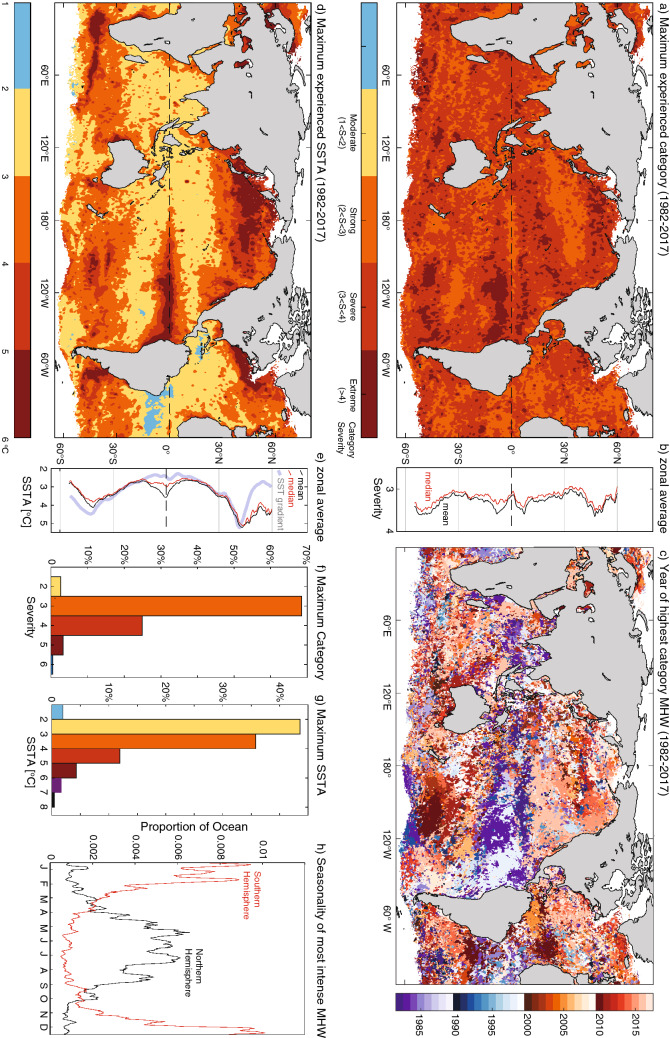
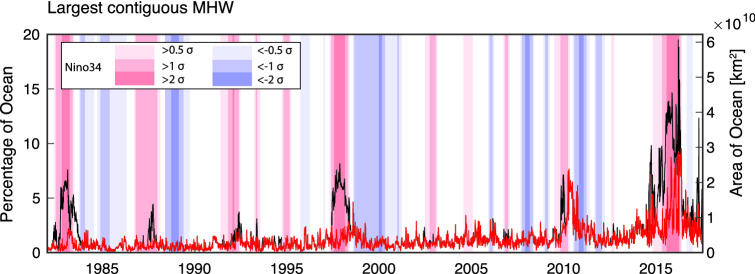
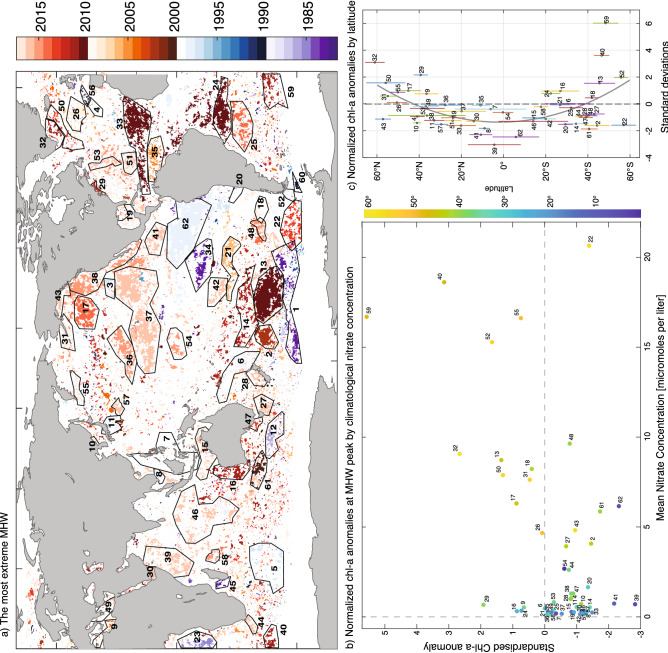
Prolonged high-temperature extreme events in the ocean, marine heatwaves, can have severe and long-lasting impacts on marine ecosystems, fisheries and associated services. This study applies a marine heatwave framework to analyse a global sea surface temperature product and identify the most extreme events, based on their intensity, duration and spatial extent. Many of these events have yet to be described in terms of their physical attributes, generation mechanisms, or ecological impacts. Our synthesis identifies commonalities between marine heatwave characteristics and seasonality, links to the El Niño-Southern Oscillation, triggering processes and impacts on ocean productivity. The most intense events preferentially occur in summer, when climatological oceanic mixed layers are shallow and winds are weak, but at a time preceding climatological maximum sea surface temperatures. Most subtropical extreme marine heatwaves were triggered by persistent atmospheric high-pressure systems and anomalously weak wind speeds, associated with increased insolation, and reduced ocean heat losses. Furthermore, the most extreme events tended to coincide with reduced chlorophyll-a concentration at low and mid-latitudes. Understanding the importance of the oceanic background state, local and remote drivers and the ocean productivity response from past events are critical steps toward improving predictions of future marine heatwaves and their impacts.


Conflict of interest statement

The authors declare no competing interests.

Figures

Figure 1
Figure 1
Characteristics of MHW category and intensity. (a) Maximum experienced category (from 1982 to 2017), (b) associated zonal average (red/black lines are zonal medians/means), (f) associated area weighted probability distributions. (d,e,g) as per (a,b,f) but for maximum recorded intensity i.e. maximum daily SSTA (in e grey line indicates the relative magnitude of the zonally averaged meridional SST gradient), (c) year of maximum recorded category (i.e. when the severity index was highest; the associated year of maximum intensity is shown in Figure S3); (h) proportion of ocean by month experiencing most intense MHW for northern (> 5o N, black) and southern (< -5o S, red) hemispheres. Colour in (f) and (g) correspond to colour bars in (a) and (d), respectively.
Figure 2
Figure 2
ENSO modulation of MHW severity. (a) Proportion of ocean area (in a given month) experiencing its most severe (grey shaded) or intense (red bars) MHWs. Shaded bands show |Niño3.4|> [0.5, 1, 2] standard deviation (σ). Niño3.4 index and dashed zero-line superimposed (black lines); (b) regions of most severe MHWs that occurred when Niño3.4 > 1 (light red), Niño3.4 > 2 (red), Niño3.4 < − 1 (light blue), Niño3.4 < − 2 (blue). Superimposed regression of normalized Niño3.4 index on SSTA (interval 0.1 °C). Regression based on monthly SSTA from HadISST (1950-present). Niño3.4 represents the averaged SSTA in the region 5° S to 5° N and 170° W to 120° W.
Figure 3
Figure 3
Characteristics of MHW duration. (a) Duration of longest recorded MHWs and associated zonal mean (black) and median (red) (b). (c) Proportion of ocean experiencing maximum MHW duration for all MHW categories (blue) and for strong or greater MHW categories (red); coloured lines show associated cumulative totals), (d) central year of longest MHW; (e) proportion of ocean experiencing its longest (red) and largest cumulative intensity (dashed) MHW by month.
Figure 4
Figure 4
Largest single contiguous MHW each day (black lines). Red lines indicate contiguous MHW that do not intersect the equatorial central or eastern Pacific (i.e. > 170o E within 5° of equator).
Figure 5
Figure 5
Most extreme MHW events. (a) Year of most severe MHW where it intersects in time with the MHW with the largest cumulative intensity (which generally corresponds with the longest MHW). Semi-contiguous regions where timing of most severe/largest cumulative intensity are similar have been manually identified (black polygons; regions 1–62). Characteristics of these regions are described in Table 1. (b) Normalized chlorophyll-a anomalies versus climatological nitrate concentration for subset of regions for which chlorophyll-a data is. Chlorophyll-a is averaged over a 24-day period centred on the MHW peak (chlorophyll-a anomalies are averaged over each region in (a) and divided by the standard deviation of the associated chlorophyll-a anomalies in those regions). Colours indicate the latitude (north or south of the equator). (c) Associated normalized chlorophyll-a anomalies by latitude.
Figure 6
Figure 6
Normalised anomalies averaged over the 62 identified extreme MHW regions, before (average of 6 to 3 weeks prior to event peak, top panels) and after (average of 3 to 6 weeks after event peak, lower panels) the peak of the event. Coloured lines indicate the latitudinal extent of the MHW. Numbers indicate the regions shown in Fig. 5. Large, black circles indicate anomalies are within the top decile of anomalies for the same 4-week period across all years; large, red circles indicate the most extreme of all the anomalies for the same 4-week period across all years. Percentages above each panel indicate the percentage of regions for which anomalies are > 0.

References

    1. Wernberg T, et al. Climate-driven regime shift of a temperate marine ecosystem. Science. 2016;353:169–172. doi: 10.1126/science.aad8745. - DOI - PubMed
    1. Oliver ECJ, et al. The unprecedented 2015/16 Tasman Sea marine heatwave. Nat. Commun. 2017;8:16101. doi: 10.1038/ncomms16101. - DOI - PMC - PubMed
    1. Di Lorenzo E, Mantua N. Multi-year persistence of the 2014/15 North Pacific marine heatwave. Nat. Clim. Change. 2016;6:1042–1047. doi: 10.1038/nclimate3082. - DOI
    1. Hughes TP, et al. Global warming transforms coral reef assemblages. Nature. 2018;556:492–496. doi: 10.1038/s41586-018-0041-2. - DOI - PubMed
    1. Thomsen, M. S. et al. Local extinction of bull kelp (Durvillaea spp.) due to a marine heatwave. Front. Mar. Sci.6 (2019).

Publication types