. 2020 Nov 9;10(1):19373.
doi: 10.1038/s41598-020-76555-8.

Transcriptome and methylome analysis reveals three cellular origins of pituitary tumors

Affiliations

Transcriptome and methylome analysis reveals three cellular origins of pituitary tumors

Keiko Taniguchi-Ponciano et al. Sci Rep. .

Abstract

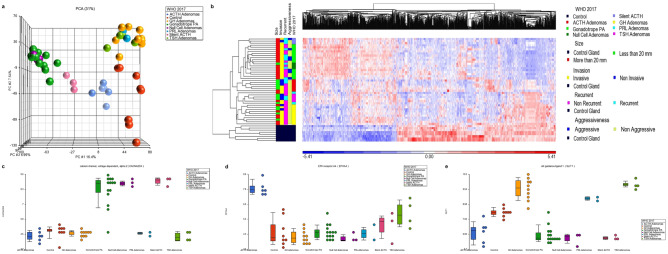
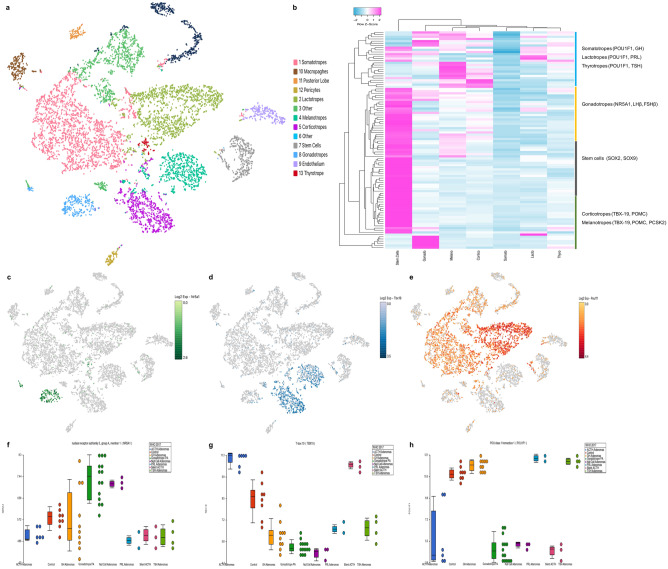
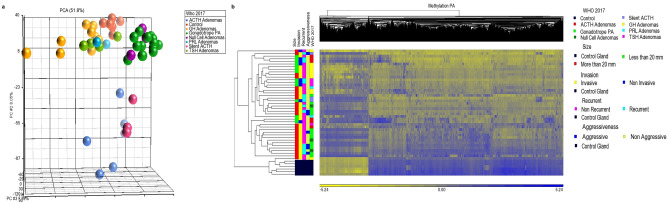
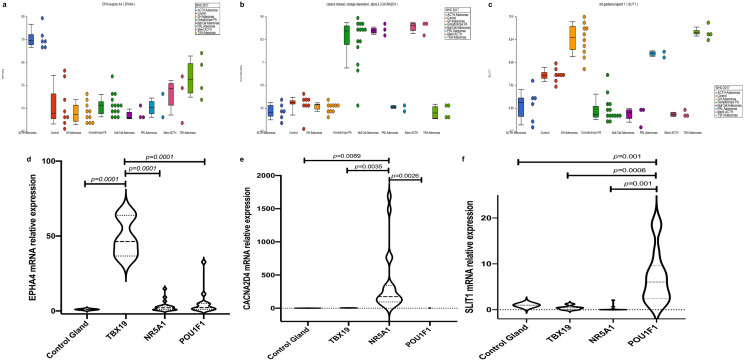
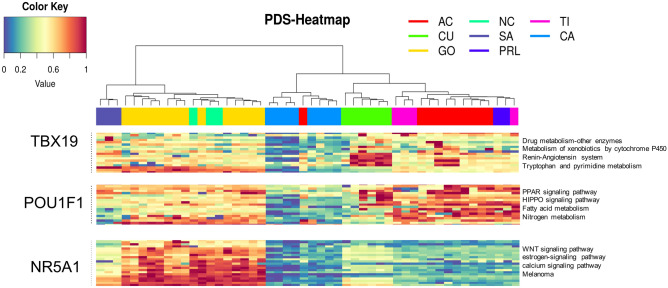
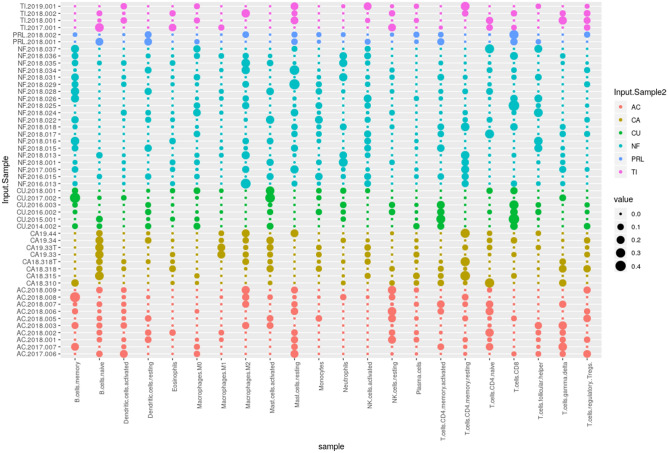
Pituitary adenomas (PA) are the second most common intracranial tumors. These neoplasms are classified according to the hormone they produce. The majority of PA occur sporadically, and their molecular pathogenesis is incompletely understood. The present transcriptomic and methylomic analysis of PA revealed that they segregate into three molecular clusters according to the transcription factor driving their terminal differentiation. First cluster, driven by NR5A1, consists of clinically non-functioning PA (CNFPA), comprising gonadotrophinomas and null cell; the second cluster consists of clinically evident ACTH adenomas and silent corticotroph adenomas, driven by TBX19; and the third, POU1F1-driven TSH-, PRL- and GH-adenomas, segregated together. Genes such as CACNA2D4, EPHA4 and SLIT1, were upregulated in each of these three clusters, respectively. Pathway enrichment analysis revealed specific alterations of these clusters: calcium signaling pathway in CNFPA; renin-angiotensin system for ACTH-adenomas and fatty acid metabolism for the TSH-, PRL-, GH-cluster. Non-tumoral pituitary scRNAseq data confirmed that this clustering also occurs in normal cytodifferentiation. Deconvolution analysis identify potential mononuclear cell infiltrate in PA consists of dendritic, NK and mast cells. Our results are consistent with a divergent origin of PA, which segregate into three clusters that depend on the specific transcription factors driving late pituitary cytodifferentiation.


Conflict of interest statement

The authors declare no competing interests.

Figures

Figure 1
Figure 1
(A) PCA of pituitary adenoma (PA) transcriptome showing three distinct clusters: POU1F1-driven GH-, TSH- and PRL-adenomas; NR5A1-driven gonadotropinomas and null cell adenomas; and TBX19-driven clinically evident ACTH adenomas. Silent ACTH PA grouped separately sharing features with both, TBX19-dependent and NR5A1-dependent adenomas. (B) Heatmap of the differentially expressed genes. In the “Y” axis tumor samples are grouped according to the World Health Organization (WHO) 2017 classification as gonadotrope cell adenomas, null-cell adenomas, clinically evident ACTH adenomas, clinically silent ACTH adenomas, somatotrope adenomas, prolactinomas and TSH adenomas; tumors are also classified in the figure according to clinical features such as size, invasion, recurrence and aggressiveness. The “X” axis represents the differentially expressed genes hierarchical cluster. (C) CACNA2D4 is upregulated in NR5A1-driven tumors; (D) EPHA4 is upregulated in TBX19-driven tumors; (E) SLIT1 is upregulated in POU1F1-driven tumors. Image was created using Partek Genomics Suite 7.19v (https://www.partek.com/partek-genomics-suite/).
Figure 2
Figure 2
(A) t-distributed stochastic neighbor embedding map (t-SNE) showing the identification of 13 cell clusters using unsupervised k-means clustering. Clusters were identified using hallmark gene expression for each cell type. (B) The heatmap depicts the differentially expressed genes (Y axis), among the different pituitary cell types (X axis). Stem cells have a distinct transcriptome, whereas the different pituitary cells cluster according to the transcription factor responsible for their terminal differentiation: the gonadotrope cluster (NR5A1-driven), the corticotrope and melanotrope cluster (TBX19-driven) and the somatotrope-lactotrope-thyrotrope cluster (POU1F1-driven). (CE) depict the distinctive pituitary cell populations expressing each of these transcription factors. (FH) show the expression of each of these transcription factors by the different types of pituitary adenomas: NRA5A1 highest expression occurs in CNFPA (gonadotropinomas and null cell), TBX19 highest expression is found in adrenocorticotropinomas and POU1F1 highest expression was observed in somatotrope, lactotrope and thyrotrope adenomas. Image was created using Partek Genomics Suite 7.19v (https://www.partek.com/partek-genomics-suite/) and Loupe Cell Browser (https://www.10xgenomics.com).
Figure 3
Figure 3
(A) Methylome PCA of the three pituitary adenoma clusters: POU1F1-driven somatotropinoma-thyrotropinoma-prolactinoma cluster; NR5A1-driven gonadotropinoma and null cell adenoma cluster; and TBX19-driven adrenocorticotropinoma cluster. Silent ACTH-adenomas segregated separately between TBX19-adenomas and NR5A1-adenomas. (B) Differentially methylated genes heatmap clustering POU1F1-derived adenomas, NR5A1-derived adenomas and TBX19-adenomas which split in two groups, one cluster next to POU1F1 adenomas and the second next to NR5A1 adenomas. The “Y” axis represents the tumor sample clustering according to WHO 2017 classification, as well as clinical features such as size, invasion, recurrence and aggressiveness, while the “X” axis represents the methylated regions hierarchical cluster. Image was created using Partek Genomics Suite 7.19v (https://www.partek.com/partek-genomics-suite/).
Figure 4
Figure 4
(AC) Dot blots of representative up regulated genes. EPHA4 in TBX19-derived tumors, CACNA2D4 in NR5A1-derived tumors and SLIT1 in POU1F1-derived tumors. (DF) Violin plots showing validation of gen up-regulation in each tumor group by RT-qPCR. Image was created using Partek Genomics Suite 7.19v (https://www.partek.com/partek-genomics-suite/).
Figure 5
Figure 5
Representative deregulated pathways in the TBX19-, POU1F1- and NR5A1-derived tumors. Altered cellular events cluster the tumors into the respective transcription factors they derive from. Silent ACTH tumors resemble the NR5A1-driven cells more than the TBX19-driven cells and therefore share molecular events common to both cell lineages. CA = control, non-tumoral gland, which has a PDS of 0; AC = GH tumors causing acromegaly; NC = clinically non-functioning null cell adenomas; CU = ACTH tumors causing Cushing’s disease; GO = gonadotropin tumors causing clinically non-functioning adenomas; SA = silent ACTH, clinically non-functioning tumors; PRL = prolactin-secreting prolactinomas; TI = TSH-secreting tumors or thyrotropinomas.
Figure 6
Figure 6
Dot blot plots of the deconvolution analysis showing the type of immune cell infiltration found in each tumor. Dendritic cells, CD4 + and CD8 + T lymphocytes as well as macrophages were among the most commonly found infiltrating immune cells. CA = control, non-tumoral gland; AC = GH tumors causing acromegaly; NC = clinically non-functioning null cell adenomas; CU = ACTH tumors causing Cushing’s disease; GO = gonadotropin tumors causing clinically non-functioning adenomas; SA = silent ACTH, clinically non-functioning tumors; PRL = prolactin-secreting prolactinomas; TI = TSH-secreting tumors or thyrotropinomas.

References

    1. Di Ieva A, et al. Aggressive pituitary adenomas—Diagnosis and emerging treatments. Nat. Rev. Endocrinol. 2014;10:423–435. doi: 10.1038/nrendo.2014.64. - DOI - PubMed
    1. Molitch M. Diagnosis and treatment of pituitary adenomas: A review. JAMA. 2017;317:516–524. doi: 10.1001/jama.2016.19699. - DOI - PubMed
    1. Nishioka H, Inoshita N. New WHO classification of pituitary adenomas (4th edition): Assessment of pituitary transcription factors and the prognostic histological factors. Brain Tumor Pathol. 2018;35:57–61. doi: 10.1007/s10014-017-0307-7. - DOI - PubMed
    1. Penn D, Burke W, Laws E. Management of non-functioning pituitary adenomas: Surgery. Pituitary. 2018;21:145–153. doi: 10.1007/s11102-017-0854-2. - DOI - PubMed
    1. Pepe S, Korbonits M, Lacovazzo D. Germline and mosaic mutations causing pituitary tumours: Genetic and molecular aspects. J. Endocrinol. 2019;240:R21–R45. doi: 10.1530/JOE-18-0446. - DOI - PubMed

Publication types

Substances