. 2020 Nov 9;10(1):19374.
doi: 10.1038/s41598-020-76600-6.

TBK1 regulates regeneration of pancreatic β-cells

Affiliations

TBK1 regulates regeneration of pancreatic β-cells

Yun-Fang Jia et al. Sci Rep. .

Abstract

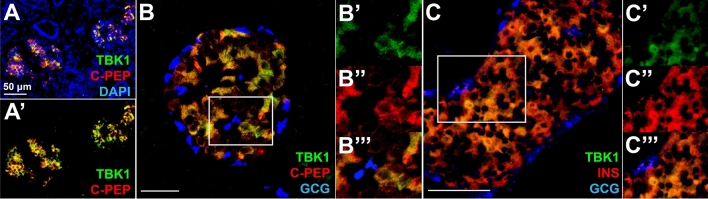
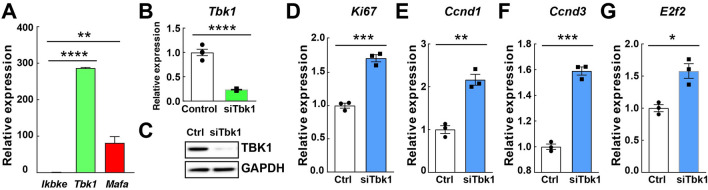
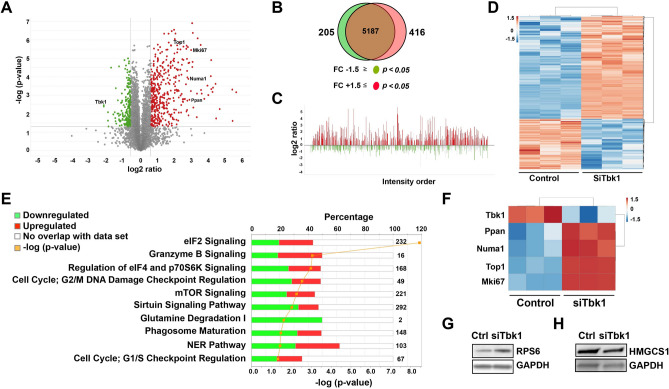
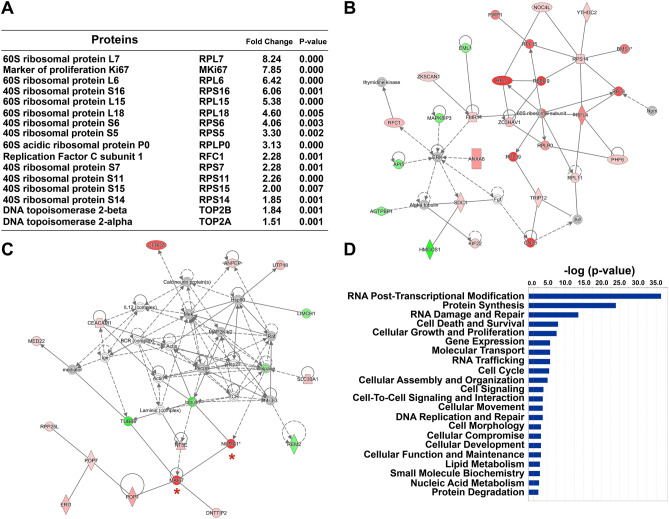
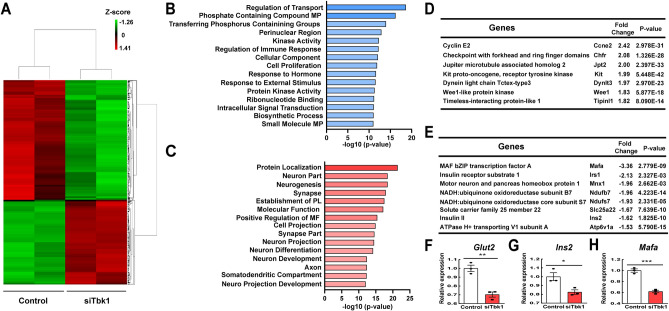
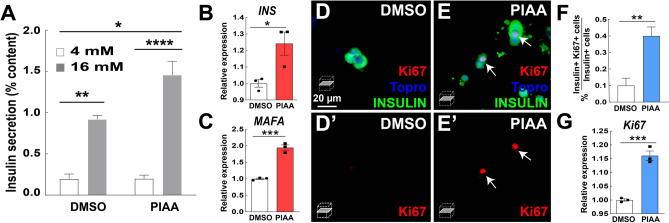
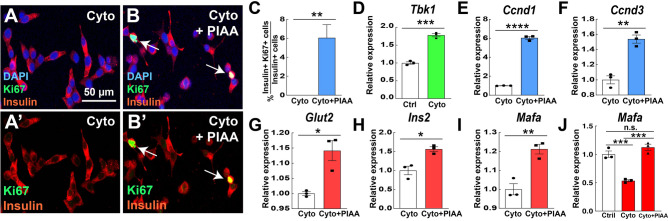
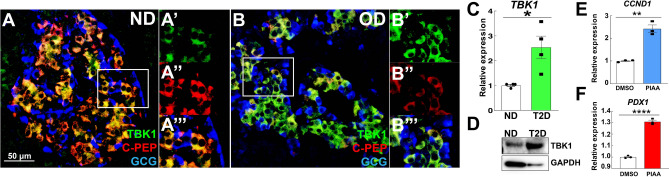
Small-molecule inhibitors of non-canonical IκB kinases TANK-binding kinase 1 (TBK1) and IκB kinase ε (IKKε) have shown to stimulate β-cell regeneration in multiple species. Here we demonstrate that TBK1 is predominantly expressed in β-cells in mammalian islets. Proteomic and transcriptome analyses revealed that genetic silencing of TBK1 increased expression of proteins and genes essential for cell proliferation in INS-1 832/13 rat β-cells. Conversely, TBK1 overexpression decreased sensitivity of β-cells to the elevation of cyclic AMP (cAMP) levels and reduced proliferation of β-cells in a manner dependent on the activity of cAMP-hydrolyzing phosphodiesterase 3 (PDE3). While the mitogenic effect of (E)3-(3-phenylbenzo[c]isoxazol-5-yl)acrylic acid (PIAA) is derived from inhibition of TBK1, PIAA augmented glucose-stimulated insulin secretion (GSIS) and expression of β-cell differentiation and proliferation markers in human embryonic stem cell (hESC)-derived β-cells and human islets. TBK1 expression was increased in β-cells upon diabetogenic insults, including in human type 2 diabetic islets. PIAA enhanced expression of cell cycle control molecules and β-cell differentiation markers upon diabetogenic challenges, and accelerated restoration of functional β-cells in streptozotocin (STZ)-induced diabetic mice. Altogether, these data suggest the critical function of TBK1 as a β-cell autonomous replication barrier and present PIAA as a valid therapeutic strategy augmenting functional β-cells.


Conflict of interest statement

The authors declare no competing interests.

Figures

Figure 1
Figure 1
TBK1 is specifically expressed in β-cells in adult human and mouse pancreatic islets. (AA′) Confocal images of adult human pancreatic tissues, stained for TBK1 (green), C-Peptide (red), and DAPI (blue). TBK1 is specifically expressed in β-cells in pancreatic islets. (BB′′′) Confocal images of adult human pancreatic islets, stained for TBK1 (green), C-Peptide (red), and Glucagon (blue), showing TBK1 expression in β-cells. Magnified images of a white square in (B) are shown in (B′–B′′′). N = 3 donors. (C) Confocal images of adult mouse pancreatic islets, stained for TBK1 (green), Insulin (red), and Glucagon (blue). TBK1 is specifically expressed in pancreatic β-cells. (C′–C′′′) Magnified images of TBK1 expression in β-cells (a white square in C). N = 3 mice. Scale bars: 50 µm.
Figure 2
Figure 2
Genetic silencing of Tbk1 in INS-1 832/13 rat β-cells increases β-cell proliferation. (A) Quantitative reverse transcription PCR (RT-qPCR) analysis of Tbk1, Ikbke, and Mafa in INS-1 832/13 β-cells. Quadruplicate. (B) RT-qPCR analysis of Tbk1 in siScramble (control)- and siTbk1-treated INS-1 832/13 β-cells. (C) Representative Western blot showing decreased TBK1 proteins levels in siTbk1-treated compared to control INS-1 832/13 β-cells. (DG) RT-qPCR analysis of proliferation gene Ki67 (D) and cell cycle regulators Ccnd1 (E), Ccnd3 (F), and E2f2 (G) in control and siTbk1-treated INS-1 832/13 β-cells. Gene expression was normalized to that of Gapdh and presented as fold changes (± SEM) against control expression. 3 sample sets per treatment, quadruplicate (B) or triplicate (DG) per each sample set. Unpaired two-tailed t-test. Asterisk indicates statistical significance: *P < 0.05; **P < 0.01; ***P < 0.001; ****P < 0.0001.
Figure 3
Figure 3
Ingenuity Pathway Analysis identifies top canonical pathways associated with significantly altered focus proteins in Tbk1-depleted INS-1 832/13 β-cells. (A) Volcano plot displaying the differential expression of proteins cross referenced with P value (y-axis; − log10) and log2 ratio (x-axis). Red and green colors identify at least ± 1.5 fold change and P < 0.05, which were defined as significantly altered focus proteins. (B) Venn diagram displaying downregulated (green) and upregulated (red) focus proteins in siTbk1-treated relative to siScramble-treated (control) cells. The overlapping brown area in the center of the Venn diagram indicates the number of identified proteins that did not meet focus protein criteria. (C) Proteins identified via mass spectrometry using MaxQuant, ordered from most abundant to least abundant. (D) Heat map of all focus proteins. (E) Ingenuity Pathway Analysis. Orange line indicates the p-value of association between reference and focus proteins for each pathway. Numbers on right of pathways indicate the total number of proteins associated with each designated pathway. Red and green indicates % of focus proteins upregulated and downregulated, respectively, in each matched pathway. (F) Heat map of several focus proteins important for cell cycle progression in control and Tbk1-depleted INS-1 832/13 β-cells. (G,H) Representative Western blot showing increased RPS6 (G) and decreased HMGCS1 (H) expression in siTbk1-treated compared to control INS-1 832/13 β-cells.
Figure 4
Figure 4
Proteomic analysis of Tbk1-depleted INS-1 832/13 β-cells displays changes in processes important for cell growth and proliferation. (A) Top focus proteins increased in Tbk1-depleted INS-1 832/13 β-cells. (B,C) Two of the top protein network interactomes generated from focus and reference proteins identified in siTbk1-treated relative to control β-cells, converging onto the assembly of 60S ribosomal subunit (B) and MKi67 (C; red asterisks). Red and green intensities indicate upregulated and downregulated protein expression, respectively. Gray indicates protein was detected but did not meet focus protein threshold criteria. Solid and dashed line indicate a direct or indirect interaction, respectively. (D) Comparison analysis of the top molecular and cellular functions associated with focus proteins in siTbk1-treated β-cells.
Figure 5
Figure 5
Transcriptome analysis of Tbk1-depleted INS-1 832/13 β-cells reveals a proliferative response and diminished maturity. (A) Heat map of the genes significantly altered upon Tbk1 depletion. At least ± 1.5 fold change and a false discovery rate (FDR) cutoff of < 0.05 as well as P < 0.05 are defined as significantly altered focus genes. (B,C) Gene ontology (GO) analysis showing pathways differentially upregulated (B) or downregulated (C) in siTbk1-treated as compared to control INS-1 832/13 β-cells. (D) List of genes showing prominent increase of expression upon Tbk1 depletion. (E) List of genes showing prominent decrease of expression upon Tbk1 depletion. (FH) RT-qPCR analysis of β-cell genes that confer mature features Glut2 (F), Ins2 (G), and Mafa (H) in control and SiTbk1-treated INS-1 832/13 β-cells. Gene expression was normalized to that of Gapdh and presented as fold changes (± SEM) against control expression. 3 sample sets per treatment, triplicate per each sample set. Unpaired two-tailed t-test. Asterisk indicates statistical significance: *P < 0.05; **P < 0.01; ***P < 0.001.
Figure 6
Figure 6
PIAA enhances proliferation and function of β-cells in non-diabetic human islets. (A) Glucose stimulated insulin secretion of human islets treated with DMSO or PIAA. Triplicate per condition from 3 cadaveric donors. (B,C) RT-qPCR analysis of β-cell genes that confer mature features INS (B) and MAFA (C) in DMSO- and PIAA-treated human islets. (DE′) Confocal single-plane images of human islets treated with DMSO (D,D′) and PIAA (E,E′), respectively, stained for Ki67 (red, white arrows), Topro (blue), and INSULIN (green). Scale bar: 20 μm. (F) The percentage (± SEM) of Ki67 and Insulin-double positive cells in human islets in DE′. An average of 1391 (vehicle) and 1335 (PIAA) insulin-positive cells were counted (five 96-wells/treatment). (G) RT-qPCR analysis of proliferation gene Ki67 in DMSO- and PIAA-treated human islets. Gene expression was normalized to that of GAPDH and presented as fold changes (± SEM) against control expression. 3 sample sets per treatment, triplicate per each sample set. 3 cadaveric donors. Two-way repeated measures ANOVA followed by Bonferroni’s multiple comparisons (A) and unpaired two-tailed t-test (B,C and F,G). Asterisk indicates statistical significance: *P < 0.05; **P < 0.01; ***P < 0.001; ****P < 0.0001.
Figure 7
Figure 7
PIAA augments proliferation and expression of cell cycle control molecules and β-cell differentiation markers in response to cytokine-induced diabetogenic challenge. (AC) Treatment of PIAA increased the number of Ki67 + Insulin + cells (white arrows; quantified in C). A minimum of 560 (cytokines) and 440 (cytokines plus PIAA) insulin-positive cells were counted (5 confocal fields/treatment). Scale bar: 50 μm. (D) RT-qPCR analysis of Tbk1 in control (non-treated) and cytokine-treated INS-1 832/13 β-cells. (EI) RT-qPCR analysis of cell cycle regulators Ccnd1 (E) and Ccnd3 (F), and β-cell genes that confer mature features Glut2 (G), Ins2 (H), and Mafa (I) in cytokine- and cytokine plus PIAA-treated INS-1 832/13 β-cells. (J) RT-qPCR analysis of Mafa in control (non-treated), cytokine-, and cytokine plus PIAA-treated INS-1 832/13 β-cells. Gene expression was normalized to that of Gapdh and presented as fold changes (± SEM) against control expression. 3 sample sets per treatment, triplicate per each sample set. Unpaired two-tailed t-test (CI) and one-way ANOVA (J). Asterisk indicates statistical significance: *P < 0.05; **P < 0.01; ***P < 0.001; ****P < 0.0001; n.s., not significant.
Figure 8
Figure 8
TBK1 expression is elevated in β-cells of patients with type 2 diabetes. (AB′′′) Confocal images of adult human pancreatic tissues [AA′′′: non-diabetic (ND); BB′′′: obese type 2 diabetic (OD)], stained for TBK1 (green), C-Peptide (red), and Glucagon (blue), showing higher TBK1 expression with lower levels of C-Peptide expression in β-cells of type 2 diabetic patients (N = 2 donors) than non-diabetic controls (N = 3 donors). Magnified images of TBK1 expression in β-cells (white squares in A and B) are shown in A′–A′′′ and B′–B′′′, respectively. Scale bar: 50 µm. (C) RT-qPCR analysis of TBK1 mRNA expression in non-diabetic controls (N = 4 donors) versus type 2 diabetic patients (N = 4 donors). Triplicate per donor. (D) Representative Western blot showing increased TBK1 expression in type 2 diabetic patient (N = 1 donor). (E,F) RT-qPCR analysis of cell cycle regulator CCND1 (E) and β-cell gene PDX1 (F) in vehicle- versus PIAA-treated type 2 diabetic islets. Triplicate (N = 1 donor). Gene expression was normalized to that of GAPDH and presented as fold changes (± SEM) against control expression; Unpaired two-tailed t test. Asterisks indicate statistical significance: *P < 0.05; **P < 0.01; ****P < 0.0001.

References

    1. Dor Y, Brown J, Martinez OI, Melton DA. Adult pancreatic beta-cells are formed by self-duplication rather than stem-cell differentiation. Nature. 2004;429:41–46. doi: 10.1038/nature02520. - DOI - PubMed
    1. Georgia S, Bhushan A. Beta cell replication is the primary mechanism for maintaining postnatal beta cell mass. J. Clin. Invest. 2004;114:963–968. doi: 10.1172/jci22098. - DOI - PMC - PubMed
    1. Meier JJ, et al. Beta-cell replication is the primary mechanism subserving the postnatal expansion of beta-cell mass in humans. Diabetes. 2008;57:1584–1594. doi: 10.2337/db07-1369. - DOI - PMC - PubMed
    1. Teta M, Long SY, Wartschow LM, Rankin MM, Kushner JA. Very slow turnover of beta-cells in aged adult mice. Diabetes. 2005;54:2557–2567. doi: 10.2337/diabetes.54.9.2557. - DOI - PubMed
    1. Perl S, et al. Significant human beta-cell turnover is limited to the first three decades of life as determined by in vivo thymidine analog incorporation and radiocarbon dating. J. Clin. Endocrinol. Metab. 2010;95:E234–239. doi: 10.1210/jc.2010-0932. - DOI - PMC - PubMed

Publication types