Review
. 2021 Feb;22(2):71-88.
doi: 10.1038/s41576-020-00292-x. Epub 2020 Nov 9.

Deciphering cell-cell interactions and communication from gene expression

Affiliations
Review

Deciphering cell-cell interactions and communication from gene expression

Erick Armingol et al. Nat Rev Genet. 2021 Feb.

Abstract

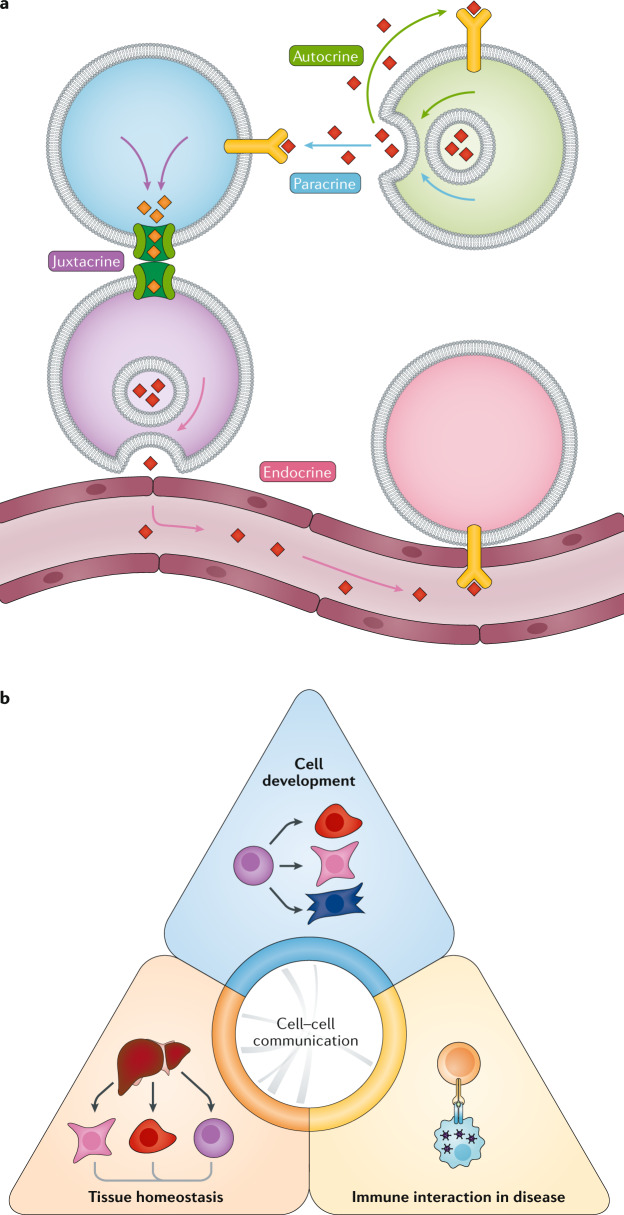
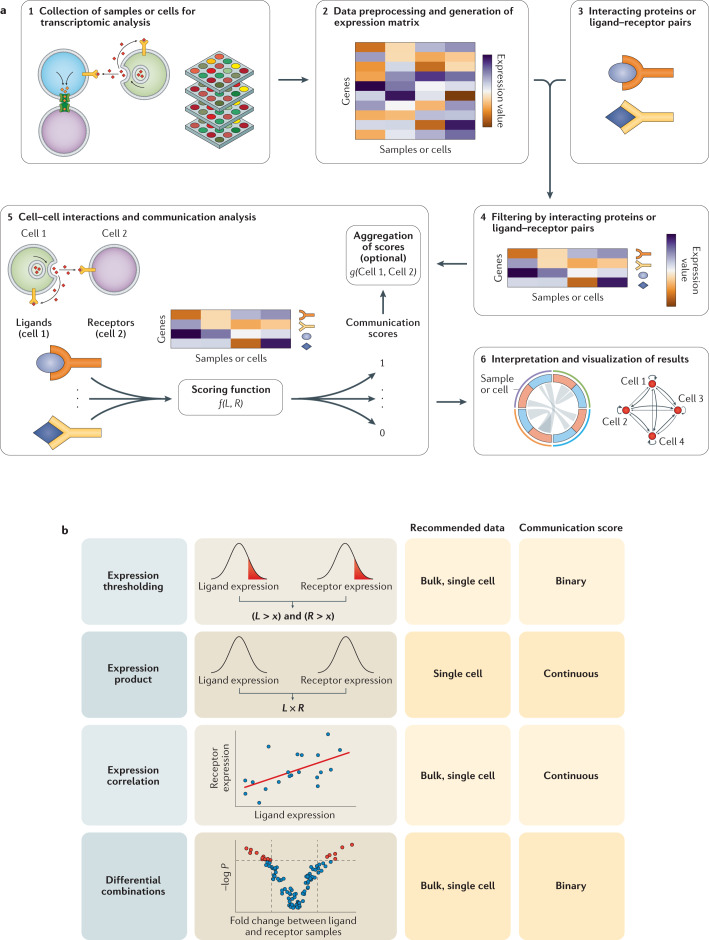
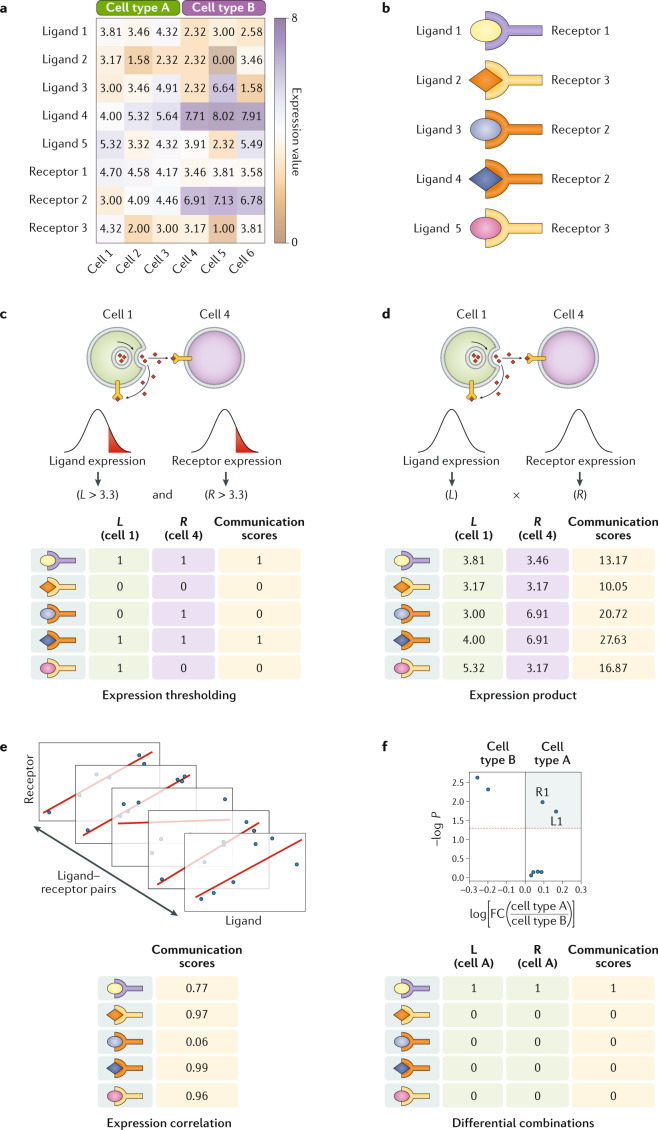
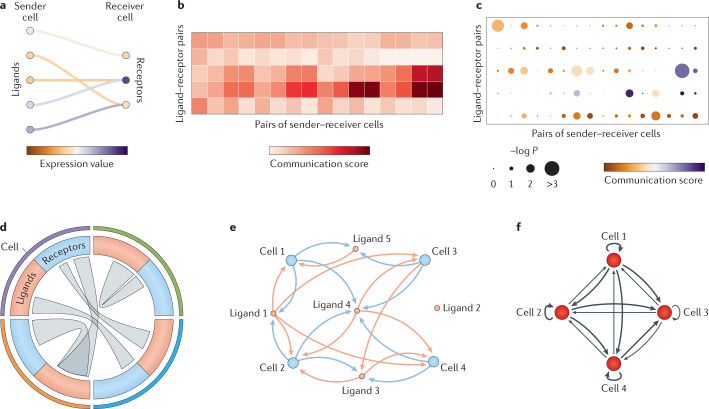
Cell-cell interactions orchestrate organismal development, homeostasis and single-cell functions. When cells do not properly interact or improperly decode molecular messages, disease ensues. Thus, the identification and quantification of intercellular signalling pathways has become a common analysis performed across diverse disciplines. The expansion of protein-protein interaction databases and recent advances in RNA sequencing technologies have enabled routine analyses of intercellular signalling from gene expression measurements of bulk and single-cell data sets. In particular, ligand-receptor pairs can be used to infer intercellular communication from the coordinated expression of their cognate genes. In this Review, we highlight discoveries enabled by analyses of cell-cell interactions from transcriptomic data and review the methods and tools used in this context.


Conflict of interest statement

The authors declare no competing interests.

Figures

Fig. 1
Fig. 1. Types and applications of cell–cell interactions and communication.
a | ‘Autocrine signalling’ refers to intracellular communication whereby cells secrete ligands that are used to induce a cellular response through cognate receptors for those molecules expressed on the same cell. Paracrine cell–cell communication does not require cell–cell contact, rather depending on the diffusion of signalling molecules from one cell to another after secretion. Juxtacrine, that is, contact-dependent, cell–cell communication relies on gap junctions or other structures such as membrane nanotubes to pass signalling molecules directly between cells, without secretion into the extracellular space. Endocrine cell–cell communication represents intercellular communication whereby signalling molecules are secreted and travel long distances through extracellular fluids such as the blood plasma; typical mediators of this communication are hormones. b | Overview of the main applications of cell–cell interaction methods: cell development, tissue and organ homeostasis, and immune interactions in disease (for more details on each study type, see Supplementary Table 1).
Fig. 2
Fig. 2. Analysis workflow for inferring cell–cell interactions and communication from gene expression.
a | Samples or cells are analysed by transcriptomics to measure the expression of genes (step 1). Then the data generated are preprocessed to build a gene expression matrix, which contains the transcript levels of each gene across different samples or cells (step 2). A list of interacting proteins that are involved in intercellular communication is generated or obtained from other sources (step 3), often including interactions between secreted and membrane-bound proteins (commonly ligands and receptors, respectively). Only the genes associated with the interacting proteins are held in the gene expression matrix (step 4). Their expression levels are used as inputs to compute a communication score for each ligand–receptor pair using a scoring function (function f(L, R), where L and R are the expression values of the ligand and the receptor, respectively). These communication scores may be aggregated to compute an overall state of interaction between the respective samples or cells using an aggregation function (function g(Cell 1, Cell 2), where Cell 1 and Cell 2 are all communication scores of those cells or corresponding samples) (step 5). Finally, communication and aggregated scores can be represented by, for instance, Circos plots and network visualizations to facilitate the interpretation of the results (step 6). b | Main scoring functions of communication pathways based on the expression of their components. Recommended data to use with these functions and the type of their resulting communication score are indicated.
Fig. 3
Fig. 3. Toy examples of using core functions to compute communication scores.
Two primary inputs are used for quantifying communication scores: a preprocessed gene expression matrix (part a) and a list of interacting proteins to supervise the analysis (for example, ligand–receptor pairs) (part b). Then a communication score (CS) can be computed for every ligand–receptor pair in a given pair of cells. Here, we show how to perform these calculations for four core functions (parts cf). These are applied to elucidate paracrine (parts c,d) and autocrine (parts e,f) communication. To assess cell–cell communication, a CS can be computed for each ligand–receptor pair by accounting for the presence of both partners if their expression is greater than a given threshold, which for demonstrative purposes was set arbitrarily to a value of 3.3 (part c), or by multiplying their expression values (part d). Similarly, the CS for each ligand–receptor pair can be the correlation score obtained from their expression across all cell types for autocrine communication (part e). To reveal non-autocrine interactions, the correlation can be computed across pairs of different cells. Particular signatures of each cell type can be extracted through analysing differentially expressed ligands and receptors. Using the cell type-specific differentially expressed genes, we can assign a binary CS and study the ligand–receptors used for autocrine communication (part f). In this example, autocrine communication is evaluated for cell type A by using its differentially expressed genes with respect to cell type B (cell type A-specific genes are located in the coloured quadrant). Analogously to the correlation score, for non-autocrine communication we would need to consider differentially expressed genes in each of the cell types or samples. For a given pair of cells, we can say that a communication pathway is active when the ligand is differentially expressed in one cell and its cognate receptor is differentially expressed in the other. FC, fold change.
Fig. 4
Fig. 4. Common visualization techniques for cell–cell interactions and communication.
a | A Sankey diagram for connecting key ligands from a sender cell to cognate receptors in the receiver cell. Node colour (ligand or receptor) indicates the expression level. b | Heatmap to represent the communication scores for each ligand–receptor interaction in each cell pair. c | Dot plot to show the communication score (colour of dots) and at the same time its significance (size), often obtained from a statistical model or permutation analysis. d | Circos plot or chord diagram to show key communication pathways used by different cell types to communicate. The links start from a ligand (red) and end in a receptor (blue), which are grouped for each cell type (coloured outer arcs). e | Bipartite network where nodes can be either cells or ligands. Edges can be directed only from a cell to a ligand it produces or from a ligand to a cell that expresses its cognate receptor. f | Cell–cell interaction network to represent the potential of cells to interact. Nodes correspond to cells and edges correspond to their interactions. These are directed from a sender cell to a receiver cell, and their thicknesses are proportional to the respective global cell–cell communication scores (for example, number of active ligand–receptor pairs).

References

    1. Zhou X, et al. Circuit design features of a stable two-cell system. Cell. 2018;172:744–757.e17. - PMC - PubMed
    1. Rouault H, Hakim V. Different cell fates from cell-cell interactions: core architectures of two-cell bistable networks. Biophys. J. 2012;102:417–426. - PMC - PubMed
    1. Bonnans C, Chou J, Werb Z. Remodelling the extracellular matrix in development and disease. Nat. Rev. Mol. Cell Biol. 2014;15:786–801. - PMC - PubMed
    1. Bich L, Pradeu T, Moreau J-F. Understanding multicellularity: the functional organization of the intercellular space. Front. Physiol. 2019;10:1170. - PMC - PubMed
    1. Rao VS, Srinivasa Rao V, Srinivas K, Sujini GN, Sunand Kumar GN. Protein-protein interaction detection: methods and analysis. Int. J. Proteom. 2014;2014:1–12. - PMC - PubMed

Publication types