. 2020 Nov;2(11):1350-1367.
doi: 10.1038/s42255-020-00306-2. Epub 2020 Nov 9.

c-Rel orchestrates energy-dependent epithelial and macrophage reprogramming in fibrosis

Affiliations

c-Rel orchestrates energy-dependent epithelial and macrophage reprogramming in fibrosis

Jack Leslie et al. Nat Metab. 2020 Nov.

Erratum in

  • Author Correction: c-Rel orchestrates energy-dependent epithelial and macrophage reprogramming in fibrosis.
    Leslie J, Macia MG, Luli S, Worrell JC, Reilly WJ, Paish HL, Knox A, Barksby BS, Gee LM, Zaki MYW, Collins AL, Burgoyne RA, Cameron R, Bragg C, Xu X, Chung GW, Brown CDA, Blanchard AD, Nanthakumar CB, Karsdal M, Robinson SM, Manas DM, Sen G, French J, White SA, Murphy S, Trost M, Zakrzewski JL, Klein U, Schwabe RF, Mederacke I, Nixon C, Bird T, Teuwen LA, Schoonjans L, Carmeliet P, Mann J, Fisher AJ, Sheerin NS, Borthwick LA, Mann DA, Oakley F. Leslie J, et al. Nat Metab. 2021 Jan;3(1):118-119. doi: 10.1038/s42255-020-00326-y. Nat Metab. 2021. PMID: 33303984 No abstract available.

Abstract

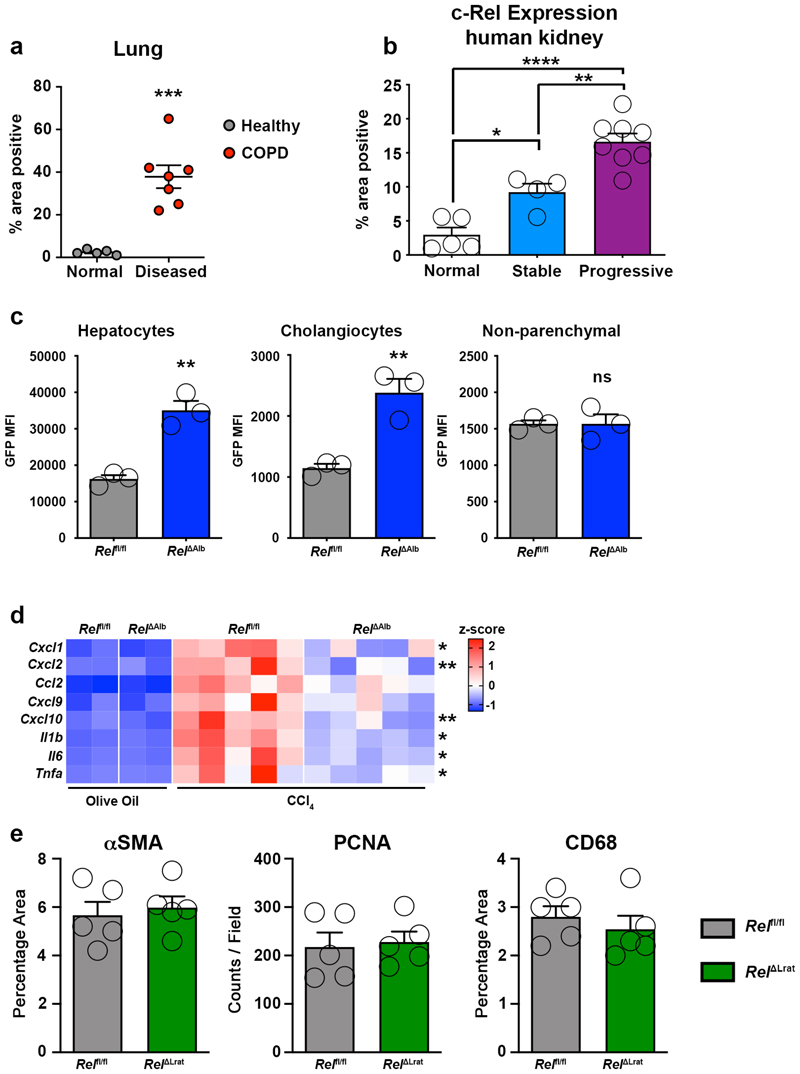
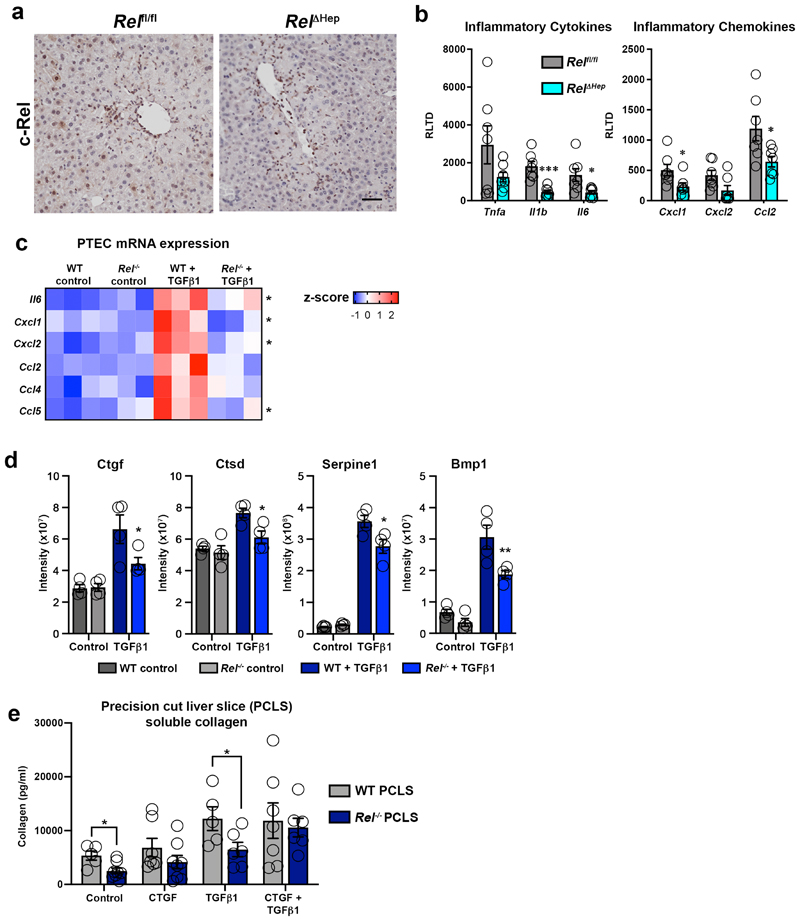
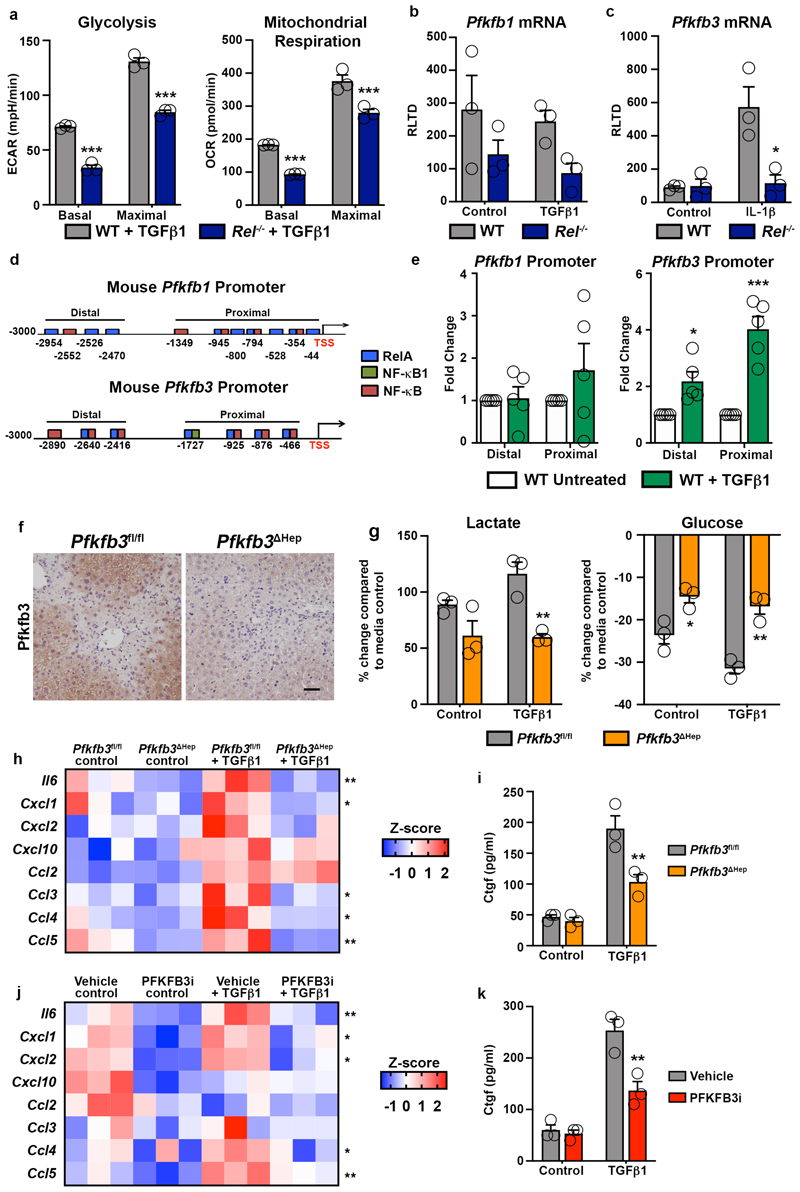
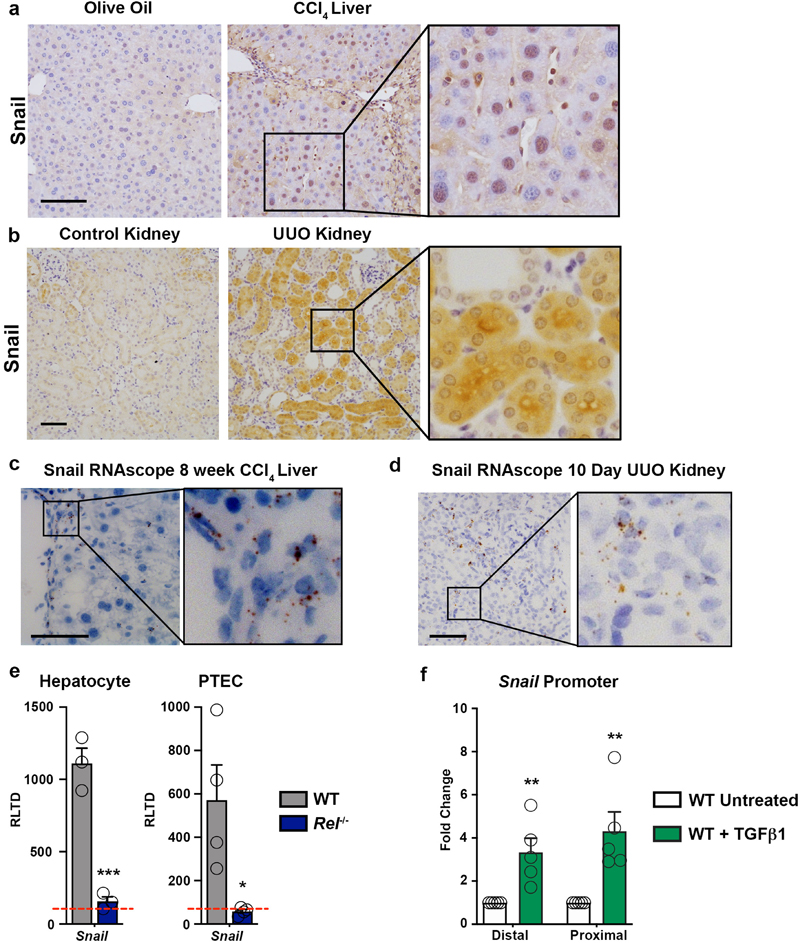
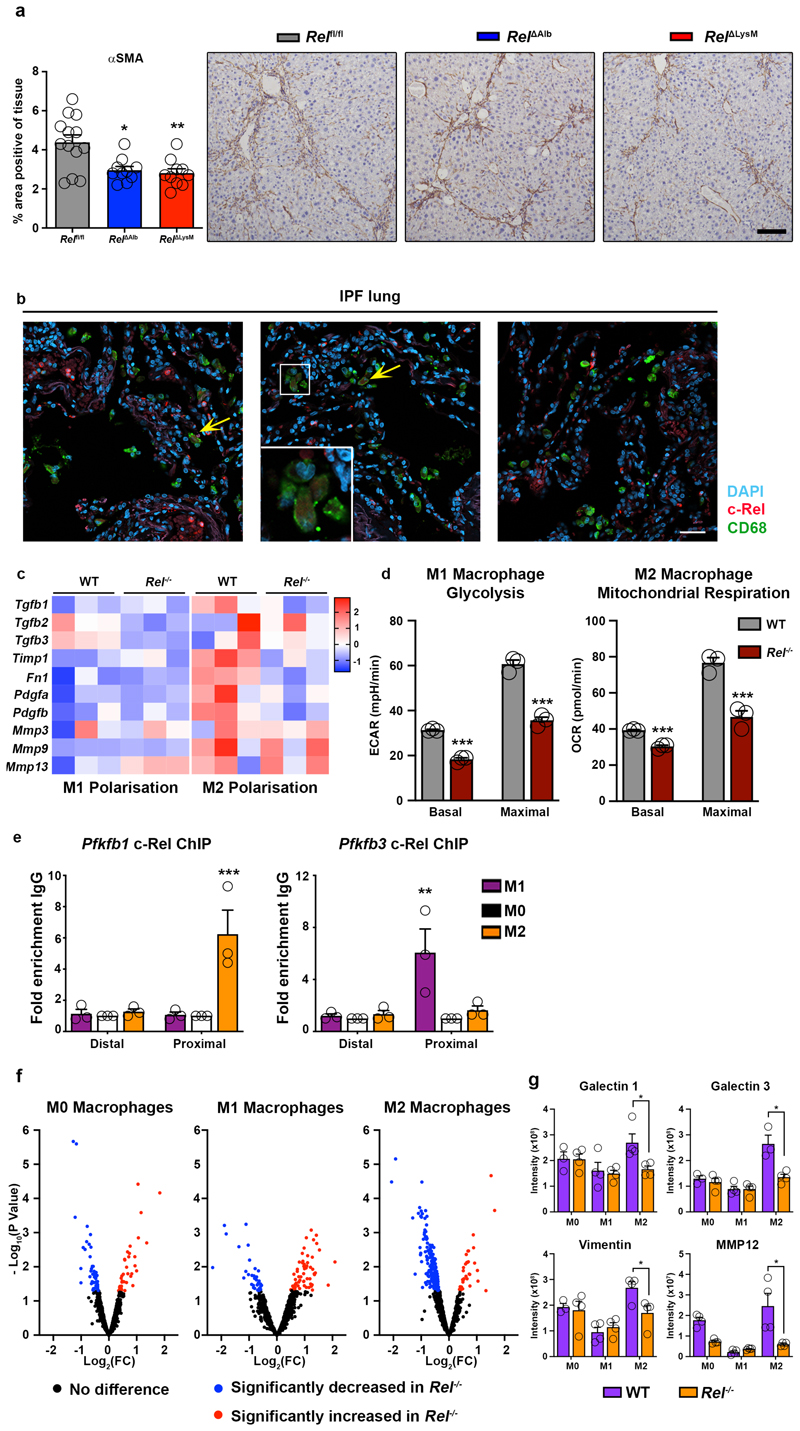
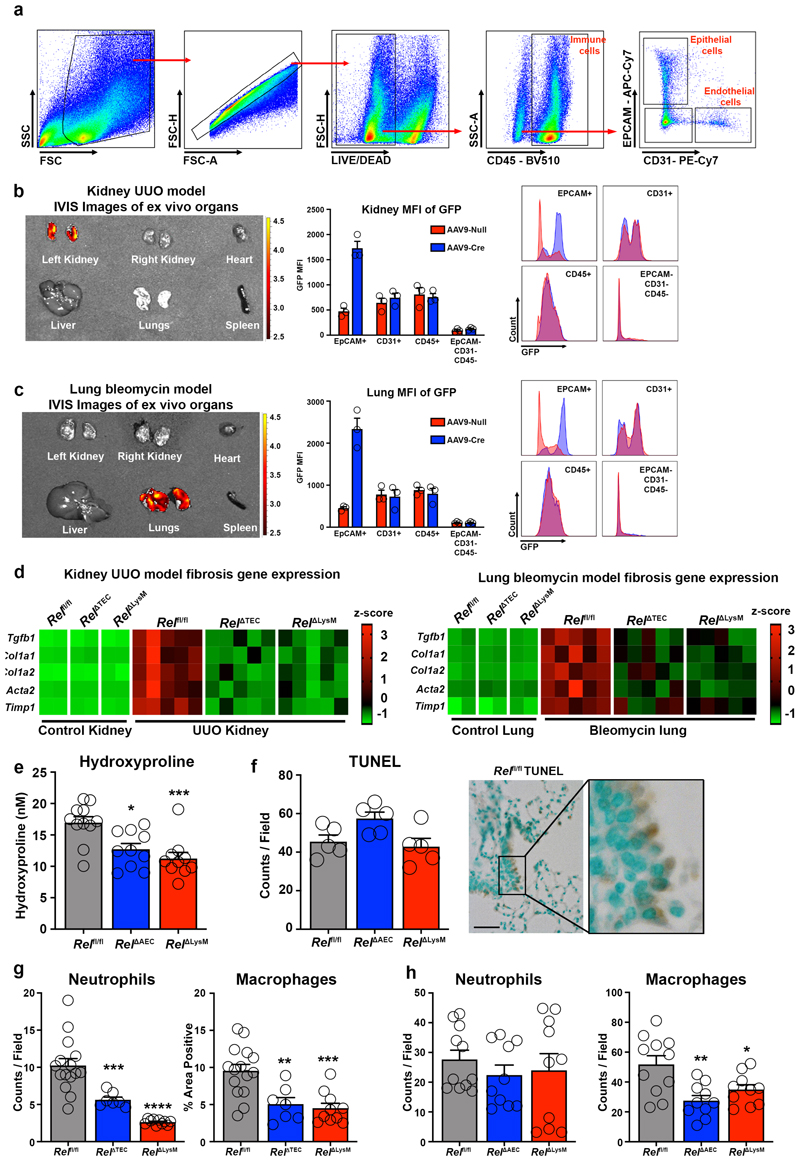
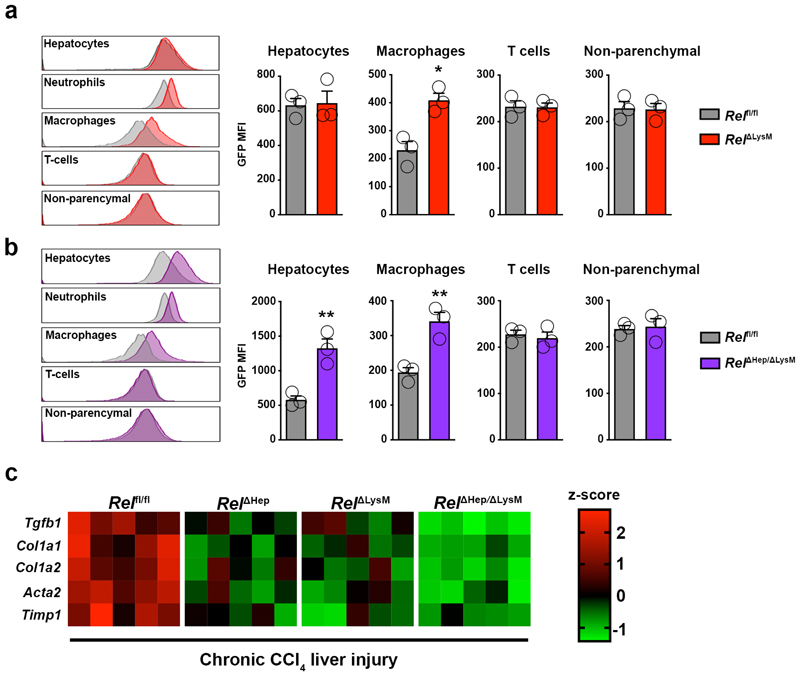
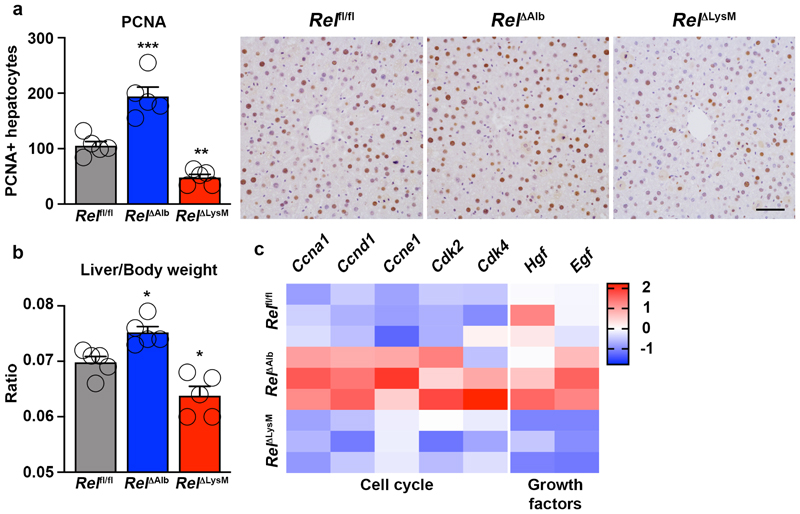
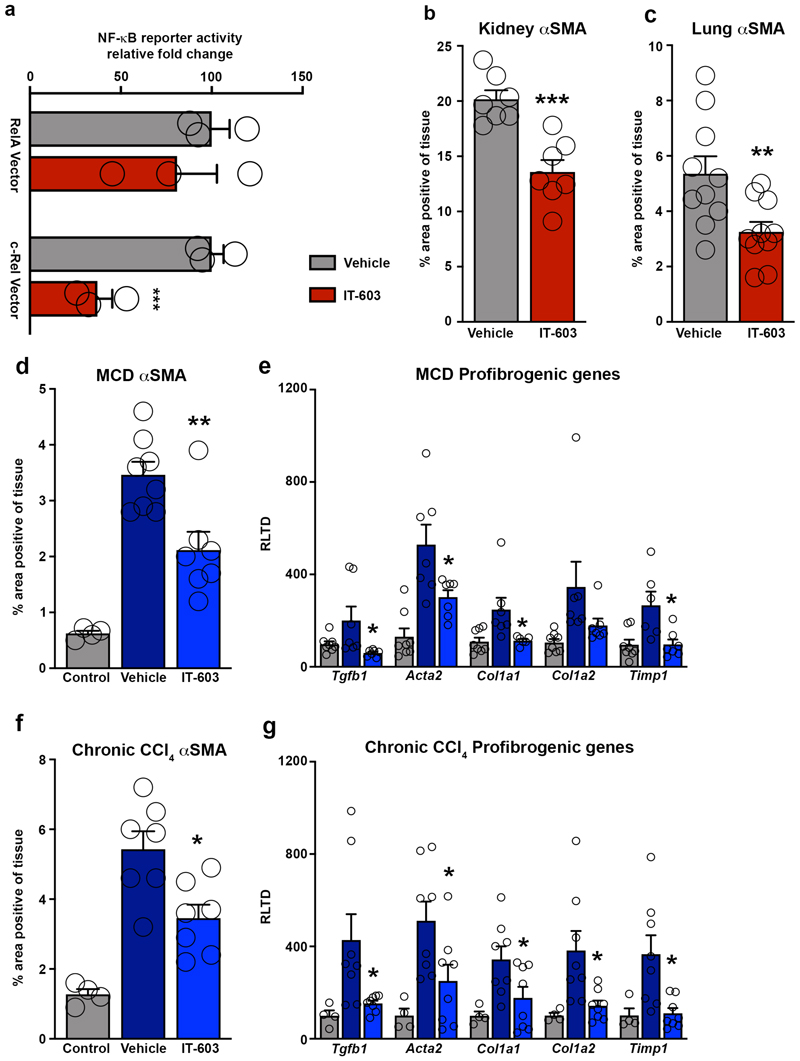
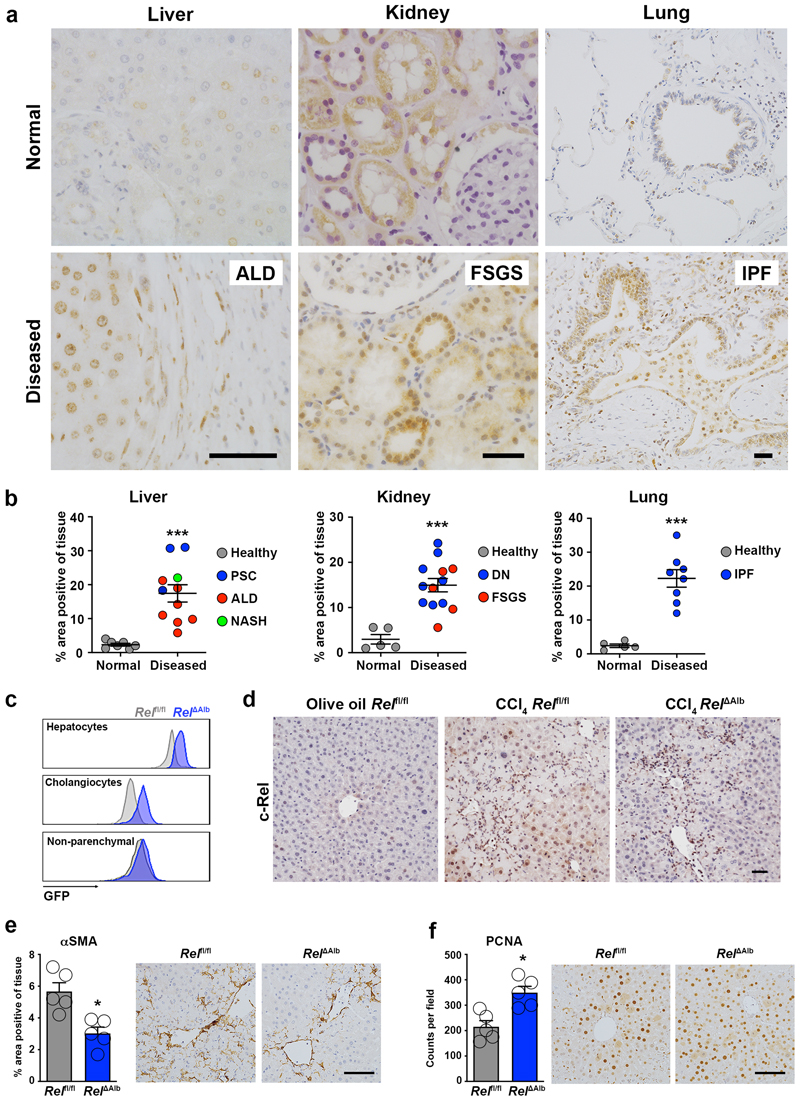
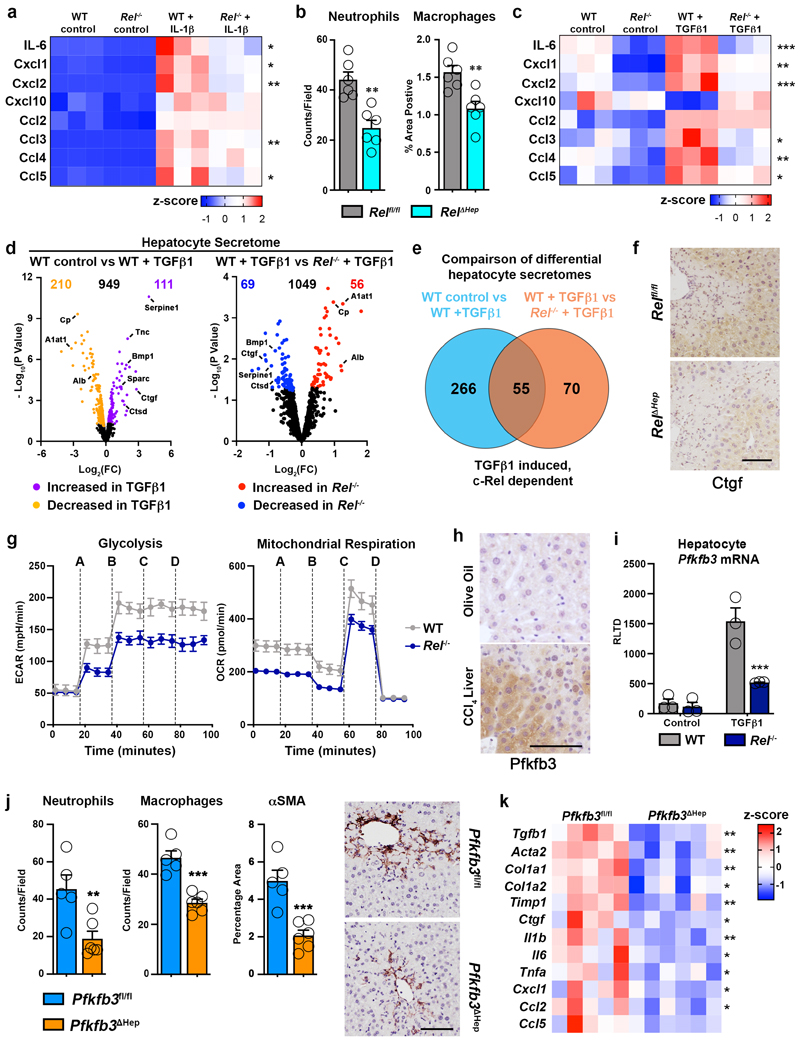
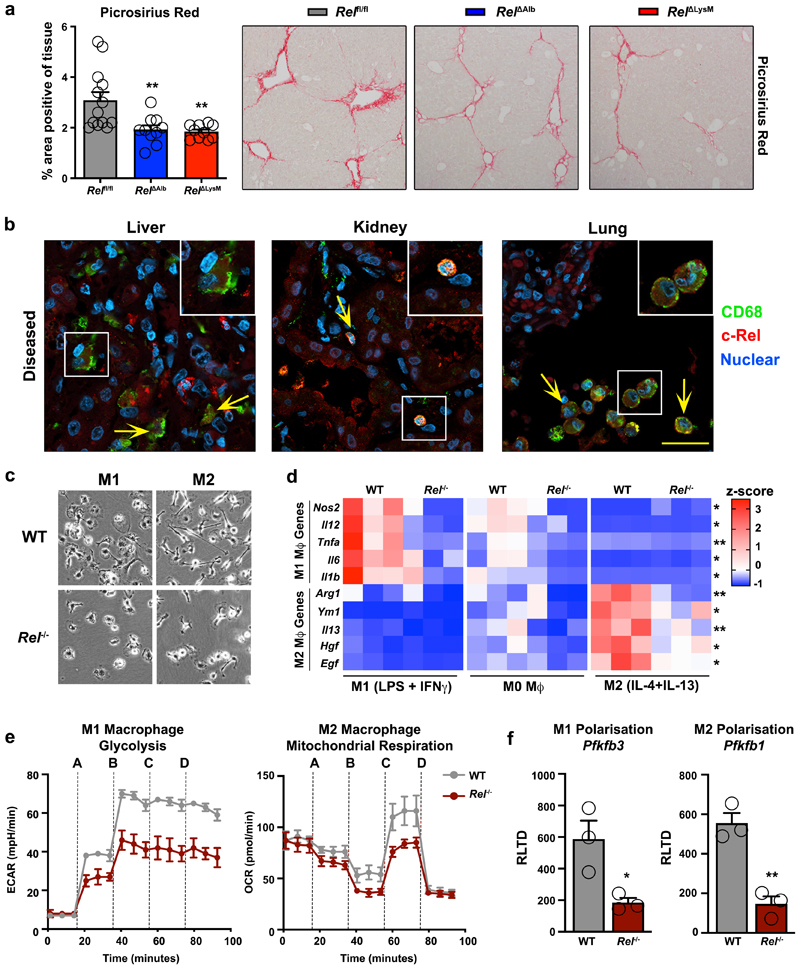
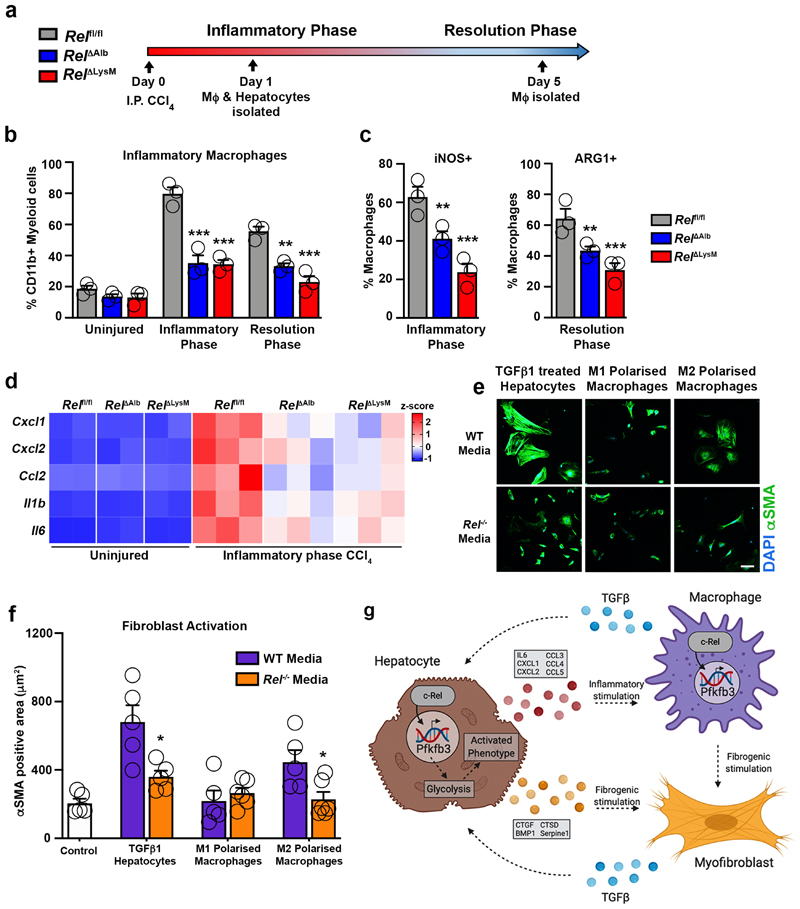
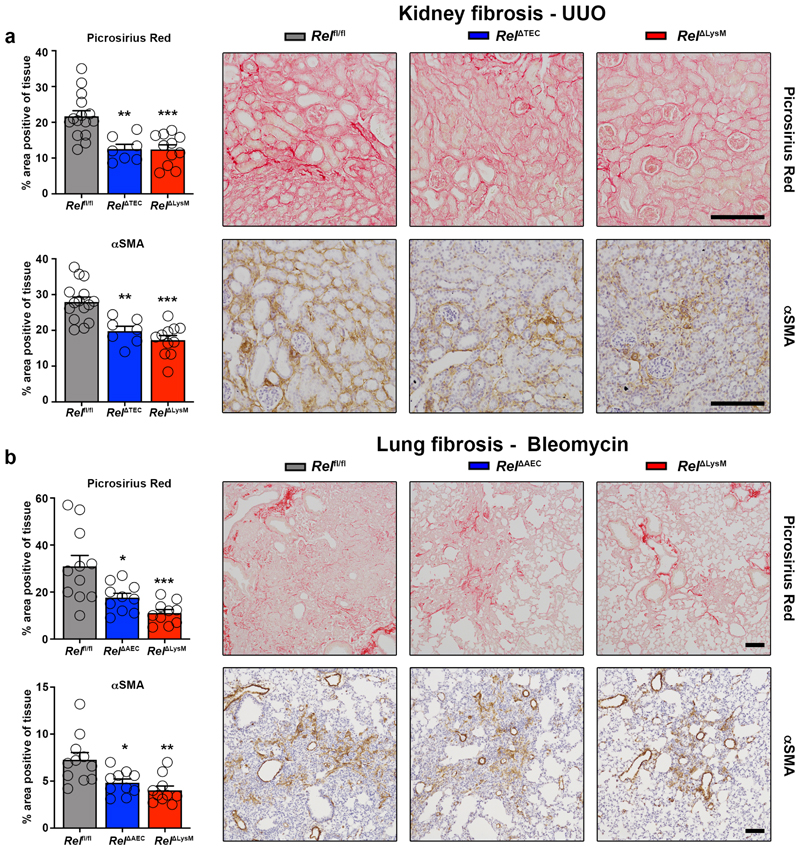
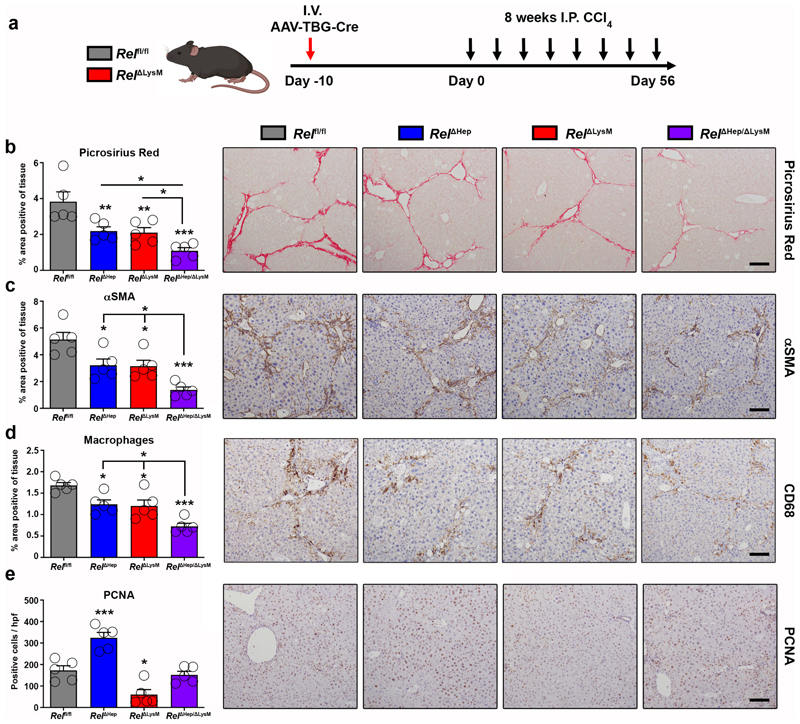
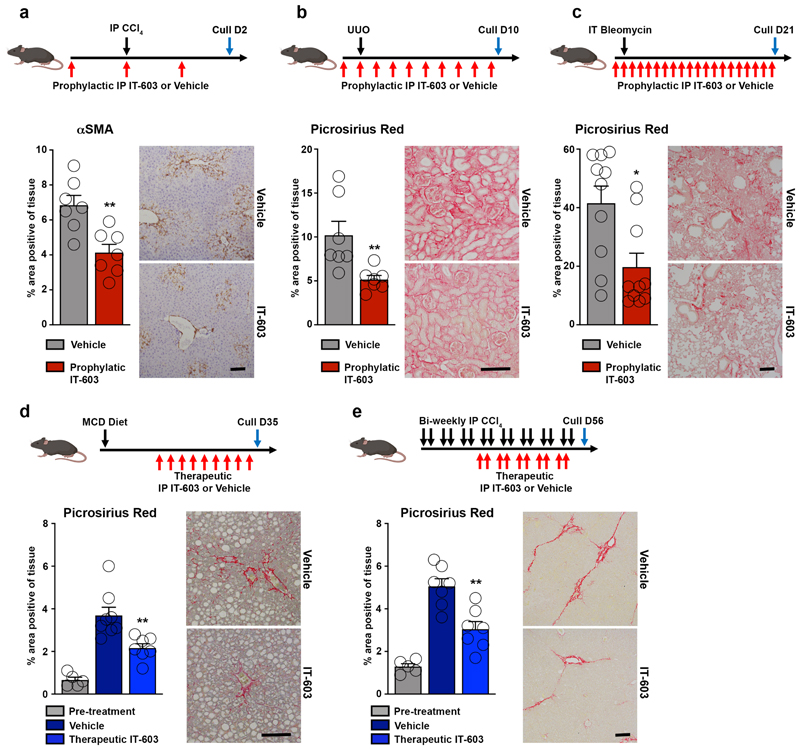
Fibrosis is a common pathological feature of chronic disease. Deletion of the NF-κB subunit c-Rel limits fibrosis in multiple organs, although the mechanistic nature of this protection is unresolved. Using cell-specific gene-targeting manipulations in mice undergoing liver damage, we elucidate a critical role for c-Rel in controlling metabolic changes required for inflammatory and fibrogenic activities of hepatocytes and macrophages and identify Pfkfb3 as the key downstream metabolic mediator of this response. Independent deletions of Rel in hepatocytes or macrophages suppressed liver fibrosis induced by carbon tetrachloride, while combined deletion had an additive anti-fibrogenic effect. In transforming growth factor-β1-induced hepatocytes, c-Rel regulates expression of a pro-fibrogenic secretome comprising inflammatory molecules and connective tissue growth factor, the latter promoting collagen secretion from HMs. Macrophages lacking c-Rel fail to polarize to M1 or M2 states, explaining reduced fibrosis in RelΔLysM mice. Pharmacological inhibition of c-Rel attenuated multi-organ fibrosis in both murine and human fibrosis. In conclusion, activation of c-Rel/Pfkfb3 in damaged tissue instigates a paracrine signalling network among epithelial, myeloid and mesenchymal cells to stimulate fibrogenesis. Targeting the c-Rel-Pfkfb3 axis has potential for therapeutic applications in fibrotic disease.


Conflict of interest statement

Competing interests: F.O, D.A.M, J.M, L.A.B are directors of Fibrofind limited. J.L, H.P, F.O, D.A.M, J.M, L.A.B are shareholders in Fibrofind limited. C.B.N is shareholder in GSK. M.K is a stock owner of Nordic Bioscience.

Figures

Extended Data Fig. 1
Extended Data Fig. 1. c-Rel correlates with disease progression in chronic kidney disease and is elevated in chronic lung disease. Investigation of the cell specific actions of c-Rel in preclinical models of liver injury
(a) Graph showing average percentage area of c-Rel stained tissue in (n=5) normal lung and (n=7) chronic obstructive pulmonary disorder (COPD) (P value = 0.0003). (b) Graph showing average percentage area of c-Rel stained tissue in (n=5) normal human kidney and patients with stable (n=4, p value =0.0185) or progressive kidney disease (n=8, p value = 0.003). Normal vs progressive p value <0.0001) (c) Graphs showing the Mean Fluorescence Intensity (MFI) of GFP in hepatocytes (p value = 0.0026), Cholangiocytes (EPCAM+, p value = 0.0026) and non-parenchymal (EPCAM-) cells from the livers of Relfl/fl and RelΔAlb mice. Data are mean ± s.e.m of 3 mice/group. (d) Heatmap showing gene expression of Cxcl1, Cxcl2, Ccl2, Cxcl9, Cxcl10, Il1b, Il6 and Tnfα in olive oil vehicle control and acute CCl4 injured Relfl/fl and RelΔAlb mice. Asterisk denotes significance between CCl4 injured Relfl/fl and RelΔAlb mice; there is no significant difference between olive oil treated groups. (e) Histological assessment of αSMA, PCNA and CD68 stained liver sections in acute CCl4 injured Relfl/fl and RelΔLrat mice. Data in graphs are mean ± s.e.m of n=5. (a, c, e) P values were calculated using unpaired two-sided T test. (b) P value was calculated using a one-way ANOVA with Tukey post-hoc t-test (* P <0.05, ** P <0.01, *** P <0.001 and **** P <0.0001).
Extended Data Fig. 2
Extended Data Fig. 2. c-Rel regulates epithelial dedifferentiation and fibrogenic gene expression.
(a) Representative images of c-Rel staining in CCl4 injured Relflfl and RelΔHep mice. Representative of n=7 mice/group. Scale bar represents 100(m. (b) Graph shows mRNA levels of inflammatory cytokines Tnfa, Il1b (p=0.00038) and Il6(p value = 0.022)and the inflammatory chemokines Cxcl1 (p value = 0.0034), Cxcl2 (p=0.054) and Ccl2 (p=0.0029), in CCl4 injured livers of Relfl/fl and RelΔHep mice. Data are mean ± s.e.m of 7 mice/group. (c) Heatmap showing relative mRNA expression of Il-6, Cxcl1, Cxcl2, Ccl2, CCl4 and Ccl5 in WT and Rel-/- proximal tubular epithelial cells (PTEC) stimulated with or without TGFβ1. (d) Graphs show relative levels of Ctgf (p value = 0.034), Ctsd (p= 0.039), Serpine1 (p=0.04) and Bmp1 (p=0.0054) protein expressed as Intensity in control and TGFβ1 treated WT and Rel-/- hepatocytes. Data are from 4 independent cell isolations/group. (e) Quantification of soluble collagen (pg/ml) released from precision cut liver slices (PCLS) generated from WT and Rel-/- liver, stimulated ± TGFβ1 ± CTGF where (control p value = 0.012 and TGFβ1 p value = 0.045). Data are from PCLS generated 3 different donors/genotype. (b,d) P values were calculated using unpaired two-sided t-test. (d) P values were calculated using the R package LIMMA (* P <0.05, ** P <0.01 and ***P<0.001).
Extended Data Fig. 3
Extended Data Fig. 3. c-Rel regulates metabolic enzymes to induce epithelial dedifferentiation and fibrogenic gene expression.
(a) Seahorse analysis of basal (p<0.0001) and maximal (p<0.0001) glycolysis (extracellular acidification rate, ECAR) and basal (p<0.0007) and maximal (p<0.0004) mitochondrial respiration (oxygen consumption rate, OCR) in WT and Rel-/- hepatocytes stimulated ± TGFβ1. (b) Graph shows mRNA expression of Pfkfb1 in WT and Rel-/- hepatocytes stimulated ± TGFβ1. (c) Graph shows mRNA expression of Pfkfb3 in WT and Rel-/- hepatocytes stimulated ± IL-1β. (p value=0.025) (d) Schematic representation of RelA, NF-κB1 and NF-κB binding sites in the murine Pfkfb1 and Pfkfb3 promoters. (e) ChIP analysis of c-Rel at the proximal and distal regions of the Pfkfb1 promoter and the proximal (p<0.0001) and distal (p=0.0185) regions of the Pfkfb3 promoter in WT hepatocytes treated ± TGFβ1. (f) Representative images show PFKFB3 immunohistochemical staining in liver sections from acute CCl4 injured Pfkfb3flfl and Pfkfb3 Δhep mice. Images are representative of n=5 mice/group. Scale bar is 100(m. (g) Graphs show media lactate in control and TGFβ1 (p=0.0064) stimulated and glucose levels in control (p=0.0227) and TGFβ1 (p=0.00284) stimulated in hepatocytes isolated from Pfkfb3flfl and Pfkfb3 Δhep mice and stimulated ± TGFβ1. (h) Heatmap showing secreated Il-6, Cxcl1, Cxcl2, Cxcl10, Ccl2, Ccl3, CCl4 and Ccl5, measured by MSD in the media of hepatocytes isolated from Pfkfb3flfl and Pfkfb3Δhep mice and stimulated ± TGFβ1. (i) Quantification of connective tissue growth factor (CTGF) in pg/ml in the culture media of hepatocytes isolated from Pfkfb3flfl and Pfkfb3Δhep mice and stimulated ± TGFβ1 (p=0.0027) (j) Heatmap showing secreated Il-6, Cxcl1, Cxcl2, Cxcl10, Ccl2, Ccl3, CCl4 and Ccl5, measured by MSD in the media of WT hepatocytes stimulated ± TGFβ1 ± the Pfkfb3 inhibitor 3PO. (k) Quantification of connective tissue growth factor (CTGF) in pg/ml in the culture media of WT hepatocytes stimulated ± TGFβ1 ± the Pfkfb3 inhibitor 3PO (p=0.0013). Data in graphs are mean ± s.e.m. in n=3 (g,i,k), n=4 (a,b,c) or n=5 (e) independent cell isolations/condition. All p values were calculated using a two-way ANOVA with Tukey post-hoc t-test (* P <0.05, ** P <0.01 and *** P <0.001).
Extended Data Fig. 4
Extended Data Fig. 4. c-Rel dependent Snail regulation in chronic liver and kidney disease
(a) Representative images show expression of Snail in normal and chronic CCl4 injured liver. (b) Representative images show Snail in normal and UUO injured kidney. (c) Representative images of Snail transcript in epithelial cells detected by RNAScope in fibrotic chronic CCl4 injured fibrotic mouse liver. (d) Representative images of Snail transcript in epithelial cells detected by RNAScope in fibrotic UUO mouse kidney. All representative images are representative of n=5 mice/group. (a-b) Scale bars equal 100 microns (c-d) Scale bars equal 50 microns. (e) Graph showing mRNA levels of Snail in TGFβ1 treated hepatocytes (p=0.0001) and proximal tubular epithelial cells (PTEC) (p=0.02) isolated from WT and Rel-/- mice. Data in graphs are mean ± s.e.m. in n=3 independent cell isolations. (f) Graph showing ChIP analysis of c-Rel binding to distal (p=0.0074) and proximal (p=0.0063) regions of the Snail promoter in WT hepatocytes stimulated ± TGFβ1. Data in graphs are mean ± s.e.m. in n=5 independent cell isolations. P values were calculated using unpaired two-sided t-test (e) and a ratio paired t-test (f) (* P <0.05, ** P <0.01 and *** P <0.001).
Extended Data Fig. 5
Extended Data Fig. 5. c-Rel regulates macrophages polarisation to drive tissue fibrosis.
(a) Histological assessment and representative images of αSMA stained liver sections in acute CCl4 injured in (n=13) Relflfl, (n=7) RelΔAlb (p=0.0116), and (n=10) Rel ΔLysM (p=0.0051) mice. Data are mean ± s.e.m. Scale bar equals 100 microns. P values were calculated using a one-way ANOVA with Tukey post- hoc t-test. (b) Representative low power immuno-fluorescence images show c-Rel (red), CD68 (green) and nuclear (blue) staining in diagnosed idiopathic pulmonary fibrosis lung sections. Yellow arrows denote co-localisaton of c-Rel and CD68. Scale bar equals 50 microns. Images are representative of n=8 IPF stained sections. (c) Heat map showing relative mRNA expression of fibrogenic markers; Tgfb1, Tgfb2, Tgfb3, TIMP1, Fn1, Pdgfa, Pdgfb, Mmp3, Mmp9 and Mmp13 in M1 and M2 polarised WT and Rel-/- BMDMs. (d) Graphs show, seahorse analysis of basal (p<0.0001) and maximal (p=0.0004) glycolysis (extracellular acidification rate, ECAR) and basal (p=0.0002) and maximal (p=0.0024) mitochondrial respiration (oxygen consumption rate, OCR) in M1 and M2 polarised WT and Rel-/- BMDMs. Data are mean ± s.e.m. from 3 independent cell isolations/group. (e) ChIP analysis of c-Rel binding to distal and proximal (p=0.004) regions of the Pfkfb3 promoter and to distal and proximal (p=0.003) regions of the Pfkfb1 promoters in WT BMDM in response to M1 and M2 polarisation. Data are mean ± s.e.m. from 3 independent cell isolations/group. (d-e) P values were calculated using two-way ANOVA with Tukey post-hoc t-test. Denoted significance refers to comparisons between WT and Rel-/- macrophages polarised to either an M1 or M2 phenotype. (f) Volcano plots show differentially expressed proteins detected by proteomic analysis of the secretome of M0, M1 and M2 polarised WT and Rel-/- BMDMs. (g) Graphs show relative levels of Galectin 1 (p=0.0031), Galectin 3 (p=0.0013), Vimentin (p=0.0128) and Matrix Metalloproteinase 12 (MMP12) (p<0.0001) expressed as Intensity x10 in M0, M1 and M2 polarised WT and Rel-/- BMDMs. Data are mean ± s.e.m. from 4 independent cell isolations/group generated 4 different donors/genotype. P values were calculated using the R package LIMMA (* P <0.05, ** P <0.01 and *** P <0.001).
Extended Data Fig. 6
Extended Data Fig. 6. Validation of epithelial specific deletion of c-Rel in kidney and lung fibrosis models.
(a) Flow cytometry gating strategy to identify immune cells (CD45+), epithelial cells (EPCAM+) and endothelial cells (CD31+) isolated from the kidney or lungs of Rel flfl, Rel ΔTEC or Rel ΔAEC mice respectively. (b-c) Ex vivo images of GFP fluorescence signal in the left and right kidneys, heart, liver, lungs and spleen of Rel ΔTEC mice (b) or Rel ΔAEC mice (c) imaged using an In Vivo Imaging System (IVIS). Graph and flow cytometry histograms show the Mean Fluorescence Intensity (MFI) of GFP in EpCAM+, CD31+, CD45+ and EpCAM-CD31-CD45- cells from the kidney of Rel ΔTEC and Relfl/flcontrol mice (b) or from the lung of Rel ΔAEC and Relfl/flcontrol mice (c), n=5 mice/group. (d) Heatmap showing mRNA levels of Tgfb1, Col1a1, Col1a2, Acta2 and Timp1 in control versus UUO kidney of Rel flfl, Rel ΔTEC and Rel ΔLysM mice (left) or control versus bleomycin lung of Rel flfl, Rel ΔAEC and Rel ΔLysM mice (right). Heatmap data are from 2 mice/group in control kidney or lung and 5 mice/group in the injured kidney or lung. (e) Quantification of hydroxyproline levels in nM per left lobe of lung tissue from bleomycin injured in Rel flfl, Rel ΔAEC (p=0.0105), and Rel ΔLysM (p=0.0006) mice. (f) Histological assessment and representative images of TUNEL stained lung sections in day 3 bleomycin injured in Rel flfl, Rel ΔAEC, and Rel ΔLysM mice. Scale bar is 50 microns. Data are mean ± s.e.m. in n=5 mice/group. (g) Quantification of neutrophil numbers in UUO injured kidneys of Rel flfl, Rel ΔTEC (p=0.0014) and Rel ΔLysM (p<0.0001) mice and macrophage numbers in UUO injured kidneys of Rel flfl, Rel ΔTEC (p=0.0045) and Rel ΔLysM (p=0.0004) mice. (h) Quantification of neutrophil numbers in Bleomycin injured lungs of Rel flfl, Rel ΔAEC and Rel ΔLysM mice and macrophage numbers in Bleomycin injured lungs of Rel flfl, Rel ΔAEC (p=0.0018) and Rel ΔLysM (p=0.0327) mice. (e,g,h) Data are mean ± s.e.m. in a minimum of 7 mice/group for the kidney and 10 mice/group for the lung. P values were calculated using one-way ANOVA with Tukey post-hoc t-test (* P <0.05, **P <0.01 and ***P <0.001).
Extended Data Fig. 7
Extended Data Fig. 7. Validation of single myeloid or dual hepatocyte- and myeloid- specific deletion of c-Rel in mice and analysis of fibrogenic gene expression in these mice during chronic liver injury
(a) FACS plot and graphs show the Mean Fluorescence Intensity (MFI) of GFP expression in hepatocytes, macrophages (CD45+F4/80+CD11b+) (p=0.011), T-cells (CD45+CD3+) and non-parenchymal cells (CD45-) from the liver of Rel flfl versus Rel ΔLysM mice, n=3 mice/group. (b) FACS plot and graphs show the Mean Fluorescence Intensity (MFI) of GFP expression in hepatocytes (p=0.007), macrophages (CD45+F4/80+CD11b+) (p=0.007), T-cells (CD45+CD3+) and non-parenchymal cells (CD45-) from the liver of Rel flfl versus RelΔhep/ΔLysM mice, n=3 mice/group. (c) Heatmap showing mRNA levels of Tgfb1, Col1a1, Col1a2, Acta2 and Timp1 in the CCl4 injured liver of Rel flfl, Rel Δhep, Rel ΔLysM and Rel Δhep/ΔLysM mice. P values were calculated using two-sided t-test (* P <0.05)
Extended Data Fig. 8
Extended Data Fig. 8. c-Rel signaling in hepatocyte and macrophages differentially regulate liver regeneration via regulation of cell cycle genes and mitogenic factors.
(a) Histological assessment and representative images of PCNA positive hepatocytes in 48h partial hepatectomy injured Rel flfl, RelΔAlb (p=0.0003) and Rel ΔLysM (p=0.0096) mice. Scale bar is 100 microns. (b) Graph shows average liver/body weight ratio 48h post partial hepatectomy in Rel flfl, RelΔAlb (p=0.0318) and Rel ΔLysM (p=0.0178) mice. (c) Heat map showing relative hepatic mRNA expression of cell cycle genes; Ccna1, Ccnd1, Ccne1, Cdk2, Cdk4 and mitogenic proteins; Hgf and Egf at 48h post partial hepatectomy in Rel flfl, RelΔAlb and Rel ΔLysM mice. Data are mean ± s.e.m. in n=5 mice/group. P values were calculated using one-way ANOVA with Tukey post-hoc t-test (* P <0.05 and ** P <0.01).
Extended Data Fig. 9
Extended Data Fig. 9. IT-603 attenuates fibrogenesis in murine models of fibrosis.
(a) U937 cells stably expressing 3xNF-(B-Luc reporter were transiently transfected with RelA or c-Rel expression plasmids. Graph shows RelA and c-Rel induced NF-κ(B luciferase reporter activity ± IT-603 therapy. Data are mean ± s.e.m. P value = 0.0039. P value was calculated using an unpaired two-sided t-test (***P<0.001) of 3 independent experiments. (b-c) Histological quantification of αSMA stained kidney (p=0.0004) or lungs (p=0.009) following their respective injury. Data are mean ± s.e.m. in 7 and 10 mice/group for kidney and lung respectively. P values were calculated using an unpaired two-sided t-test. (d) Histological quantification of αSMA stained chronic MCD diet injured livers at 2 weeks (pre-treatment) and 5 weeks ± therapeutic administration of IT-603 (p=0.0044). (e) Graphs showing relative hepatic expression of the fibrogenic genes; Tgfb1 (p=0.039), Acta2 (p=0.028), Col1a1 (p=0.036), Col1a2, and Timp1(p=0.015) in 2-week (pre-treatment) and 5-week methionine choline deficient diet (MCD) fed mice ± therapeutic administration of IT-603. Data are mean ± s.e.m. in n=4 control mice 8 vehicle and n=7 IT-603 treated mice/group. (f) Histological quantification of αSMA stained chronic CCl4 injured livers at 3 weeks (pre-treatment) or 8 weeks ± therapeutic administration of IT-603 (p=0.0105). (g) Graphs showing relative hepatic expression of the fibrogenic genes; Tgfb1 (p=0.029), Acta2 (p=0.032), Col1a1 (p=0.04), Col1a2 (p=0.016), and Timp1 (p=0.009) in chronic CCl4 injured livers at 3 week (pre-treatment), 8 week and ± therapeutic administration of IT-603 (from weeks 3-8). Data are mean ± s.e.m. in n=4 control mice 7 experimental mice/group. (c,e) P values were calculated using one-way ANOVA with Tukey post-hoc t-test. (d,f) P values were calculated using two-way ANOVA with Tukey post-hoc t-test (*P<0.05, ***P<0.001).
Extended Data Fig. 10
Extended Data Fig. 10. IT-603 attenuates fibrosis in ex vivo human tissues slice models of liver and kidney fibrosis.
(a) Diagrams show the experimental timelines of TGF(1 induced fibrosis in ex vivo normal human liver and kidney precision cut slices (PCS). (b) Representative images of CD68 stained liver and kidney tissue slices. (c) Representative images and histological quantification of Picrosirius red stained fibrotic kidney slices ± IT-603 therapy (p<0.0001). Representative images and histological quantification of αSMA stained fibrotic kidney slices ± IT-603 therapy (p<0.0001). Red line denotes the value for the T=0 slice. (e) Quantification of soluble collagen released from fibrotic kidney slices ± IT-603 therapy (p=0.0015). (f) Quantification of the neo-epitope pro C3 released from fibrotic kidney slices ± IT-603 therapy (p=0.0493). (g) Graph showing average LDH release in the media expressed as a percentage (%) of positive control (LDH levels in media from a PCS where maximal death was induced by multiple freeze/thaws – normalized to media volume). (IT-603 p=0.023 and IT-603+TGFβ1 p=0.02). Images representative of n=3 independent slice experiments. Data are mean ± s.e.m. and representative of slices generated from 3 independent donors performed in duplicate. Scale bars equal 100 microns. P values were calculated using two-way ANOVA with Tukey post- hoc t-test (*P<0.05, **P<0.01, ***P<0.001 and ****P<0.0001).
Figure 1
Figure 1. c-Rel is a feature of chronic liver, kidney and lung disease in humans and epithelial c-Rel signalling regulates hepatic fibrogenesis and regeneration in mice
(a) Representative images show c-Rel staining in normal and diseased liver, lung and kidney sections. (b) Graphs show average percentage area of c-Rel stained tissue in normal liver, lung and kidney sections compared to diseased human liver (alcoholic liver disease (ALD), primary sclerosing cholangitis (PSC) and non-alcoholic steatohepatitis (NASH)), diseased kidney (focal segmented glomerular sclerosis (FSGS) and diabetic nephropathy (DN)) or lung disease, idiopathic pulmonary fibrosis (IPF). Data are mean ± s.e.m. in 7 healthy and 11 diseased patient tissue for liver (p value = 0.0003), 5 healthy and 13 diseased patient tissue for kidney (p value = 0.0002) and 5 healthy and 8 diseased patient tissue for lung (p value <0.0001). (c) FACS plot showing the Mean Fluorescence Intensity (MFI) of GFP in hepatocytes, cholangiocytes (EPCAM+) and non-parenchymal (EpCAM-) cells from the liver of Rel flfl (grey) and Rel ΔAlb (blue) mice. (d) Representative images show c-Rel staining 5 mice/group in olive oil Rel flfl mice and CCl4 injured Relflfl and Rel ΔAlb mice. (e-f) Histological assessment and representative images of (e) αSMA (p value = 0.005) and (f) PCNA (p value = 0.005) stained liver sections in acute CCl4 injured Relflfl and Rel ΔAlb mice. Data are mean ± s.e.m. in 5 mice/group. Scale bars equal 50 microns. All P values were calculated using a unpaired two-sided T test (* P <0.05, *** P <0.001).
Figure 2
Figure 2. c-Rel signalling regulates epithelial inflammatory responses via regulation of Pfkfb3
(a) Heatmap showing secreated IL6, Cxcl1, Cxcl2, Cxcl10, Ccl2, Ccl3, Ccl4 and Ccl5, measured by MSD in the media of hepatocytes isolated from WT and Rel-/- mice and stimulated ± IL-1β. (b) Graph shows quantification of neutrophil (p value = 0.0012) and macrophage (p value = 0.0039) numbers in the liver of acute CCl4 injured Relflfl and Rel ΔHep mice. (c) Heatmap showing secreated IL6, Cxcl1, Cxcl2, Cxcl10, Ccl2, Ccl3, Ccl4 and Ccl5, measured by MSD in the media of hepatocytes isolated from WT and Rel-/- mice and stimulated ± TGFβ1. (d) Volcano plots show differentially expressed proteins detected by proteomic analysis of the secretome of WT control and WT TGFβ1 treated hepatocytes (left) and TGFβ1 treated WT and Rel-/- hepatocytes (right). (e) Venn diagram shows the number of differentially expressed proteins in TGFβ1 treated WT hepatocytes compared to control WT hepatocytes (Blue) and number of differentially expressed proteins in TGFβ1 treated WT hepatocytes compared to TGFβ1 treated Rel-/- hepatocytes (Orange). The overlap denotes c-Rel dependent secreted proteins in response to TGFβ1 stimulation. (f) Representative images show CTGF staining in the liver of 6 mice/group acute CCl4 injured Relflfl and Rel ΔHep mice. (g) Graphs show seahorse analysis of glycolysis (extracellular acidification rate, ECAR) and mitochondrial respiration (oxygen consumption rate, OCR) in WT and Rel-/- hepatocytes stimulated ± TGFβ1. Where A-D vertical lines refer to the administration of the following compounds: A – Glucose, B – Oligomycin, C- Pyruvate and FCCP, D – Rotenone and Antimycin A. (h) Representative images show Pfkfb3 staining in a minimum of 5 mice/group of olive oil control and CCl4 injured liver. (i) Graph shows mRNA expression of Pfkfb3 in WT and Rel-/- hepatocytes stimulated ± TGFβ1. (p value = 0.0008) (j) Quantification of neutrophil (p value= 0.0097) and macrophage (p value = 0.0002) numbers and histological assessment and representative images of αSMA (p value = 0.001) stained liver sections in acute CCl4 injured Pfkfb3flfl and Pfkfb3 Δhep mice. P values were calculated using a unpaired two-sided T test. (k) Heatmap shows mRNA levels of fibrogenic genes; Tgfb1, Acta2, Col1a1, Col1a2, Timp1, Ctgf and inflammatory genes; Il1b, Il6, Tnfa, Cxcl1, Ccl2 and Ccl5 in acute CCl4 injured Pfkfb3flfl and Pfkfb3 Δhep mice. Data in graphs are mean ± s.e.m. in 7 mice/genotype (c), n=5 Pfkfb3flfl and n=6 Pfkfb3 Δhep mice (e), or a minimum of 3 independent cell isolations/condition. Scale bars equal 100 microns. (a, c, i) P values were calculated using a two-way ANOVA with Tukey post-hoc t-test. (b, j, k) P values were calculated using unpaired two-tailed T-test (* P <0.05, ** P <0.01 and ***P<0.001).
Figure 3
Figure 3. c-Rel signalling in macrophages is pro-fibrogenic and regulates macrophage plasticity
(a) Histological assessment and representative images of Picrosirius red (collagen) stained liver sections in chronic CCl4 injured in Relflfl, RelΔAlb (p value = 0.0064 ) and RelΔLysM (p value = 0.0035) mice. Data are mean ± s.e.m. in 10 mice/group, scale bar equals 100 microns. (b) Representative immuno-fluorescence images show c-Rel (red), CD68 (green) and nuclear (blue) staining in human diseased liver (n=11), kidney (n=13) and lung (n=8) sections. Yellow arrows denote co-localisaton of c-Rel and CD68. Scale bars equal 20 microns. (c) Representative bright-field images of WT and Rel-/- M1 and M2 polarised BMDMs in 3 independent cell isolations. Scale bar = 50 microns (d) Heat map shows mRNA expression of Nos2, Il12, Tnfa, Il6, Il1b, Arg1, Ym1, Il13, Hgf and Egf in M0, M1 and M2 polarised WT and Rel-/- BMDM respectively. (e) Graphs show glycolysis (extracellular acidification rate, ECAR) and mitochondrial respiration (oxygen consumption rate, OCR) in M1 and M2 polarised WT and Rel-/- BMDM respectively. Where A-D vertical lines refer to the administration of the following compounds: A – Glucose, B – Oligomycin, C- Pyruvate and FCCP, D – Rotenone and Antimycin A (f) Graphs show mRNA expression of Pfkfb3 (p value = 0.029) and Pfkfb1 (p value = 0.0031) in M1 and M2 polarised WT and Rel-/- BMDMs. Data are mean ± s.e.m of n=3 independent cell isolations. (a, d) P values were calculated using a two-way ANOVA with Tukey post-hoc t-test. (f) P values calculated using an unpaired two-side T test. P values equal *P<0.05 and **P<0.01. Asterisks on heatmaps denote significance between WT and Rel -/- macrophages in M1 or M2 responsive genes in line with the M1 or M2 stimulation. There is no significant difference between M0 macrphages from either genotype.
Figure 4
Figure 4. c-Rel regulates pro-fibrogenic epithelial-macrophage crosstalk to accelerates fibroblast activation
(a) Schematic shows Rel fl/fl, Rel ΔLysM and Rel ΔAlb mice receiving CCl4 mediated acute liver injury. Mice were harvested at day 1 and day 5 post CCl4 injury during the inflammatory and resolution phases of wound healing (WH) respectively. (b) FACS quantification of the percentage (%) of CD11bHiF4/80Int inflammatory macrophages in uninjured liver and during the inflammatory (day 1) (p values = 0.0002 for Rel ΔAlb and 0.00012 Rel ΔLysM mice) and resolution (day 5) (p values = 0.0037 for Rel ΔAlb and 0.0002 Rel ΔLysM mice) phases of WH in acute CCl4 injured Rel flfl,Rel ΔAlb and Rel ΔLysM mice. (c) FACS quantification of the percentage (%) of iNOS+ (p values = 0.0033 for Rel ΔAlb and 0.0002 Rel ΔLysM mice) and ARG1+ (p values = 0.0043 for Rel ΔAlb and 0.0001 Rel ΔLysM mice) inflammatory macrophages during the inflammatory and resolution phases of WH respectively in acute CCl4 injured Rel flfl, Rel ΔLysM and Rel ΔAlb mice. Data in graphs are mean ± s.e.m of n=4 independent cell isolations. (d) Heatmap shows mRNA expression of inflammatory genes; Cxcl1, Cxcl2, Ccl2, Il1b and Il6 in primary hepatocytes isolated from Rel flfl, Rel ΔLysM and Rel ΔAlb mice during the inflammatory phase of WH. (e) Representative immuno-fluorescence images of αSMA (green) and nuclear (blue) staining, scale bar = 50 microns. (f) Graph showing quantification of αSMA stained area (f) in WT hepatic stellate cells cultured in media only (control) or conditioned media from WT or Rel-/- hepatocytes treated ± TGFβ1 (p value = 0.0153) or WT or Rel-/- M1 and M2 (p value = 0.024) polarised macrophages. Data are mean ± s.e.m of n=3 independent cell isolations. (b, c, f) P values were calculated using a two-way ANOVA with Tukey post-hoc t-test or an unpaired two-tailed t-test (* P <0.05, ** P <0.01 and *** P <0.001). (g) Model shows c-Rel-Pfkfb3 dependent paracrine epithelial-macrophage crosstalk driving fibroblast activation within the fibrogenic niche. Model created using biorender.
Figure 5
Figure 5. Epithelial or macrophage specific deletion of c-Rel limits renal and pulmonary fibrosis
(a) Histological quantification and representative images of Picrosirius red stained collagen in UUO injured kidneys of Rel flfl, Rel ΔTEC (p value = 0.0013) and RelΔLysM (p value = 0.0002) mice and αSMA positive myofibroblasts in UUO injured kidneys of Rel flfl, Rel ΔTEC (p value = 0.002) and RelΔLysM mice (p value = 0.0005). (b) Histological quantification and representative images of Picrosirius red stained bleomycin injured lungs of Rel flfl, Rel ΔAEC (p value = 0.0155) and RelΔLysM (p value = 0.0004) mice and αSMA stained bleomycin injured lungs of Rel flfl, Rel ΔAEC (p value = 0.0161) and RelΔLysM (p value = 0.0013) mice. Data are mean ± s.e.m. in a minimum of 7 mice/group for the kidney and 10 mice/group for the lung. Scale bars equal 100 microns. All P values were calculated using a one-way ANOVA with Tukey post- hoc t-test. P values equal *P<0.05, **P<0.01 and ***P<0.001.
Figure 6
Figure 6. Figure 6. Epithelial and macrophage c-Rel signalling synergistically promote hepatic fibrosis but antagonistically regulate hepatic regeneration in mice
(a) Schematic shows the timeline of intravenous injection administration of adeno-associated virus expressing Cre recombinase (AAV-TBG-Cre) to Rel flfl or RelΔLysM mice to create RelΔHep and RelΔHep/ΔLysM prior to chronic CCl4 injury. (b) Histological quantification and representative images of Picrosirius red stained sections from chronic CCl4 injured Rel flfl, RelΔHep (p value = 0.0093), RelΔLysM (p value = 0.0074) and RelΔHep/ΔLysM (p value = 0.0001) mice. (c) Histological quantification and representative images of αSMA stained sections from chronic CCl4 injured Rel flfl, RelΔHep (p value = 0.028), RelΔLysM (p value = 0.023) and RelΔHep/ΔLysM (p value = 0.0001) mice. (d) Histological quantification and representative images of CD68 (macrophages) sections from chronic CCl4 injured Rel flfl, RelΔHep(p value = 0.0316), RelΔLysM (p value = 0.0181) and RelΔHep/ΔLysM (p value = 0.00012) mice. (e) Histological quantification and representative images of PCNA stained sections from chronic CCl4 injured Rel flfl, RelΔHep (p value = 0.0008), RelΔLysM (p value = 0.0106) and RelΔHep/ΔLysM mice. Data are mean ± s.e.m. in 5 mice/group. Scale bars equal 100 microns. All P values were calculated using a one-way ANOVA with Tukey post-hoc t-test (* P <0.05, ** P <0.01, *** P <0.001).
Figure 7
Figure 7. Pharmacological inhibition of c-Rel limits fibrogenesis in murine models of liver, kidney and lung injury
(a-c) Diagrams show experimental timelines of CCl4, UUO or bleomycin induced liver, kidney or lung fibrosis ± prophylactic IT-603 (c-Rel inhibitor) therapy. Histological quantification and representative images of αSMA stained liver (p value = 0.0031) and Picrosirius red stained kidney (p value = 0.0099) or lungs (p value = 0.01) following their respective injury. Data are mean ± s.e.m. in 7, 7 and 10 mice/group for liver, kidney and lung respectively. (d-e) Diagrams show experimental timelines of methionine choline deficient diet (MCD) fed or chronic CCl4 induced liver fibrosis ± therapeutic administration of IT-603. Histological quantification and representative images of Picrosirius red stained MCD (p value = 0.0044) or chronic CCl4 (p value = 0.001) injured livers pre-treatment and ± therapeutic administration of IT-603. Data are mean ± s.e.m. in 5 pre-treatment mice, 8 vehicle treated MCD mice and 7 IT-603 treated MCD fed mice. Data are mean ± s.e.m. in 5 pre-treatment mice, 7 vehicle treated chronic CCl4 injured mice and 7 IT-603 treated chronic CCl4 injured mice. Scale bars equal 100 microns. (a-c) P values calculated using two-sided student T Test. (d-e) P values were calculated using a one-way ANOVA with Tukey post- hoc t-test. P values equal *P<0.05 and **P<0.01 versus vehicle treatment.
Figure 8
Figure 8. Pharmacological inhibition of c-Rel limits fibrogenesis in human precision cut liver slices
(a-b) Representative images and histological quantification of (a) Picrosirius red (p value = 0.0009) and (b) αSMA (p value = 0.0006) stained liver slices ± TGFβ1 ± IT-603 therapy. Red line denotes the value for the T=0 slice. (c-d) Quantification of (c) soluble collagen (p value = 0.0023) and (d) the neo-epitope pro C3 (p value 0.0286) released from fibrotic liver slices ± IT-603 therapy. (e) Graph showing average LDH release in the media expressed as a percentage (%) of positive control (LDH levels in media from a PCS where maximal death was induced by multiple freeze/thaws – normalized to media volume) where p values = 0.0044 and 0.0004 for IT-603 and IT-603+TGFβ1 respectively. Images are representative of n=3 independent slice experiments. Data are mean ± s.e.m. and representative of slices generated from 3 independent donors performed in duplicate. Scale bars equal 100 microns. P values were calculated using two-way ANOVA with Tukey post- hoc t-test (*P<0.05, **P<0.01 and ***P<0.001).

Similar articles

Cited by

References

    1. Wynn TA, Ramalingam TR. Mechanisms of fibrosis: therapeutic translation for fibrotic disease. Nat Med. 2012;18(7):1028–104. doi: 10.1038/nm.2807. - DOI - PMC - PubMed
    1. Rockey DC, Bell PD, Hill JA. Fibrosis — A Common Pathway to Organ Injury and Failure. N Engl J Med. 2015;373(1):95–96. doi: 10.1056/NEJMc1504848. - DOI - PubMed
    1. Bataller R, Brenner DA. Liver fibrosis. J Clin Invest. 2005;115(2):209–218. doi: 10.1172/JCI24282. - DOI - PMC - PubMed
    1. Friedman SL. Liver fibrosis – from bench to bedside. J Hepatol. 2003;38:38–53. doi: 10.1016/S0168-8278(02)00429-4. - DOI - PubMed
    1. Cox TR, Erler JT. Molecular Pathways: Connecting Fibrosis and Solid Tumor Metastasis. Clin Cancer Res. 2014;20(14):3637–3643. doi: 10.1158/1078-0432.CCR-13-1059. - DOI - PubMed

Publication types

MeSH terms