. 2020 Dec;15(12):3942-3970.
doi: 10.1038/s41596-020-0396-3. Epub 2020 Nov 9.

Protein higher-order-structure determination by fast photochemical oxidation of proteins and mass spectrometry analysis

Affiliations

Protein higher-order-structure determination by fast photochemical oxidation of proteins and mass spectrometry analysis

Xiaoran Roger Liu et al. Nat Protoc. 2020 Dec.

Abstract

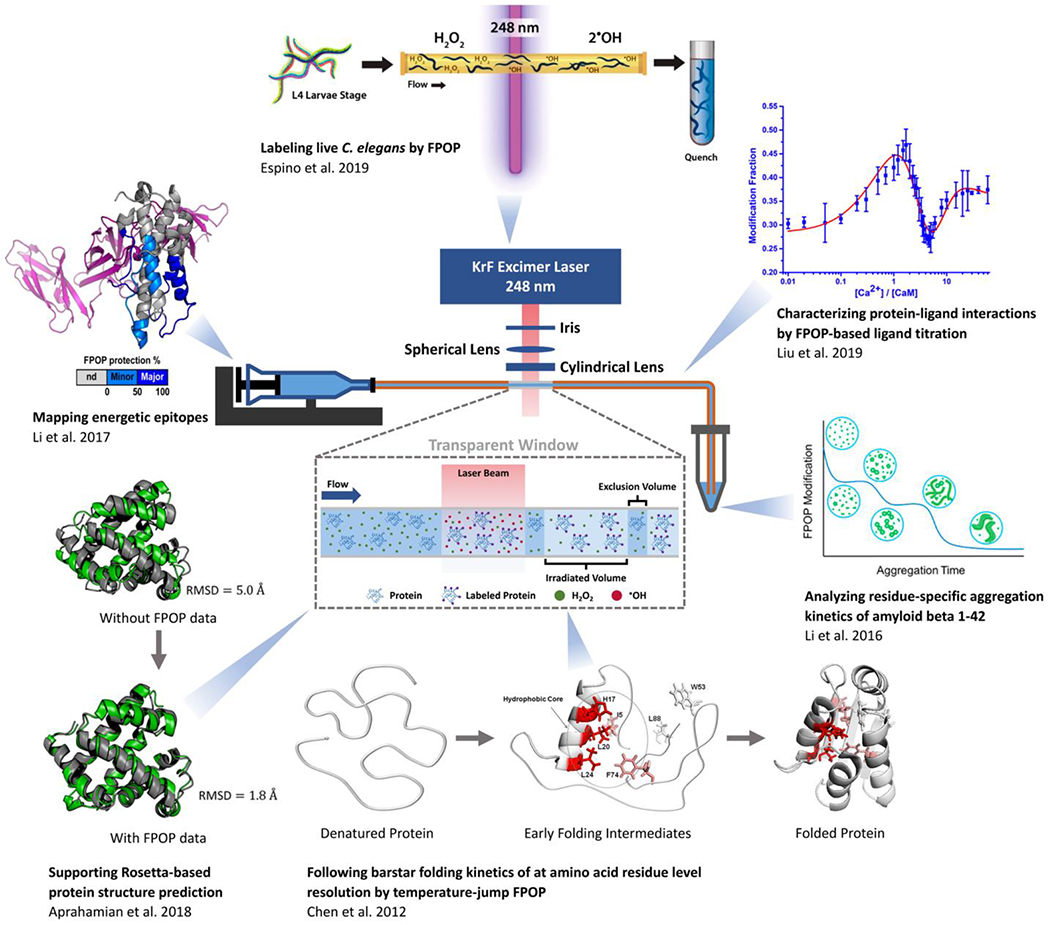
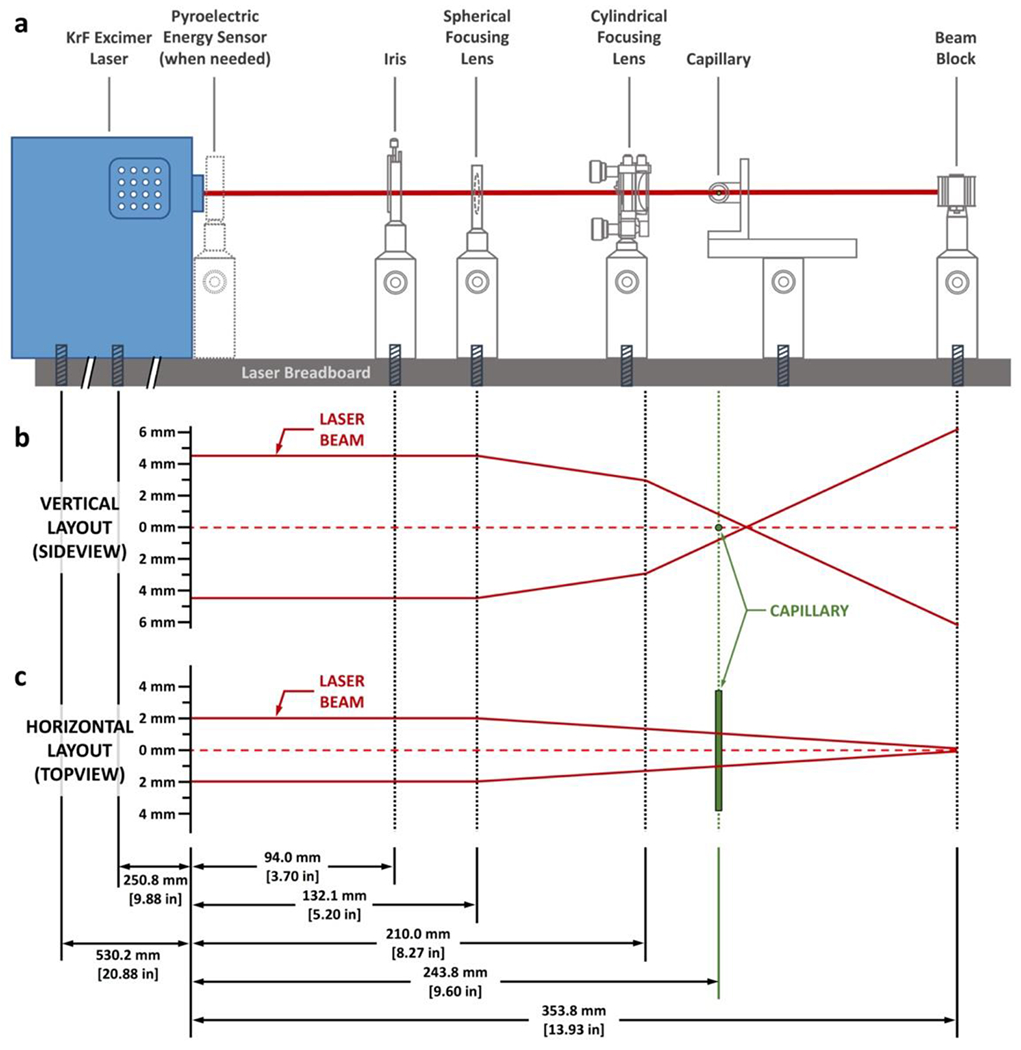
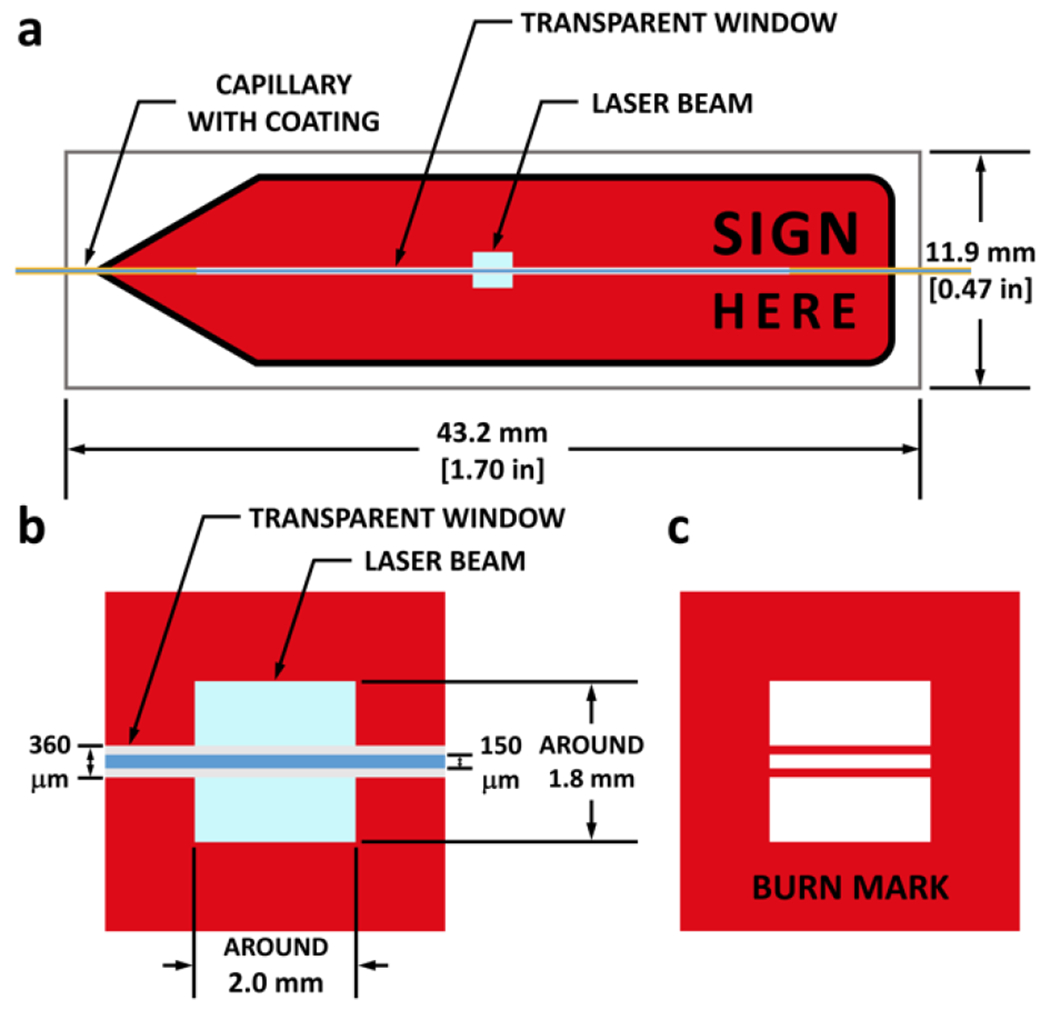
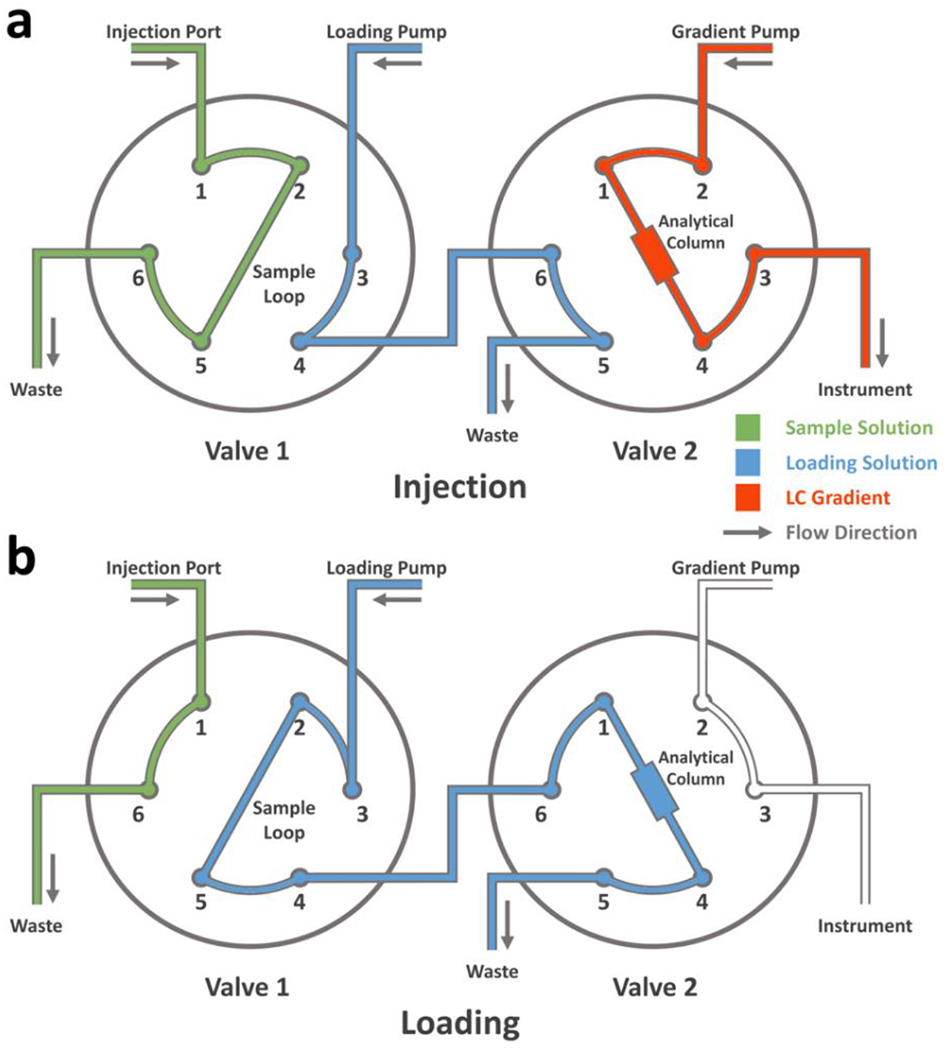
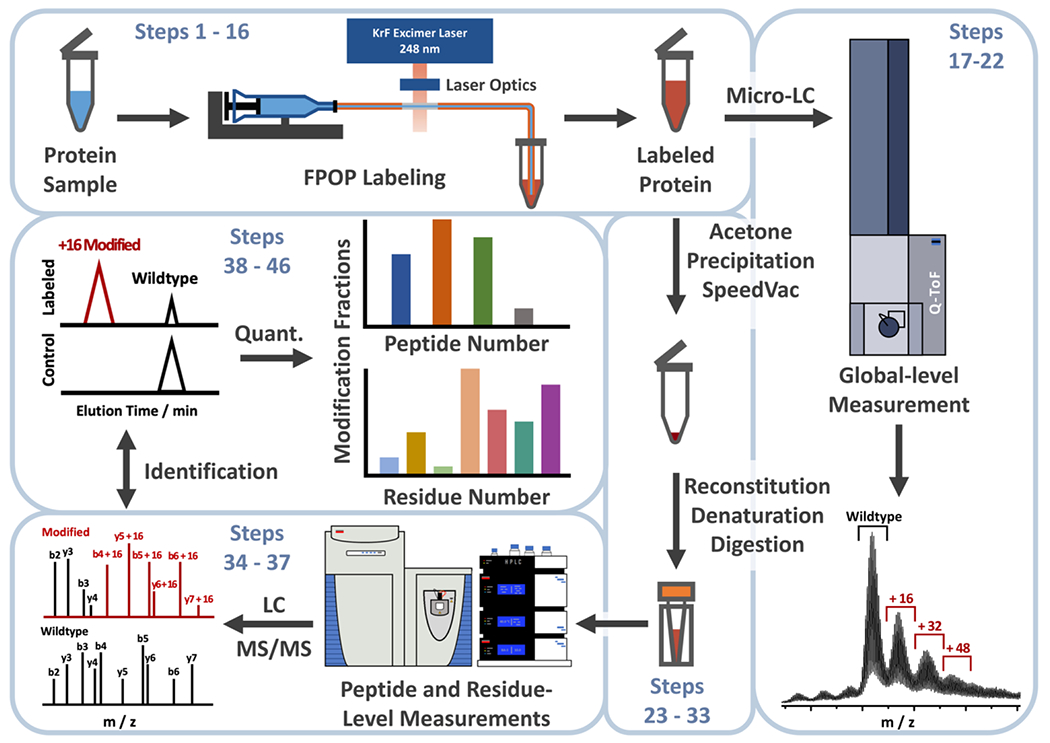
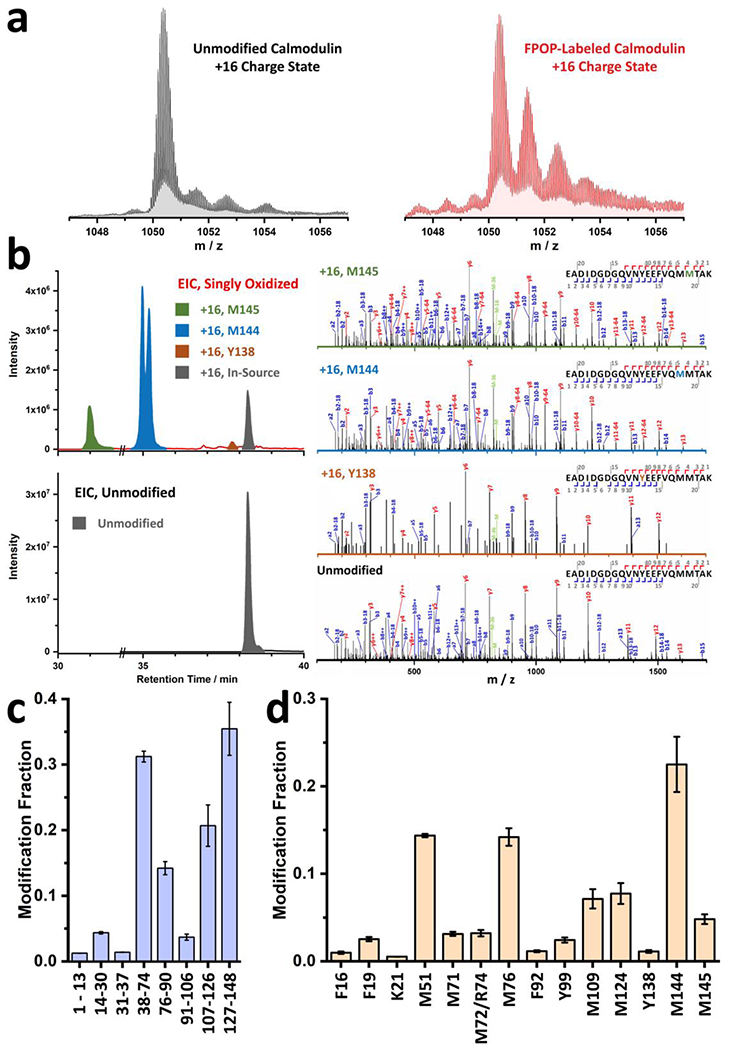
The higher-order structure (HOS) of proteins plays a critical role in their function; therefore, it is important to our understanding of their function that we have as much information as possible about their three-dimensional structure and how it changes with time. Mass spectrometry (MS) has become an important tool for determining protein HOS owing to its high throughput, mid-to-high spatial resolution, low sample amount requirement and broad compatibility with various protein systems. Modern MS-based protein HOS analysis relies, in part, on footprinting, where a reagent reacts 'to mark' the solvent-accessible surface of the protein, and MS-enabled proteomic analysis locates the modifications to afford a footprint. Fast photochemical oxidation of proteins (FPOP), first introduced in 2005, has become a powerful approach for protein footprinting. Laser-induced hydrogen peroxide photolysis generates hydroxyl radicals that react with solvent-accessible side chains (14 out of 20 amino acid side chains) to fulfill the footprinting. The reaction takes place at sub-milliseconds, faster than most of labeling-induced protein conformational changes, thus enabling a 'snapshot' of protein HOS in solution. As a result, FPOP has been employed in solving several important problems, including mapping epitopes, following protein aggregation, locating small molecule binding, measuring ligand-binding affinity, monitoring protein folding and unfolding and determining hidden conformational changes invisible to other methods. Broader adoption will be promoted by dissemination of the technical details for assembling the FPOP platform and for dealing with the complexities of analyzing FPOP data. In this protocol, we describe the FPOP platform, the conditions for successful footprinting and its examination by mass measurements of the intact protein, the post-labeling sample handling and digestion, the liquid chromatography-tandem MS analysis of the digested sample and the data analysis with Protein Metrics Suite. This protocol is intended not only as a guide for investigators trying to establish an FPOP platform in their own lab but also for those willing to incorporate FPOP as an additional tool in addressing their questions of interest.


Conflict of interest statement

Competing Interests

The authors declare an ongoing collaboration with Protein Metrics in establishing an HDX data processing platform, a topic that is not related to this protocol. The recommendation of using Protein Metrics as preferred data processing software for FPOP data predates the ongoing collaboration.

Figures

Fig. 1 |
Fig. 1 |. Major applications of FPOP.
Clockwise from top: Espino, et al. labeled live Caenorhabditis elegans (C. elegans) with FPOP and identified oxidative labeling on several hundred proteins. Liu, et al. combined ligand titration with FPOP and characterized binding sites, site-specific affinities, and binding orders of the calcium - calmodulin (Ca2+ – CaM) system. Li, et al. used FPOP to follow the amyloid beta 1-42 aggregation kinetics and revealed the critical role of its middle domain in the aggregation process. Chen, et al. established a temperature-jump platform and demonstrated its utility for the folding kinetics of barstar with residue-level FPOP. Aprahamian, et al. developed a Rosetta scoring algorithm that utilizes FPOP data, after which the root mean square deviation (RMSD, as compared with crystal structure) of the best scoring model improved significantly. Li, et al. demonstrated the applicability of FPOP in mapping epitopes by successfully identified the binding regions between an antibody and interleukin-23.
Fig. 2 |
Fig. 2 |. Schematic illustration of the laser optics setup.
a, A sideview of the laser configuration. All laser optics are aligned in a linear fashion along the laser axis and are attached to the laser breadboard with screws. The positions of the laser optics, not their physical sizes, are drawn to scale. Detailed drawing of the optics setup and a blueprint of their alignment are available as Supplementary Fig. 2. b, Vertical layout of the laser beam and the effect of the laser optics on its pathway. The drawing is to scale, as indicated by the axis on the left. c, Horizontal layout of the laser beam and the effect of the laser optics on its pathway. Note that the cylindrical focusing lens has no effect on the laser beam on the horizontal direction as illustrated in this figure. The plot is drawn to scale as indicated by the axis on the left.
Fig. 3
Fig. 3. Red arrow flag for checking the laser alignment.
a, Front view of the red arrow flag when aligned with the laser beam. Region colored in light blue represents the laser beam. The regions colored in orange, light gray, and blue are the polyimide-coated wall, naked wall (transparent window), and the liquid inside the capillary, respectively. b, Zoom-in of the region illuminated by the laser beam, with detailed dimensions of the laser spot and the capillary diameters. c, Schematic of the laser burn mark after a 50-shot laser sequence. Dimensions are in line with those in b.
Fig. 4 |
Fig. 4 |
Schematic illustration of a two-valve LC configuration in the a, “Injection” and b, “Loading” modes.
Fig. 5 |
Fig. 5 |. Schematic illustration of the FPOP workflow.
Steps 1-16 describe the protein footprinting by FPOP, 17-22 cover the global level analysis of FPOP-labeled protein sample, 23-33 show the post-labeling sample handling and protease digestion, 34-37 represent the LC-MS/MS analysis of the FPOP-labeled sample at the peptide and residue levels, and finally steps 38-46 denote the data processing and final presentation.
Fig. 6 |
Fig. 6 |. Anticipated FPOP results.
a, Global level spectra for unmodified (bottom, black) and FPOP-labeled (top, maroon) calmodulin in + 16 charge state. b, Sample EICs for unmodified (bottom, black) and +16 modified (top) peptide 129-148 from FPOP-labeled calmodulin. EIC for modified species are colored in olive, blue and orange to represent the +16 modifications on residue M145, M144, and Y138, respectively. Representative product-ion (MS/MS) spectra supporting these assignments together with spectrum for the unmodified peptide are provided on the right. c, Peptide-level FPOP results of calcium-free calmodulin with 99% sequence coverage. d, Residue-level FPOP results of calcium-free calmodulin with 14 resolvable residues. Error bars in c and d are standard deviations from two replicates.

Similar articles

Cited by

References

    1. Anfinsen CB, Haber E, Sela M & White FH THE KINETICS OF FORMATION OF NATIVE RIBONUCLEASE DURING OXIDATION OF THE REDUCED POLYPEPTIDE CHAIN. Proceedings of the National Academy of Sciences 47, 1309–1314 (1961). - PMC - PubMed
    1. Drenth J Principles of protein X-ray crystallography. (Springer Science & Business Media, 2007).
    1. Wüthrich K The way to NMR structures of proteins. Nature Structural Biology 8, 923–925 (2001). - PubMed
    1. McPherson A Introduction to protein crystallization. Methods 34, 254–265 (2004). - PubMed
    1. Cheng Y Single-Particle Cryo-EM at Crystallographic Resolution. Cell 161, 450–457 (2015). - PMC - PubMed

Publication types