. 2021 Jan;22(1):67-73.
doi: 10.1038/s41590-020-00828-7. Epub 2020 Nov 9.

Proinflammatory IgG Fc structures in patients with severe COVID-19

Affiliations

Proinflammatory IgG Fc structures in patients with severe COVID-19

Saborni Chakraborty et al. Nat Immunol. 2021 Jan.

Abstract

Severe acute respiratory syndrome coronavirus 2 infections can cause coronavirus disease 2019 (COVID-19), which manifests with a range of severities from mild illness to life-threatening pneumonia and multi-organ failure. Severe COVID-19 is characterized by an inflammatory signature, including high levels of inflammatory cytokines, alveolar inflammatory infiltrates and vascular microthrombi. Here we show that patients with severe COVID-19 produced a unique serologic signature, including an increased likelihood of IgG1 with afucosylated Fc glycans. This Fc modification on severe acute respiratory syndrome coronavirus 2 IgGs enhanced interactions with the activating Fcγ receptor FcγRIIIa; when incorporated into immune complexes, Fc afucosylation enhanced production of inflammatory cytokines by monocytes, including interleukin-6 and tumor necrosis factor. These results show that disease severity in COVID-19 correlates with the presence of proinflammatory IgG Fc structures, including afucosylated IgG1.


Figures

Extended Data Fig. 1
Extended Data Fig. 1. ROC curves with other characterized IgG1 glycans.
Receiver operating characteristic (ROC) curve for anti-RBD IgG1 IgG1 bisection (blue), galactosylation (green) and sialylation (yellow) from all hospitalized (n=43) and mild (n=18) COVID-19 patients showed these glycans were not predictors of COVID-19 severity. Area under the curve (AUC) for bisection 0.54[95% CI (0.38–0.69, p= 0.6357), galactosylation 0.61[0.42–0.81, p=0.1872 and sialylation 0.60[ 95% CI (0.40–0.79, p= 0.2245).
Extended Data Fig. 2
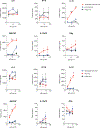
Extended Data Fig. 2. Regulation of Fc glycoforms.
(a) Longitudinal analysis of the levels of anti-RBD IgG1 Fc afucosylation from COVID-19 patients at various time points. T1 represents the first draw with a second time point at week 2 (n=5), week 3 (n=5) or week 4 (n=11). Anti-RBD IgG1 from COVID-19 patients were characterized for Fc afucosylation (F0N0), bisection (N), sialylation (S) and galactosylation (GS0). None of the glycan levels were significantly different between T1 and subsequent time-points post infection. P values were calculated using two-tailed Wilcoxon matched-pairs signed rank test. (b) There was no correlation (Pearson’s correlation coefficient (r) was calculated, and two-tailed p and r values have been reported) between the viral load and the abundance of any of the glycans on anti-RBD IgG1 (n=25). (c, d) The levels of the various glycans were not significantly different amongst male and female hospitalized COVID-19 patients in two cohorts (Blue-Kaiser Permanente (n=81, M=55, F=26), Orange-Stanford hospital (n=30, F=14, M=16)) or in (e) mild COVID-19 patients (n=27, F=14, M=13). Violin plots in (c), (d) and (e) show the distribution of sample values along with median (solid lines) and quartile (broken lines) values. P values were calculated using a two-tailed unpaired t test with Welch’s correction.
Extended Data Fig. 3
Extended Data Fig. 3. Correlation between age and abundance of IgG1 glycoforms.
Age of COVID-19 patients (n=107) did not correlate with abundance of any of the Fc glycoforms. Pearson’s correlation coefficient (r) and two-tailed p values have been reported.
Extended Data Fig. 4
Extended Data Fig. 4. Binding by differentially afucosylated IgGs to SARS-CoV-2 S protein.
The level of IgG afucosylation did not impact binding to spike protein both for (a) pooled IgG from patients or (b) mAb 3022. The assays were performed in duplicate and mean data and standard deviation (SD) have been graphed.
Extended Data Fig. 5
Extended Data Fig. 5. Cytokine production by immune complex-stimulated monocytes.
Monocytes stimulated with highly afucosylated immune complexes made from both (a) patient IgG pools (IL8: p=0.0196 for 100μg/ml, p=0.0002 for 20μg/ml. IL10: p<0.0001 for 100μg/ml, p<0.0001 for 20μg/ml and p= 0.0019 for 4μg/ml. GM-CSF: p=0.0036 for 100μg/ml, p<0.0001 for 20μg/ml and p=0.003 for 4μg/ml) and (b) mAb 3022 (IL8: p=0.001 for 10μg/ml, p=0.0011 for 2μg/ml. IL10: p= 0.0045 for 10μg/ml, p=0.0112 for 2μg/ml and p= 0.0021 for 0.4μg/ml. GM-CSF: p=0.0007 for 10μg/ml, p<0.0001 for 2μg/ml and p=0.0036 for 0.4μg/ml) produced higher amounts of multiple proinflammatory cytokines as compared to immune complexes with low afucosylation. The assays were performed in duplicate with monocytes from three healthy donors and mean data and standard error of the mean (SEM) has been graphed. P-values between high and low afucosylated immune complexes at each antibody concentration were calculated by two-tailed paired t-tests. *P ≤ 0.05, **P ≤0.01, ***P ≤ 0.001, ****P ≤ 0.0001.
Extended Data Fig. 6
Extended Data Fig. 6. Schematic representation of the role of IgG afucosylation in COVID-19.
(a) Severe COVID-19 patients were more likely to have elevated levels of afucosylated IgG1 as compared to patients with mild disease. (b) Immune complexes formed from these high afucosylated antibodies have stronger binding to low affinity activating FcγRIIIa on surface of innate immune cells and thus more ITAM signaling. This leads to an production of pro-inflammatory cytokines.
Figure 1.
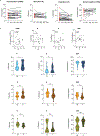
Figure 1.. SARS-CoV-2 antibodies in COVID-19 patients and in undiagnosed children.
(a) Anti-RBD IgM, IgA, IgG titers in COVID patients who required treatment in the ICU (red) (n= 21), hospitalization but no ICU (Floor, yellow) (n=22), patients treated on an outpatient basis (Outpatient, light blue) (n=18), or seropositive children (Peds, dark blue) (n=16) (b) Anti-RBD AUC for the four patient groups are shown. Data shown are representative of at least two experiments performed in triplicate. Violin plots show the distribution of sample values along with median (solid lines) and quartile (broken lines) values. The dashed line indicates the average AUC value of the pre-COVID-19 historical samples. P values in (b) were calculated using one-way ANOVA with Tukey’s multiple comparisons testing between all groups. (IgM- p=0.0079 ICU vs. Outpatient, p=0.0079 ICU vs Peds, p=0.0023 Floor vs Outpatient, p=0.0023 Floor vs Peds. IgA- p=0.0005 ICU vs. Outpatient, p=0.0001 ICU vs Peds, p=0.0454 Floor vs Outpatient, p=0.0148 Floor vs Peds.). *P ≤ 0.05, **P ≤ 0.01, ***P ≤ 0.001, ****P ≤0.0001.
Figure 2.
Figure 2.. Structural properties of anti-RBD IgG Fc domains in adult COVID-19 patients and in seropositive children.
(a) The abundance of anti-RBD IgG subclasses was characterized. ICU patients had elevated levels of IgG3 compared to those treated on the floor or outpatients. P values were calculated using unpaired two-tailed t-tests (p=0.0449 for ICU vs Floor, p=0.0243 for ICU vs Outpatient). (b) Cartoon representation of IgG1 Fc glycans and various F0 modifications that were characterized. (c) Anti-RBD IgG1 Fc post-translational modifications were characterized. Patients who were hospitalized (ICU or floor) had significantly reduced Fc fucosylation (F), when compared with RBD IgGs from outpatients (p=0.0092 for ICU vs Outpatient and p=0.0011 for Floor vs Outpatient) or from children (p=0.0001 ICU vs Peds and p=<0.0001 for Floor vs Peds). Fc galactosylation (GS0) was significantly higher and sialylation (S) significantly lower in all adult patients compared with children (GS0: p=0.0019 ICU vs Peds, p=0.0007 for Floor vs Peds and p=0.0007 for Outpatient vs Peds. S: p=0.0097 for ICU vs Peds, p=0.0045 for Floor vs Peds and p=0.0052 for Outpatient vs Peds). No significant differences were observed in levels of IgG1 Fc bisection (N). (d) Receiver operating characteristic (ROC) curve for anti-RBD IgG1 fucosylation from all hospitalized (n=43) and mild (n=18) COVID-19 patients showed IgG1 fucose levels separated the two cohorts. Area under the curve (AUC) 0.74 [95% CI (0.62–0.86, p=0.0031). (e) Of the six afucosylated forms quantified, those lacking both core fucose and a bisecting N-acetyl glucosamine (F0N0) were substantially enriched in severe COVID-19 patients. Violin plots show the distribution of sample values along with median (solid lines) and quartile (broken lines) values. P values in (c) and (e) were calculated using one-way ANOVA with Tukey’s multiple comparisons testing between all groups. *P ≤ 0.05, **P ≤0.01, ***P ≤ 0.001, ****P≤ 0.0001
Figure 3.
Figure 3.. Summary of antibody signatures from COVID-19 patients.
Relative multi-dimensional antibody signatures for each group stratified by disease severity are depicted by radar plots. Each feature, isotype (IgM, IgA, IgG) in blue/purple, IgG subclass (IgG1, IgG2, IgG3 and IgG4) in yellow and % abundance of IgG1 Fc glycoforms (F0N0, GS0, S and N) in red/pink, is depicted as a wedge. The size of the wedges indicates the median of the features, normalized to the corresponding outpatient feature.
Figure 4.
Figure 4.. anti-SARS-CoV2 IgG1 Fc afucosylation varies by sex.
The level of the afucosylated anti-RBD IgG1 was significantly higher in hospitalized males, compared to hospitalized females in two different cohorts from (a) Stanford Hospital Center (n=30, F=14, M=16) (p=0.0007) or (b) Kaiser Permanente Hospitals of Northern California (n=81, M=55, F=26) (p=0.0190). (c) Significant sex associated differences in afucosylation levels of IgG1 were not present in mild COVID-19 (outpatients) (n=27, F=14, M=13). Violin plots in (a), (b) and (c) show the distribution of sample values along with median (solid lines) and quartile (broken lines) values. P values were calculated using a two-tailed unpaired t test with Welch’s correction. *P ≤ 0.05, **P ≤ 0.01, ***P ≤ 0.001, ****P ≤ 0.0001
Figure 5.
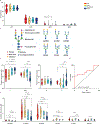
Figure 5.. FcγRIIIa binding by human anti-RBD IgGs with variable Fc fucosylation.
(a) Binding of polyclonal IgGs was determined by biolayer interferometry. The overlay of binding traces for a donor from each group representing varying degree of anti-RBD core afucosylation; low (0–10%), medium (10–20%) and high (>20%) is shown. The kinetic constants were obtained by evaluating the binding at multiple concentrations (3.3 mM followed by 2-fold dilutions) of the analyte as shown (solid circles). The fits are indicated by solid lines. The assay was performed twice and shown are representative traces from one experiment. (b) A strong positive correlation (Pearson correlation coefficient r=0.86) was observed between the apparent dissociation constant (KD,app) of FcγRIIIa (CD16a) and anti-RBD IgG1 core afucosylation in COVID-19 patients (n=13) as determined by biolayer interferometry. The binding of anti-RBD monoclonal antibody, CR3022 with different core afucosylation levels is also shown (red). The mean data and the standard error of the mean (SEM) have been graphed. (c) Correlation between the level of anti-RBD IgG1 Fc afucosylation and binding to FcγRIIIa. Binding of serum antibodies (n=38) to FcγRIIIa correlated positively with the degree of afucosylation (Pearson correlation coefficient r=0.64). Samples were representative of the range of Fc fucosylation over the sample set. (d) Correlation between the level of anti-RBD IgG1 Fc afucosylation and immune complex (IC) mediated NK cell degranulation. The amount of degranulation measured by fold increase of CD107a+ NK cells over control correlated positively with the degree of afucosylation of the anti-RBD IgG (Spearman correlation coefficient r= 0.79). The assay was performed in duplicate with PBMCs from three healthy donors and mean data has been graphed. (e, f) Highly afucosylated immune complexes elicited increased production of inflammatory cytokines IL-6, TNF, and IL-1b. Immune complexes were formed using (e) pooled polyclonal IgGs from COVID patients (IL6: p=0.0081 for 100μg/ml, p <0.0001 for 20μg/ml and p=0.0014 for 4μg/ml. TNF: p= 0.0042 for 100μg/ml, p=0.0004 for 20μg/ml and p= 0.0042 for 4μg/ml. IL-1β: p=0.0068 for 100μg/ml, p=0.0065 for 20μg/ml and p=0.0198 for 4μg/ml) or (f) recombinant IgG1 mAb 3022 with distinct levels of afucosylation) (IL6: p=0.0009 for 10μg/ml, p=0.0001 for 2μg/ml and p=0.0017 for 0.4μg/ml. TNF: p= 0.0022 for 10μg/ml, p=0.0008 for 2μg/ml and p= 0.0022 for 0.4μg/ml. IL-1β: p=0.0152 for 10μg/ml, p=0.0231 for 2μg/ml). The assays were performed in duplicate with monocytes from three healthy donors and mean data and standard error of the mean (SEM) has been graphed. P-values between high and low afucosylated immune complexes at each antibody concentration were calculated by two-tailed paired t-tests. *P ≤ 0.05, **P ≤0.01, ***P ≤ 0.001, ****P ≤ 0.0001

Update of

References

    1. Bournazos S, Wang TT, Dahan R, Maamary J & Ravetch JV Signaling by Antibodies: Recent Progress. Annual review of immunology 35, 285–311 (2017). - PMC - PubMed
    1. Wang TT IgG Fc Glycosylation in Human Immunity. Curr Top Microbiol Immunol (2019). - PMC - PubMed
    1. Nimmerjahn F & Ravetch JV Fc-receptors as regulators of immunity. Advances in immunology 96, 179–204 (2007). - PubMed
    1. Nimmerjahn F & Ravetch JV Divergent immunoglobulin g subclass activity through selective Fc receptor binding. Science 310, 1510–1512 (2005). - PubMed
    1. Liu W et al. Detection of Covid-19 in Children in Early January 2020 in Wuhan, China. The New England journal of medicine 382, 1370–1371 (2020). - PMC - PubMed

Publication types

MeSH terms