Review
. 2020 Dec;23(12):1537-1549.
doi: 10.1038/s41593-020-00734-z. Epub 2020 Nov 9.

Quantifying behavior to understand the brain

Affiliations
Review

Quantifying behavior to understand the brain

Talmo D Pereira et al. Nat Neurosci. 2020 Dec.

Abstract

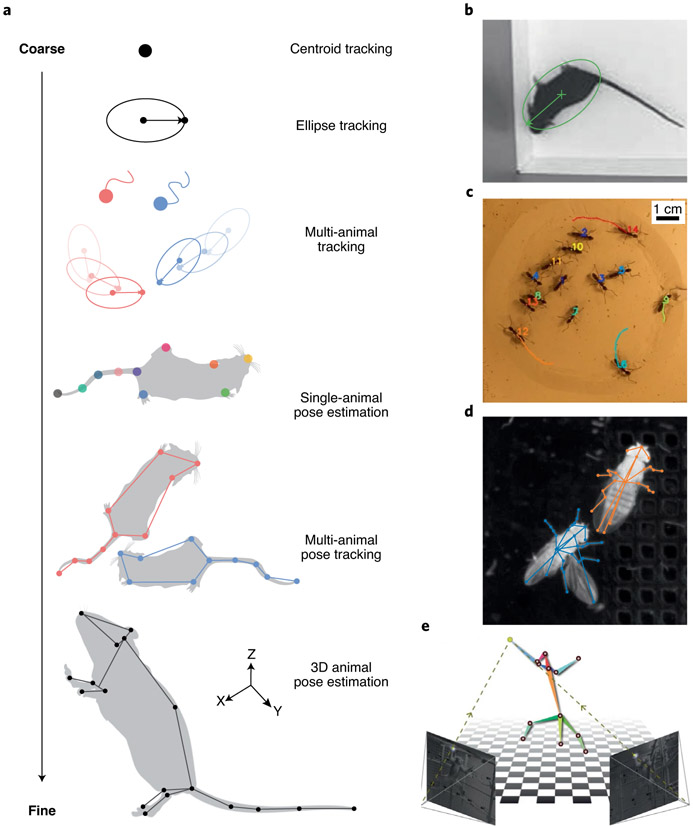
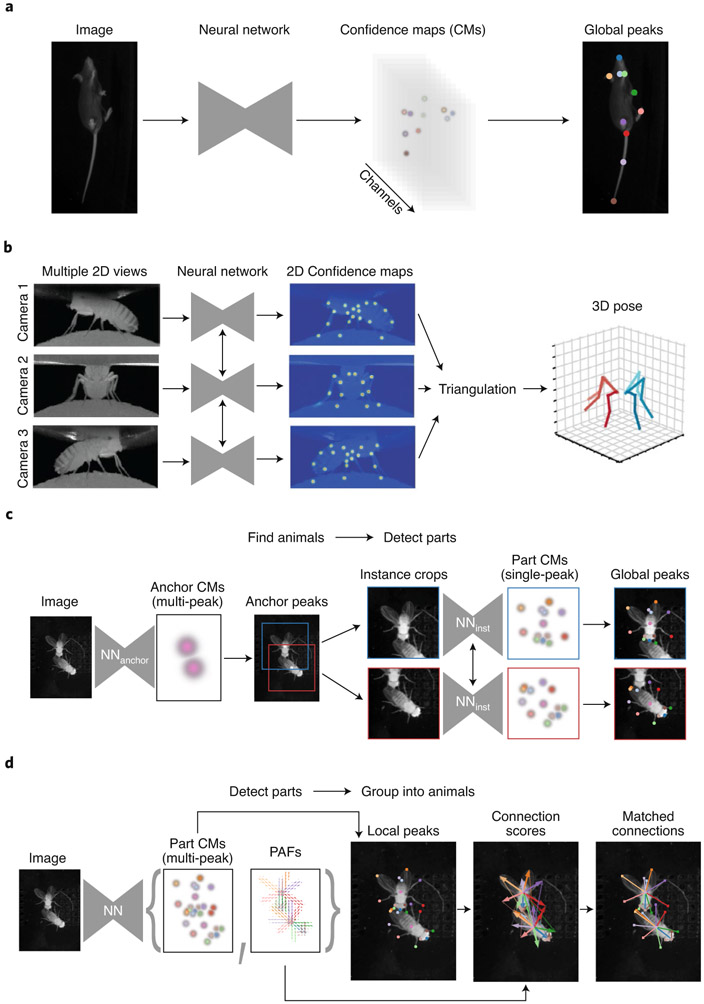
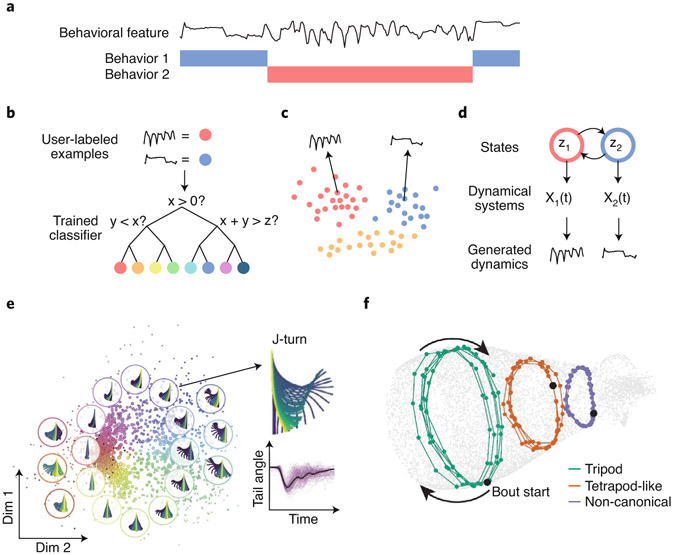
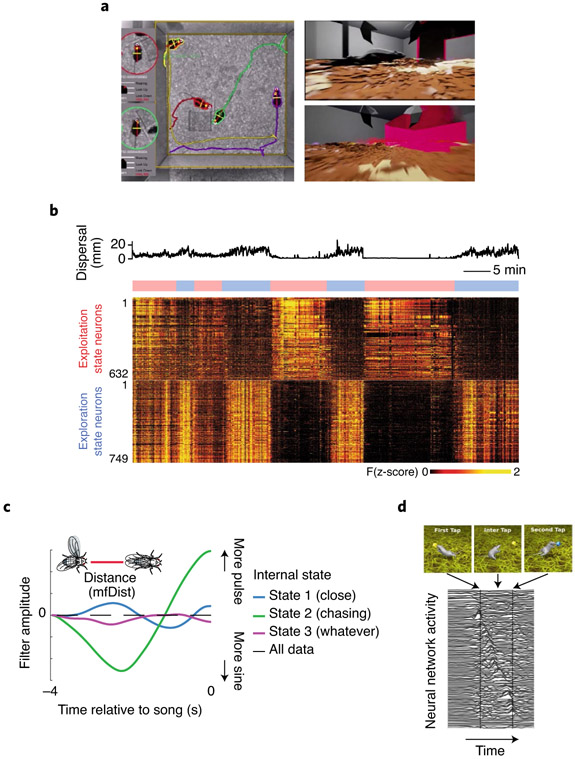
Over the past years, numerous methods have emerged to automate the quantification of animal behavior at a resolution not previously imaginable. This has opened up a new field of computational ethology and will, in the near future, make it possible to quantify in near completeness what an animal is doing as it navigates its environment. The importance of improving the techniques with which we characterize behavior is reflected in the emerging recognition that understanding behavior is an essential (or even prerequisite) step to pursuing neuroscience questions. The use of these methods, however, is not limited to studying behavior in the wild or in strictly ethological settings. Modern tools for behavioral quantification can be applied to the full gamut of approaches that have historically been used to link brain to behavior, from psychophysics to cognitive tasks, augmenting those measurements with rich descriptions of how animals navigate those tasks. Here we review recent technical advances in quantifying behavior, particularly in methods for tracking animal motion and characterizing the structure of those dynamics. We discuss open challenges that remain for behavioral quantification and highlight promising future directions, with a strong emphasis on emerging approaches in deep learning, the core technology that has enabled the markedly rapid pace of progress of this field. We then discuss how quantitative descriptions of behavior can be leveraged to connect brain activity with animal movements, with the ultimate goal of resolving the relationship between neural circuits, cognitive processes and behavior.


Figures

Fig. 1 ∣
Fig. 1 ∣. Tracking, from coarse to fine.
a, Representations extracted by different forms of tracking, ranging from a single point to full 3D pose. b, Single mouse tracked with ellipse and orientation. c, Multi-animal tracking of ants with reliable identity assignment. d, Multi-animal pose tracking of a pair of socially interacting fruit flies. e, 3D pose estimation of a monkey from multiple camera views. Images in a adapted with permission from SciDraw.io or created with BioRender.com; in b from ref. , Nature Publishing Group; in c from ref. , Nature Publishing Group; in e from ref. , Nature Publishing Group.
Fig. 2 ∣
Fig. 2 ∣. Anatomy of pose estimation systems.
a, In single-instance pose estimation, each body-part type is encoded as a confidence map that is predicted by a convolutional neural network given an image as input (left). The network is trained to predict confidence maps (CMs) with only a single peak per channel (middle), enabling the coordinates to be decoded by finding the global peak in each channel of the confidence maps (right). b, The 3D pose estimation system employed in DeepFly3D (ref. ). These systems may use a single neural network (left) to predict 2D confidence maps (middle) for each independent view. These landmarks are then triangulated based on the geometry of the cameras and the consistency of the 2D predictions (right). c, A top-down multi-animal pose estimation system employed in SLEAP. All instances of an ‘anchor part’ are first located by a CNN trained to predict anchor part confidence maps (left). The image is cropped around each anchor (middle) and a CNN trained to predict all part confidence maps is applied to each crop (right). d, A bottom-up multi-animal pose estimation system employed in SLEAP. A single neural network detects all instances of all body parts and simultaneously predicts part affinity fields (PAFs), a representation of the connectivity between body parts (left). The grouping of body parts to the appropriate animals via a matching procedure uses the PAFs to score candidate connections (right). Images in b adapted with permission from ref. , eLife.
Fig. 3 ∣
Fig. 3 ∣. Quantifying behavioral dynamics.
a, A snippet of behavioral dynamics during which two types of behavior occur. Behavior 1 (blue) is characterized by slow, step-like dynamics, whereas behavior 2 (red) is characterized by fast oscillations with sharp peaks. b, In supervised classification, a human first annotates examples of each type of behavior (top). A classifier such as a decision tree will learn criteria to classify new data based on the examples provided (bottom). c, In clustering, examples are grouped by their similarity rather than human annotations. The resulting clusters correspond to distinct behaviors. Points represent short windows of time reduced to two dimensions for visualization. d, In dynamical models, behaviors are represented by states that the model is permitted to transition between (top). These states parametrize the models that generate the state-specific dynamics (middle). The observed dynamics are assumed to come from the model that is most likely to generate similar dynamics (bottom). e, Clusters of zebrafish hunting behaviors based on the similarity of their postural trajectories (depicted within the bubbles). Points correspond to individual bouts after applying nonlinear dimensionality reduction to the zebrafish pose trajectories as a preprocessing step. f, Manifold embedding of fruit fly gait with the cyclical continuous structure of different gait modes highlighted. Note that although this representation does not capture cluster-like structure, it does identify both the phase of gait strides (circles) and a continuous axis of variation that transitions smoothly from slow (non-canonical) to fast (tripod) locomotion. Images in e adapted with permission from ref. , Cell Press; in f from ref. , eLife.
Fig. 4 ∣
Fig. 4 ∣. Approaches to linking brain to behavior.
a, Tracking centroids and orientations of animals enables the reconstruction of their sensory inputs by simulating a first-person view of their environment. b, Zebrafish tracking and whole-brain imaging during hunting behavior shows how representations of internal states (exploration vs exploitation) are revealed when aligning to behavioral data. c, Model of courting flies captures the shape and timescale of visual sensory inputs (mfDist; distance between animals) that predicts behavioral output (courtship song) modulated by internal state. d, An ANN can learn to control a simulated rat via motor commands to perform a tapping task. Top: rendering of the simulated rat performing the task. Bottom: latent representations learned by the ANN that is used to drive the behavior. Images in a adapted with permission from ref. , Nature Publishing Group; in b from ref. , Nature Publishing Group; in c from ref. , Nature Publishing Group; in d from ref. , arXiv.

References

    1. Branson K, Robie AA, Bender J, Perona P & Dickinson MH High-throughput ethomics in large groups of Drosophila. Nat. Methods 6, 451–457 (2009). - PMC - PubMed
    1. Geuther BQ et al. Robust mouse tracking in complex environments using neural networks. Commun Biol 2, 124 (2019). - PMC - PubMed
    1. Anderson DJ & Perona P Toward a science of computational ethology. Neuron 84, 18–31 (2014). - PubMed
    1. Robie AA, Seagraves KM, Egnor SER & Branson K Machine vision methods for analyzing social interactions. J. Exp. Biol 220, 25–34 (2017). - PubMed
    1. Sridhar VH, Roche DG & Gingins S Tracktor: image-based automated tracking of animal movement and behaviour. Methods Ecol. Evol 10, 815–820 (2019).

Publication types