. 2020;156(1):18.
doi: 10.1186/s41937-020-00062-w. Epub 2020 Nov 4.

Tracking inflation on a daily basis

Affiliations

Tracking inflation on a daily basis

Santiago E Alvarez et al. Swiss J Econ Stat. 2020.

Abstract

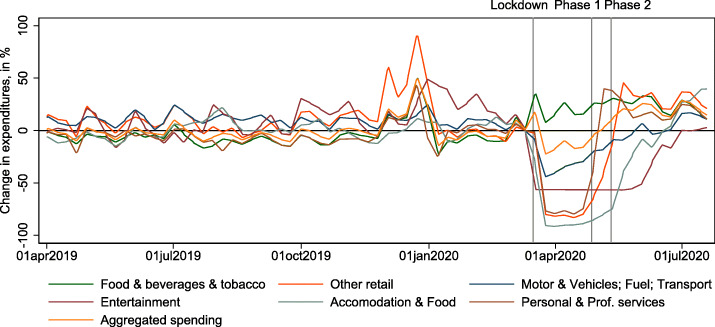
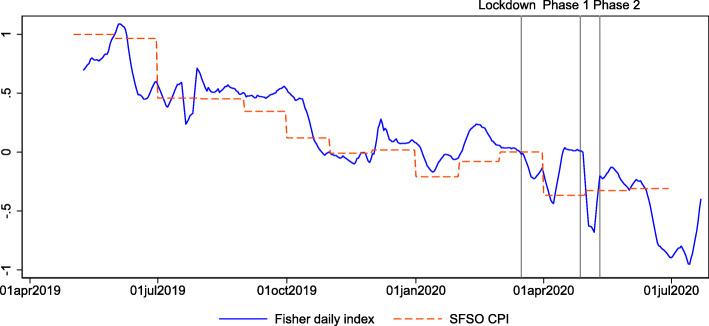
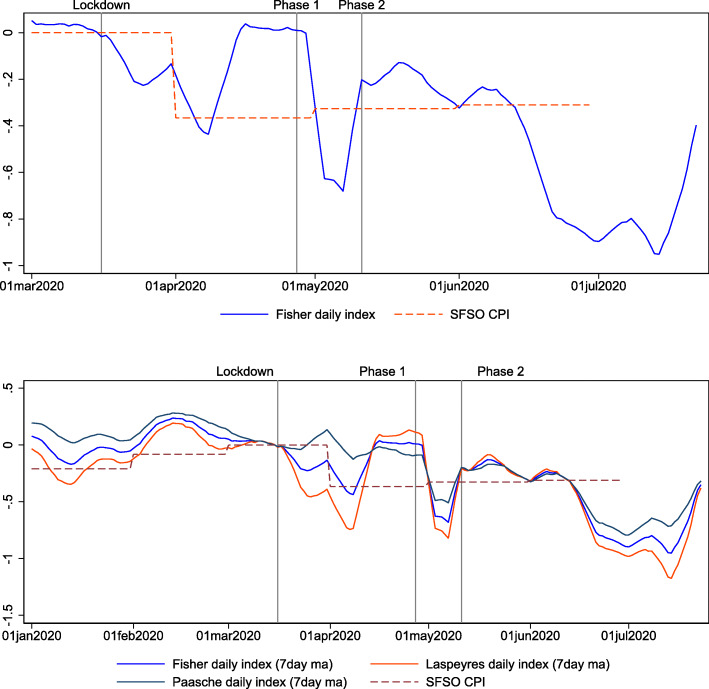
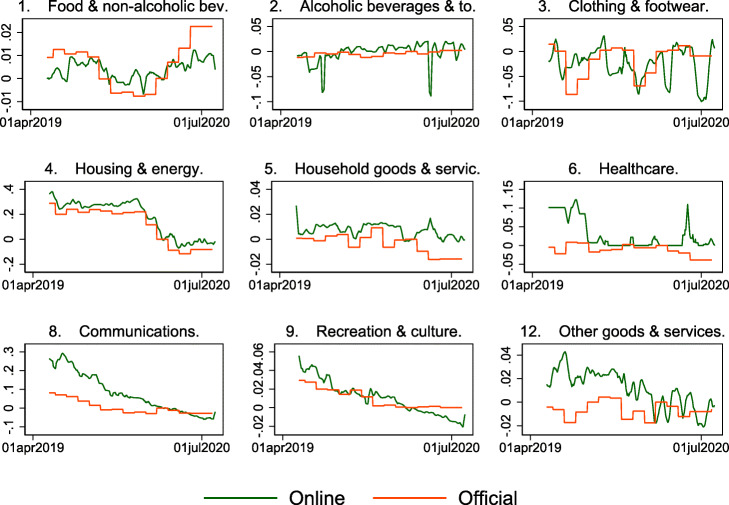
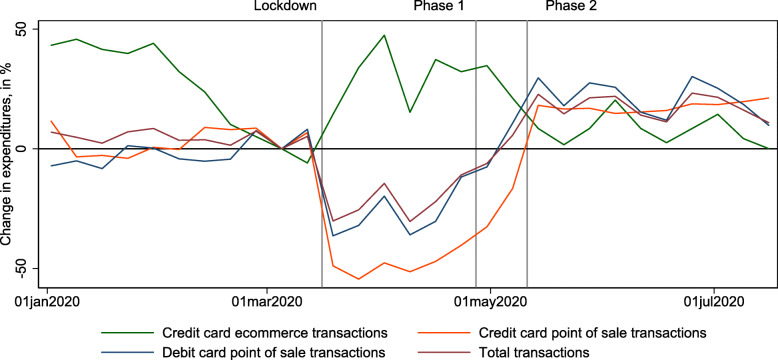
Using online data for prices and real-time debit card transaction data on changes in expenditures for Switzerland allows us to track inflation on a daily basis. While the daily price index fluctuates around the official price index in normal times, it drops immediately after the lockdown related to the COVID19 pandemic. Official statistics reflect this drop only with a lag, specifically because data collection takes time and is impeded by lockdown conditions. Such daily real-time information can be useful to gauge the relative importance of demand and supply shocks and thus inform policymakers who need to determine appropriate policy measures.

Keywords: Daily price index; Debit card expenditures; Real-time information; Scraped online price data.


Conflict of interest statement

Competing interestsNone.

Figures

Fig. 1
Fig. 1
Changes in expenditures by category. This figure shows the 7-day moving averages of weekly deviations of total expenditures by category, relative to the week before March 16, 2020, the date of the lockdown in Switzerland. The vertical lines indicate the dates of the lockdown (March 16, 2020) and the phases of reopening (April 27, 2020, and May 11, 2020). Aggregated spending is the sum of all components shown here. Data source: http://monitoringconsumption.org/switzerland
Fig. 2
Fig. 2
Daily price indexes from May 2019 to July 2020. This figure shows the Fisher price index based on daily online prices and daily credit card expenditures (blue solid line; 7-day lagged moving average) and the official monthly CPI (red dashed line). The vertical lines indicate the dates of the lockdown (March 16, 2020) and the two phases of reopening (April 27, 2020, and May 11, 2020). The figure spans the period May 1, 2019, to July 23, 2020
Fig. 3
Fig. 3
Daily price indexes in 2020. The upper panel in this figure shows the Fisher price index based on daily online prices and daily credit card expenditures (blue solid line; 7-day lagged moving average) and the official monthly CPI (red dashed line) around the lockdown and reopening period. The lower panel shows the Fisher (blue), Laspeyres (red), and Paasche (gray) indexes during the lockdown and reopening periods together with the official monthly CPI (red dashed line). The vertical lines indicate the dates of the lockdown (March 16, 2020) and the two phases of reopening (April 27, 2020, and May 11, 2020). The figure spans the period May 1, 2019, to July 23, 2020
Fig. 4
Fig. 4
Relationship between the change in prices and change in expenditures during the lockdown. This figure shows a scatter plot of the change in average expenditures and average change in prices during the lockdown period from March 16, 2020, to May 11, 2020
Fig. 5
Fig. 5
Share of price adjustments. This figure shows the fraction of price increases and decreases (as a share of all prices observed) on a weekly basis (that is, a price change is observed if a price changes from 1 week to the next). Red bars are price decreases, and blue bars price increases. The bars are stacked, such that the total length of the bar indicates the total fraction of price changes per week. LD, P1, and P2, stand for lockdown, phase 1, and phase 2, respectively
Fig. 6
Fig. 6
Share of price adjustments by category. This figure shows the fraction of price increases and decreases (as a share of all prices observed) on a weekly basis (that is, a price change is observed if a price changes from 1 week to the next) for selected product categories. Red bars are price decreases, and blue bars price increases. The bars are stacked, such that the total length of the bar indicates the total fraction of price changes per week. LD, P1, and P2, stand for lockdown, phase 1, and phase 2, respectively
Fig. 7
Fig. 7
Only matched positions aggregated at SFSO category level 2. This figure shows the official and online inflations aggregated at SFSO category level 2 keeping only the lower-level positions available online. Constant official weights for 2020 used
Fig. 8
Fig. 8
Size of price adjustments. This figure shows the average nonzero size of price adjustments. LD, P1, and P2, stand for lockdown, phase 1, and phase 2, respectively
Fig. 9
Fig. 9
Size of price adjustments by category. This figure shows the average nonzero size of price adjustments by product category. LD, P1, and P2 stand for lockdown, phase 1, and phase 2, respectively
Fig. 10
Fig. 10
Changes in expenditures by transaction type. This figure shows weekly deviations of total expenditures by transaction type, relative to the week before March 16, 2020, the date of the lockdown in Switzerland. The vertical lines indicate the dates of the lockdown (March 16, 2020) and the phases of reopening (April 27, 2020, and May 11, 2020). Data source: http://monitoringconsumption.org/switzerland

References

    1. Alvarez, S.E. (2020). Online price dynamics: mimeo, University of Basel.
    1. Andersen, A.L., Hansen, E.T., Johannesen, N., Sheridan, A. (2020). Consumer responses to the COVID-19 crisis: Evidence from bank account transaction data. Discussion Paper 14809, CEPR. - PMC - PubMed
    1. Auer, R., Burstein, A.T., Lein, S.M. (2018). Exchange rates and prices: Evidence from the 2015 Swiss franc appreciation. Working Paper 751, BIS.
    1. Baker, S.R., Farrokhnia, R., Meyer, S., Pagel, M., Yannelis, C. (2020). How does household spending respond to an epidemic? Consumption during the 2020 COVID-19 pandemic. Working Paper 26949, National Bureau of Economic Research.
    1. Baldwin, R., & Weder di Mauro, B. (2020). Economics in the Time of COVID-19, a VoxEU.org eBook. CEPR Press.

LinkOut - more resources