. 2020 Jan-Dec:29:963689720929313.
doi: 10.1177/0963689720929313.

Human Umbilical Cord-Derived Mesenchymal Stem Cell Therapy Effectively Protected the Brain Architecture and Neurological Function in Rat After Acute Traumatic Brain Injury

Affiliations

Human Umbilical Cord-Derived Mesenchymal Stem Cell Therapy Effectively Protected the Brain Architecture and Neurological Function in Rat After Acute Traumatic Brain Injury

Kuan-Hung Chen et al. Cell Transplant. 2020 Jan-Dec.

Abstract

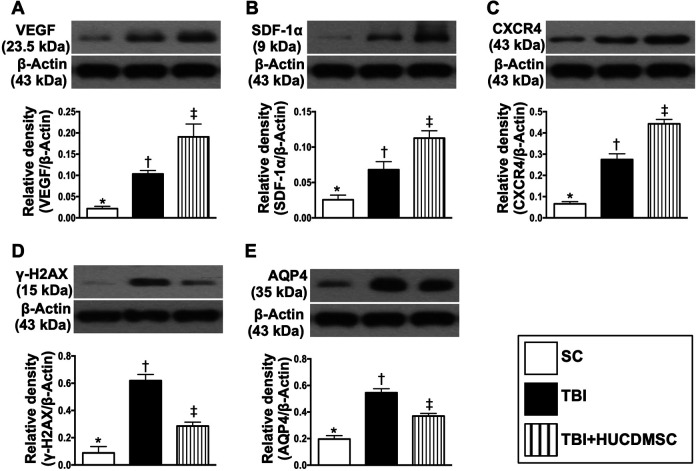
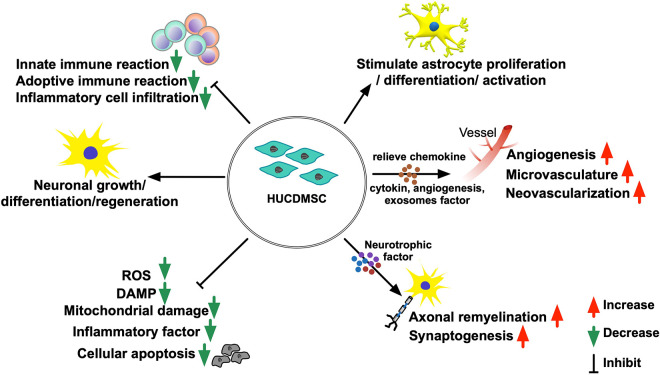
Intracranial hemorrhage from stroke and head trauma elicits a cascade of inflammatory and immune reactions detrimental to neurological integrity and function at cellular and molecular levels. This study tested the hypothesis that human umbilical cord-derived mesenchymal stem cell (HUCDMSC) therapy effectively protected the brain integrity and neurological function in rat after acute traumatic brain injury (TBI). Adult male Sprague-Dawley rats (n = 30) were equally divided into group 1 (sham-operated control), group 2 (TBI), and group 3 [TBI + HUCDMSC (1.2 × 10⁶ cells/intravenous injection at 3 h after TBI)] and euthanized by day 28 after TBI procedure. The results of corner test and inclined plane test showed the neurological function was significantly progressively improved from days 3, 7, 14, and 28 in groups 1 and 3 than in group 2, and group 1 than in group 3 (all P < 0.001). By day 28, brain magnetic resonance imaging brain ischemic volume was significantly increased in group 2 than in group 3 (P < 0.001). The protein expressions of apoptosis [mitochondrial-bax positive cells (Bax)/cleaved-caspase3/cleaved-poly(adenosine diphosphate (ADP)-ribose) polymerase], fibrosis (Smad3 positive cells (Smad3)/transforming growth factor-β), oxidative stress (NADPH Oxidase 1 (NOX-1)/NADPH Oxidase 2 (NOX-2)/oxidized-protein/cytochrome b-245 alpha chain (p22phox)), and brain-edema/deoxyribonucleic acid (DNA)-damaged biomarkers (Aquaporin-4/gamma H2A histone family member X ( (γ-H2AX)) displayed an identical pattern to neurological function among the three groups (all P < 0.0001), whereas the protein expressions of angiogenesis biomarkers (vascular endothelial growth factor/stromal cell-derived factor-1α/C-X-C chemokine receptor type 4 (CXCR4)) significantly increased from groups 1 to 3 (all P < 0.0001). The cellular expressions of inflammatory biomarkers (cluster of differentiation 14 (+) cells (CD14+)/glial fibrillary acidic protein positive cells (GFAP+)/ a member of a new family of EGF-TM7 molecules positive cells (F4/80+)) and DNA-damaged parameter (γ-H2AX) exhibited an identical pattern, whereas cellular expressions of neural integrity (hexaribonucleotide Binding Protein-3 positive cells (NeuN+)/nestin+/doublecortin+) exhibited an opposite pattern of neurological function among the three groups (all P < 0.0001). Xenogeneic HUCDMSC therapy was safe and it significantly preserved neurological function and brain architecture in rat after TBI.

Keywords: apoptosis; inflammation; neurological function; oxidative stress; traumatic brain injury; xenogeneic cell therapy.


Conflict of interest statement

Declaration of Conflicting Interests: The author(s) declared no potential conflicts of interest with respect to the research, authorship, and/or publication of this article.

Figures

Fig. 1.
Fig. 1.
The time courses of neurological function after TBI. (A) The mortality rate did not differ among the three groups, P > 0.1. (B) Illustrating the inclined plane test for determining limb motor function on days 0, 3, 7, 14, and 28 after acute TBI procedure. (C) Statistical analysis by day 0, P = 1. Statistical analysis by day 3 (*) vs. other groups with different symbols (†, ‡), P < 0.001. Statistical analysis by day 7 (*) vs. other groups with different symbols (†, ‡), P < 0.001. Statistical analysis by day 14 (*) vs. other groups with different symbols (†, ‡), P < 0.001. Statistical analysis by day 28 (*) vs. other groups with different symbols (†, ‡), P < 0.001. (D) Illustrating the corner test for determining limb motor function on days 0, 3, 7, 14, and 28 after TBI procedure. (E) Statistical analysis by day 0, P > 0.5. Statistical analysis by day 3 (*) vs. other groups with different symbols (†, ‡), P < 0.001. Statistical analysis by day 7 (*) vs. other groups with different symbols (†, ‡), P < 0.001. Statistical analysis by day 14 (*) vs. other groups with different symbols (†, ‡), P < 0.001. Statistical analysis by day 28 (*) vs. other groups with different symbols (†, ‡), P < 0.001. All statistical analyses were performed by one-way ANOVA, followed by Bonferroni multiple comparison post hoc test (n = 10 for each group). Symbols (*, †, ‡) indicate significance (at 0.05 level). ANOVA: analysis of variance; HUCDMSC: human umbilical cord–derived mesenchymal stem cell; SC: sham control; TBI: traumatic brain injury.
Fig. 2.
Fig. 2.
Brain MRI findings and protein inflammatory biomarkers at day 28 after TBI induction. (A, B) Illustrating the brain MRI findings for identification of brain ischemic region (whitish color). The yellow dotted lines indicated the brain ischemic region. A-1 to A-4 indicated serial coronal sections of MRI findings in one TBI animal. B-1 to B-4 indicated serial coronal sections of MRI findings in one TBI animal treated by HUCDMSCs. (C) Analytical result of ratio of left brain ischemic volume (BIV) to left hemispheric brain volume by day 28 after TBI procedure (n = 4 for each group), * vs. †, P < 0.001. (D) Analytical result of ratio of left BIV to whole brain volume by day 28 after TBI procedure (n = 4 for each group), * vs. †, P < 0.001. (E) Analytical result of ratio of left brain volume to right brain volume by day 28 after TBI procedure (n = 4 for each group), * vs. †, P < 0.001. (F) Protein expression of high-mobility group protein 1 (HMG-1; *) vs. other groups with different symbols (†, ‡), P < 0.001. (G) Protein expression of toll-like receptor (TLR)-4 (*) vs. other groups with different symbols (†, ‡), P < 0.001. (H) Protein expression of interleukin (IL)-1β (*) vs. other groups with different symbols (†, ‡), P < 0.001. (I) Protein expression of induced nitric oxide synthase (iNOS; *) vs. other groups with different symbols (†, ‡), P < 0.001. All statistical analyses were performed by one-way ANOVA, followed by Bonferroni multiple comparison post hoc test (n = 4 or 6 for each group). Symbols (*, †, ‡) indicate significance (at 0.05 level). ANOVA: analysis of variance; HUCDMSC: human umbilical cord–derived mesenchymal stem cell; MRI: magnetic resonance imaging; SC: sham control; TBI: traumatic brain injury; vol: volume.
Fig. 3.
Fig. 3.
Protein expressions of oxidative stress and mitochondrial damage by day 28 after TBI. (A) Protein expression of NOX-1 (*) vs. other groups with different symbols (†, ‡), P < 0.001. (B) Protein expression of NOX-2 (*) vs. other groups with different symbols (†, ‡), P < 0.0001. (C) Oxidized protein expression (*) vs. other groups with different symbols (†, ‡), P < 0.0001. (Note: Left and right lanes shown on the upper panel represent protein molecular weight marker and control oxidized molecular protein standard, respectively). (D) Protein expression of p22phox (*) vs. other groups with different symbols (†, ‡), P < 0.001. (E) Protein expression of mitochondrial cytochrome C (mit-Cyto-C; *) vs. other groups with different symbols (†, ‡), P < 0.001. All statistical analyses were performed by one-way ANOVA, followed by Bonferroni multiple comparison post hoc test (n = 6 for each group). Symbols (*, †, ‡) indicate significance (at 0.05 level). ANOVA: analysis of variance; DNP: 1,3-dinitrophenylhydrazone; HUCDMSC: human umbilical cord–derived mesenchymal stem cell; M.W.: molecular weight; NOX: NADPH Oxidase; SC: sham control; TBI: traumatic brain injury.
Fig. 4.
Fig. 4.
Protein expressions of apoptotic, fibrotic, and antifibrotic biomarkers by day 28 after TBI. (A) Protein expression of mitochondrial (mito)-Bax (*) vs. other groups with different symbols (†, ‡), P < 0.001. (B) Protein expression of cleaved caspase 3 (c-Csp3; *) vs. other groups with different symbols (†, ‡), P < 0.0001. (C) Protein expression of cleaved-poly(ADP-ribose) polymerase (c-PARP; *) vs. other groups with different symbols (†, ‡), P < 0.0001. (D) Protein expression of Smad3 (*) vs. other groups with different symbols (†, ‡), P < 0.0001. (E) Protein expression of transforming growth factor (TGF)-β (*) vs. other groups with different symbols (†, ‡), P < 0.0001. (F) Protein expression of Smad1/5 (*) vs. other groups with different symbols (†, ‡), P < 0.0001. (G) Protein expression of bone morphogenetic protein (BMP-2; *) vs. other groups with different symbols (†, ‡), P < 0.0001. All statistical analyses were performed by one-way ANOVA, followed by Bonferroni multiple comparison post hoc test (n = 6 for each group). Symbols (*, †, ‡) indicate significance (at 0.05 level). ADP: denosine diphosphate; ANOVA: analysis of variance; Bax: BCL2-associated X protein; DNP: 1,3-dinitrophenylhydrazone; HUCDMSC: human umbilical cord–derived mesenchymal stem cell; SC: sham control; Smad: Smad3 positive cells; TBI: traumatic brain injury.
Fig. 5.
Fig. 5.
Protein expressions of angiogenesis, brain edema, and deoxyribonucleic acid–damaged biomarkers by day 28 after TBI. (A) Protein expression of vascular endothelial progenitor cell (VEGF; *) vs. other groups with different symbols (†, ‡), P < 0.0001. (B) Protein expression of stromal cell–derived factor (SDF)-1α (*) vs. other groups with different symbols (†, ‡), P < 0.0001. (C) Protein expression of CXCR4 (*) vs. other groups with different symbols (†, ‡), P < 0.0001. (D) Protein expression of γ-H2AX (*) vs. other groups with different symbols (†, ‡), P < 0.0001. (E) Protein expression of Aquaporin-4 (AQP4; *) vs. other groups with different symbols (†, ‡), P < 0.001. All statistical analyses were performed by one-way ANOVA, followed by Bonferroni multiple comparison post hoc test (n = 6 for each group). Symbols (*, †, ‡) indicate significance (at 0.05 level). ANOVA: analysis of variance; CXCR4: C-X-C chemokine receptor type 4; γ-H2AX: gamma H2A histone family member X; HUCDMSC: human umbilical cord–derived mesenchymal stem cell; SC: sham control; TBI: traumatic brain injury.
Fig. 6.
Fig. 6.
Inflammatory cell expressions in brain ischemic zone by day 28 after TBI. (A–C) Illustrating the immunofluorescent (IF) microscopic finding (400×) for identification of cellular expression of CD11 (green color). Blue color indicated DAPI staining for identifying the nuclei. Red color in (C) indicated the implanted dye-tracking HUCDMSC and fragmentations. (D) Analytical results of the number of CD11+ cells (*) vs. other groups with different symbols (†, ‡), P < 0.0001. (E–G) Illustrating the IF microscopic finding (400×) for identification of cellular expression of F4/80 (green color). Blue color indicated DAPI staining for identifying the nuclei. Red color in (G) indicated the implanted dye-tracking HUCDMSC and fragmentations. (H) Analytical results of the number of F4/80+ cells (*) vs. other groups with different symbols (†, ‡), P < 0.0001. (I–K) Illustrating the IF microscopic finding (400×) for identification of cellular expression of glial fibrillary acid protein (GFAP; green color). Blue color indicated DAPI staining for identifying the nuclei. Red color in (K) indicated the implanted dye-tracking HUCDMSC and fragmentations. (L) Analytical results of the number of GFAP+ cells (*) vs. other groups with different symbols (†, ‡), P < 0.0001. Scale bars in right lower corner represent 20 µm. All statistical analyses were performed by one-way ANOVA, followed by Bonferroni multiple comparison post hoc test (n = 6 for each group). Symbols (*, †, ‡) indicate significance (at 0.05 level). ANOVA: analysis of variance; CD: cluster of differentiation; DAPI: 4′,6-diamidino-2-phenylindole; F4/80: a member of a new family of EGF-TM7 molecules positive cells; HUCDMSC: human umbilical cord–derived mesenchymal stem cell; SC: sham control; TBI: traumatic brain injury.
Fig. 7.
Fig. 7.
Cellular expressions of deoxyribonucleic acid–damaged and neural integrity biomarkers in brain ischemic zone by day 28 after TBI. (A–C) Illustrating the immunofluorescent (IF) microscopic finding (400×) for identification of cellular expression of γ-H2AX (green color). Blue color indicated DAPI staining for identifying the nuclei. Red color in (C) indicated the implanted dye-tracking HUCDMSC and fragmentations. (D) Analytical results of the number of γ-H2AX+ cells (*) vs. other groups with different symbols (†, ‡), P < 0.0001. (E–G) Illustrating the IF microscopic finding (400×) for identification of cellular expression of NeuN (green color). Blue color indicated DAPI staining for identifying the nuclei. Red color in (G) indicated the implanted dye-tracking HUCDMSC and fragmentations. (H) Analytical results of the number of NeuN+ cells (*) vs. other groups with different symbols (†, ‡), P < 0.0001. (I–K) Illustrating the IF microscopic finding (400×) for identification of cellular expression of nestin (green color). Blue color indicated DAPI staining for identifying the nuclei. Red color in (K) indicated the implanted dye-tracking HUCDMSC and fragmentations. (L) Analytical results of the number of nestin+ cells (*) vs. other groups with different symbols (†, ‡), P < 0.0001. (M–O) Illustrating the IF microscopic finding (400×) for identification of cellular expression of doublecortin (green color). Blue color indicated DAPI staining for identifying the nuclei. (P) Analytical results of the number of doublecortin+ cells (*) vs. other groups with different symbols (†, ‡), P < 0.0001. Scale bars in right lower corner represent 20 µm. All statistical analyses were performed by one-way ANOVA, followed by Bonferroni multiple comparison post hoc test (n = 6 for each group). Symbols (*, †, ‡) indicate significance (at 0.05 level). ANOVA: analysis of variance; DAPI: 4′,6-diamidino-2-phenylindole; γ-H2AX: gamma H2A histone family member X; HUCDMSC: human umbilical cord–derived mesenchymal stem cell; NeuN: hexaribonucleotide Binding Protein-3 positive cells; SC: sham control; TBI: traumatic brain injury.
Fig. 8.
Fig. 8.
The proposed schematic mechanism underlying the positive therapeutic effect of HUCDMSC on improving the outcome in TBI rat. DAMP: damaged associated molecular pattern; HUCDMSC: human umbilical cord–derived mesenchymal stem cell; ROS: reactive oxygen species; TBI: traumatic brain injury.

Similar articles

Cited by

References

    1. Donnan GA, Fisher M, Macleod M, Davis SM. Stroke. Lancet. 2008;371(9624):1612–1623. - PubMed
    1. Hu HH, Sheng WY, Chu FL, Lan CF, Chiang BN. Incidence of stroke in Taiwan. Stroke. 1992;23(9):1237–1241. - PubMed
    1. Hung TP. [Clinical aspects of cerebral hemorrhage]. Taiwan Yi Xue Hui Za Zhi. 1988;87(3):261–723. - PubMed
    1. Carlo DA. Human and economic burden of stroke. Age Ageing. 2009;38(1):4–5. - PubMed
    1. Masdeu JC, Rubino FA. Management of lobar intracerebral hemorrhage: medical or surgical. Neurol. 1984;34(3):381–383. - PubMed

Publication types

MeSH terms