Review
. 2021 Jan 7;50(1):556-568.
doi: 10.1039/d0cs00855a. Epub 2020 Nov 10.

Spatially offset Raman spectroscopy for biomedical applications

Affiliations
Review

Spatially offset Raman spectroscopy for biomedical applications

Fay Nicolson et al. Chem Soc Rev. .

Abstract

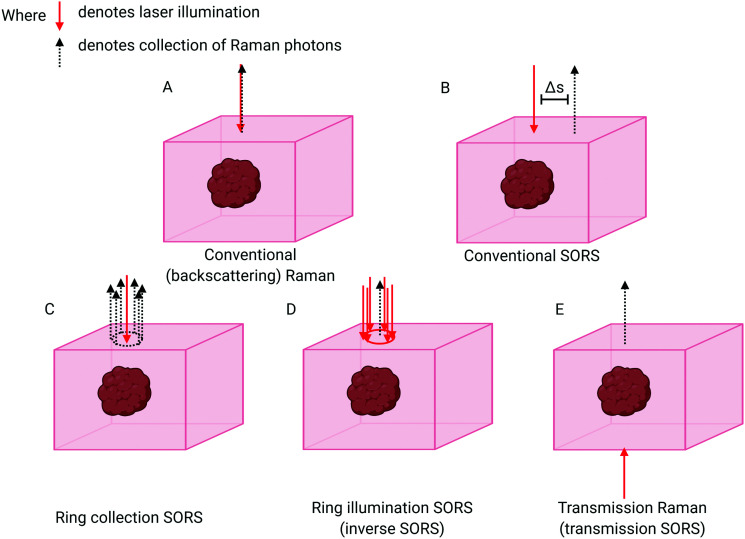
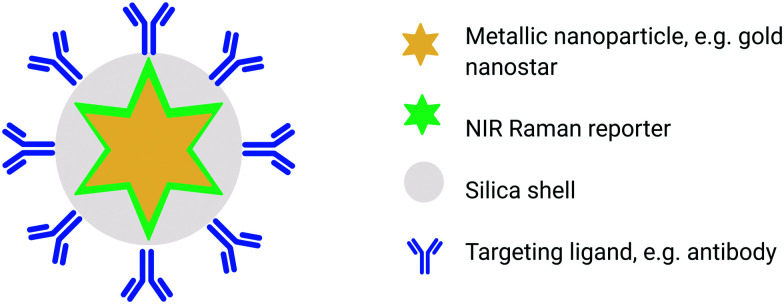
In recent years, Raman spectroscopy has undergone major advancements in its ability to probe deeply through turbid media such as biological tissues. This progress has been facilitated by the advent of a range of specialist techniques based around spatially offset Raman spectroscopy (SORS) to enable non-invasive probing of living tissue through depths of up to 5 cm. This represents an improvement in depth penetration of up to two orders of magnitude compared to what can be achieved with conventional Raman methods. In combination with the inherently high molecular specificity of Raman spectroscopy, this has therefore opened up entirely new prospects for a range of new analytical applications across multiple fields including medical diagnosis and disease monitoring. This article discusses SORS and related variants of deep Raman spectroscopy such as transmission Raman spectroscopy (TRS), micro-SORS and surface enhanced spatially offset Raman spectroscopy (SESORS), and reviews the progress made in this field during the past 5 years including advances in non-invasive cancer diagnosis, monitoring of neurotransmitters, and assessment of bone disease.


Conflict of interest statement

M. F. K. has several issued and pending patents in the field of SE(R)RS nanoparticles and instrumentation, and is co-founder of RIO Imaging, Inc., a startup company aiming at translating SERRS nanoparticles into the clinic (which did not contribute financially to this work). PM and NS have several issued and pending patents in the field of SORS and related areas.

Figures

Fig. 1
Fig. 1. Schematic comparing different SORS approaches with conventional Raman. (A) Conventional backscattering Raman: laser excitation and Raman photon collection take place at the same point. (B) Conventional SORS: the point of collection is offset from the point of excitation by a spatial offset of Δs. (C) Ring collection SORS. The Raman photons are collected in a circular array around the point of excitation. (D) Ring illumination SORS: the laser illumination zone is in the shape of a ring and Raman photons are collected at the centre of the ring. (E) Transmission Raman: the laser excitation and the Raman collection zone are separated to the extreme. Raman collection takes place on the opposite side to laser illumination.
Fig. 2
Fig. 2. Conceptual figure outlining the design of SE(R)RS NPs for in vivo applications. SE(R)RS NPs typically consist of a gold core, e.g. star which is then functionalised with a Raman reporter molecule and encapsulated in a thin silica shell. Active targeting is achieved through the use of a specific targeting ligands such as antibodies.
Fig. 3
Fig. 3. Representative images of 3D printed bone scaffolds. (A) Graphical drawing of the DMD-based SORS instrument used to image the bone scaffolds. Abbreviations are as follows; OBJ, objective; IOM, inverted optical microscope; MSC, microscope side-port camera; DCM, dichroic mirror; LCF, laser clean filter; NDL, 20 mW, 532 nm Nd:YAG diode laser; DMD, digital micro-mirror device; DRC, DMD inspection camera; NF, notch filter; SP, spectrometer; CCD, charge couple device detector. The red circles in the magnified images (i) and (ii) refer to the position corresponding to the focused laser on the sample, and on the sample-conjugate plane of the DMD (equivalent to a zero spatial offset). (i) Displays a DMD pattern for a standard confocal Raman measurement and (ii) shows a possible SORS configuration. (B) Micro-CT 3D reconstruction image of polycaprolactone (PCL) and hydroxyapatite (HA) scaffold PCL : HA 1 : 4 with dimensions 10 × 10 × 5 mm, porosity = 64.7%. (C) Images from dissecting microscope of a PCL : HA (1 : 4) scaffold (D) scanning electron microscopy of a PCL : HA scaffold with 1 : 2 blend ratio. (E) Conceptual diagram of the head of a femur with a critical defect drilled into it. The scaffold is then inserted into the defect. (F) Conceptual close up of the bone defect filled with a PCL scaffold. Adapted from ref. 83 and 84 with permission from The Optical Society, copyright 2016 and 2019.
Fig. 4
Fig. 4. Ex vivo detection of 100 μM serotonin through the skull of a mouse using SESORS. A SORS spectrum of the mouse brain through the intact skull without the injection of serotonin or gold NPs (top spectrum, blue). A SESORS spectrum of the mouse brain following the injection of 100 μM serotonin at a 0 mm offset (red) and a 1 mm offset (green). The SORS spectrum of the mouse brain before the injection of NPs was subtracted from the offset spectra. Data was acquired using a laser wavelength of 785 nm, 90 mW, t = 120 s. The SERS spectrum of 100 μM serotonin on AuNPs at pH 2, 785 nm, 5 mW, t = 30 s (purple). Reproduced from ref. 92 with permission from the Royal Society of Chemistry, copyright 2020.
Fig. 5
Fig. 5. Conceptual figure describing the transmission Raman experimental set-up. Reproduced from ref. 31 with permission from John Wiley & Sons, copyright 2018.
Fig. 6
Fig. 6. 3D margin assessment of breast specimens using automated depth-averaged Raman spectroscopy. (A) Photograph of the breast specimen which includes fatty margins. (B) Margins of the specimen as rendered by the 3D-scanner. (C) H&E section from a biopsy spot taken from the fatty margin (10× magnification). (D–F) Describe the corresponding figures for a breast specimen with fibroadenomatoid margins. (F) An increase in fibro-epithelial composition can be observed at a depth of 0.5–1.5 mm from the margin. Reproduced from ref. 101 with permission from Nature Research, copyright 2017.
Fig. 7
Fig. 7. (A and B) A false colour xy-2D heat SESORRS map of MTS containing SERRS NPs through 15 mm of tissue using a handheld spectrometer. Mapping was performed using a 3 mm step size to create an image of 7 × 7 pixels. (C and D) PC scores plots discriminating between single SERRS NP flavours and a triplex of all three SERRS flavours within (C) MTS and (D) solution through 10 mm of porcine tissue. Distinct separation is observed in both score plots. All measurements were carried out using a 2 s integration time, 5 accumulations, 830 nm laser excitation wavelength. Adapted from ref. 105 and 106 with permission from the Royal Society of Chemistry, copyright 2018.
Fig. 8
Fig. 8. Prediction of paracetamol depth in a turbid matrix using conventional SORS and transmission Raman measurements. Results show conventional SORS and transmission Raman predicted vs. measured depth of paracetamol buried at depths of 3, 9 and 12 mm. Measurements were acquired using 20 s integration time, 5 accumulations and a laser output power of 200 mW (830 nm). Reproduced from ref. 67 with permission from the American Chemical Society, copyright 2019.
Fig. 9
Fig. 9. In vivo SESORRS imaging of glioblastoma multiforme through the intact skull of mouse. (A) Conceptual figure demonstrating the SORS set-up. (B) 2D axial T2-weighted MRI taken 4 weeks post injection of DF-1 cells which induce the growth of GBM in vivo. MRI confirms the presence of a left frontal tumour (outlined in red). MR Images were acquired using a slice thickness of 0.7 mm taken at a depth of 3.6 mm. (C) The SORS heatmap of the SERRS NPs was superimposed onto the SORS heat map of bone with the SESORRS image delineating the tumour margin in agreement with the MR image. (D) H&E stained 5 μM section of the brain. The arrows correspond to areas of the slice which represent healthy tissue (E) and unhealthy tissue (F). Images in (E and F) were taken at 40× magnification. SORS measurements were acquired by utilizing a power density of 13.8 mW mm−2 (785 nm), a spatial offset of 2.5 mm, 3 s integration time, 5 acquisitions. Reproduced from ref. 34 with permission from Ivyspring International Publisher, copyright 2019.
None
Fay Nicolson
None
Moritz F. Kircher
None
Nick Stone
None
Pavel Matousek

References

    1. Pysz M. A. Gambhir S. S. Willmann J. K. Clin. Radiol. 2010;65:500–516. doi: 10.1016/j.crad.2010.03.011. - DOI - PMC - PubMed
    1. Kircher M. F. Willmann J. K. Radiology. 2012;263:633–643. doi: 10.1148/radiol.12102394. - DOI - PMC - PubMed
    1. Stevens O. Iping Petterson I. E. Day J. C. Stone N. Chem. Soc. Rev. 2016;45:1919–1934. doi: 10.1039/C5CS00850F. - DOI - PubMed
    1. Day J. C. Bennett R. Smith B. Kendall C. Hutchings J. Meaden G. M. Born C. Yu S. Stone N. Phys. Med. Biol. 2009;54:7077–7087. doi: 10.1088/0031-9155/54/23/003. - DOI - PubMed
    1. Matousek P. Clark I. P. Draper E. R. C. Morris M. D. Goodship A. E. Everall N. Towrie M. Finney W. F. Parker A. W. Appl. Spectrosc. 2005;59:393–400. doi: 10.1366/0003702053641450. - DOI - PubMed

Substances